4
BUSINESS PLANNING FRAMEWORK
The framework we are about to describe provides organisations with a holistic way of planning and managing performance that links resources to workload and the achievement of business objectives.
LOGICAL OVERVIEW OF THE FRAMEWORK
Back in chapter 1, ‘Planning Fundamentals’, we established that the role of planning was to achieve an organisation’s purpose by managing what can be controlled within an uncontrollable and unknowable external environment. As a direct consequence of this, the focus of the planning framework is on cross-functional business processes, resources, and outcomes and how they link to business objectives.
The framework translates the six views of business processes as shown in figure 1-1, into a set of linked planning models and components (figure 4-1).
Figure 4-1: Key Components of the Planning Framework
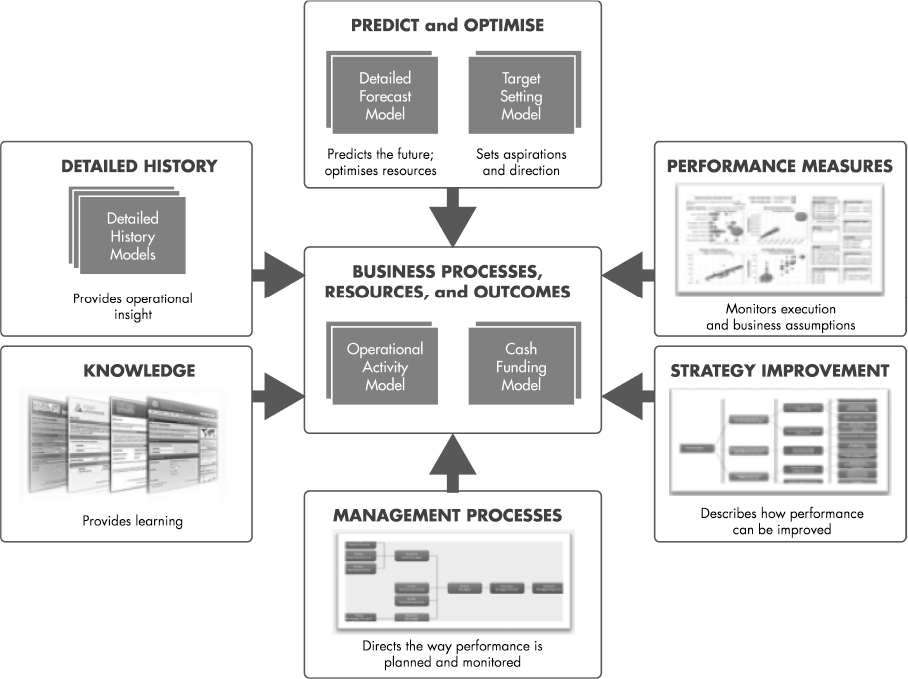
At the heart of the framework is the operational activity model (OAM) that describes an organisation’s business processes. This can be used to assess workload and resources required to meet objectives. The model also provides input to the cash funding model (C FM), to determine cash requirements and funding sources.
Around these two models are a series of other models and related components that provide different but linked views of performance
• Detailed history provides backup information on what actually happened
• Performance measures view results in comparison to the external business environment
• Predict and optimise looks at future targets and gathers realistic forecasts
• Strategy improvement assesses and monitors changes to business processes
• Knowledge holds management intuition and insight about the future
• Management processes direct and control those involved in planning and monitoring performance
As also mentioned in chapter 1, ‘Planning Fundamentals’, these areas are not independent of each other as they each provide a different view of managing performance that must be brought together in context for any decision that is made. Similarly, these areas do not necessarily mean that the individual models shown in the schematic are separate and disconnected physical models, as this will depend on the complexity and size of the organisation.
In the rest of this chapter we will present an overview of each area, while chapters 5-10 will go into practical details of how these models and components are set up. In these descriptions we have tried to keep the planning framework technology agnostic, but we will keep in mind the capabilities of modern planning technologies as discussed in chapter 3, ‘Planning Technologies’.
FRAMEWORK COMPONENTS
Operating Activity Model (OAM)
The central focus of the planning framework is on business processes. These typically involve departmental activities that work together in generating outcomes to meet the purpose of the organisation. In doing so, these business processes will consume resources, which could be in the form of knowledge or finances.
It is only by managing business processes and their related activities that things get done, and only by monitoring their effect along with the resources deployed can informed decisions be made with regard to future performance. This monitoring can involve real-time decisions based on useful information and an approach that is forward-looking, not historical.
The end-to-end business processes for any organisation can be grouped into core processes and support activities:
• Core processes are those that directly relate to the delivery of products or services to the intended customer. This includes how products or services are sourced, developed, manufactured, marketed, sold, delivered, and supported. It is typically these activities where most organisational value is generated.
• Support activities are those that enable the organisation to operate legally and in an effective manner. This includes how suppliers and employees are paid, monies collected from customers, the way the organisation is financed, and how it meets its legal and statutory responsibilities.
Sometimes the boundary between a core process and a support activity is not always clear. For instance, meeting satisfactory minimum standards of health and safety fosters compliance with the law (support) but also ensures an orderly production process and maintains commercial brand reputation. The key point to understand is that an organisation needs both types.
Core processes tend to be similar within an industry, but support activities are often common to all organisations. Figure 4-2 provides an example of the high-level activities of our fictious manufacturer that we introduced back in chapter 2 ‘Planning Methods and Methodologies’.
Figure 4-2: Sample Activities Through Which an Organisation Creates and Supports Value

The example in Figure 4-2 shows four core processes, many of which can be expressed as a chain of linked work activities and tasks. The sales process is responsible for the way products or services are promoted, how sales inquiries are handled, and the tasks that lead to a sales order. The product development process is where the organisation ensures it has a pipeline of new products it can sell, which in our example includes tasks for conducting market and product research, through to designing and conducting product trials. The production process is concerned with how raw materials and purchased components are converted or assembled into products that are then deliv ered to customers. The customer serv ice process determines how the organisation interacts with customers and clients once they have received the products or serv ices.
Supporting these core processes are a number of support activities that include how the organisation ensures regulatory compliance, how it generates funds to operate, the information technology (IT) infrastructure required, and so on. Each support activity has a number of tasks (not shown in the graphic) that may or may not form a chain, however each prov ides a vital service that enables the core processes to operate effectively.
Not all activities or tasks have to be fulfilled by the organisation. For example, some aspects of production could be outsourced to another company, as could Helpline and IT support functions. Competitive advantage is gained when these activ ities (for now we will categorise tasks with activ ities) are either performed more effectively or help to generate a higher level of value for customers.
Activ ities are ty pically implemented (or managed when outsourced) by operational departments that have specific res ponsibility for carry ing them out (figure 4-3).
Figure 4-3: Relationship Between Operational and Organisational Departments

With the preceding information in mind, the OAM is where the relationships between organisational objectives, business process activities, resources, and outcomes are defined. The OAM is comprised of structures that identify business processes and contains a range of measures through which departmental activities and outcomes can be judged. A detailed view of this model is provided in chapter 5, ‘Operational Activity Model’, along with the steps to follow in its creation.
The OAM holds a number of versions of data that can be used to assess whether the operation is functioning well and whether the resources allocated to activities represent good value. These versions include the following:
• Target. This is set by senior management as part of the strategic planning process and establishes the level of performance management desires for a given perceived business environment.
• Budget. This is an operational manager response that breaks down strategic targets into shorter-term departmental goals along with the expenses for resources required and the outcomes that are expected.
• Forecast. This is the current, realistic outlook that management believes will be delivered if the business processes continue as planned.
• Actual. This is taken from the organisation’s transaction systems and reliably reports with precision what was achieved.
• Benchmark. This final version holds industry or competitor data for some measures and can be used to compare and judge the organisation against the market or peer groups.
These versions are not fixed and may be extended to monitor, for example, best or worst case estimates and comparing multiple scenarios.
Cash Funding Model (CFM)
Sitting alongside the OAM is the CFM. Cash is the life-blood of an organisation that enables business processes to operate. It cannot be ignored. It can be both a resource and an outcome, which from time to time will need to source from outside the operation (for example, when first starting out in business or in funding strategic initiatives).
Businesses typically fail, not through a lack of profit, but through a lack of cash. This disconnect between profit and cash is sometimes due to operational factors like the failure to timely and accurately bill customers or collect cash, and sometimes through strategic factors such as the high cost of entering a market. As a key resource, cash needs to be carefully monitored and managed because once it is spent, it cannot be re-used.
Knowing when cash is available has benefits that can directly impact overall performance. Having a surplus means strategic initiatives can be brought forward. If cash is not going to be available as planned, then decisions can be delayed so that unbudgeted financing costs are avoided. Similarly, maximising the flow and availability of cash can result in securing low rates of bank funding when required, and it can help with lower operational costs by being able to take advantage of bulk buy discounts such as inventory purchases.
When you look at the three financial statements organisations rely on, it could be said that the
• cash flow statement is the most objective as it represents what money has come into an organisation.
• profit and loss income statement is the least objective as it is based on human estimations by applying interpretations of accounting standards.
• balance sheet statements are derived as a result of the estimations of profit, loss, and the truth of cash.
Because of its importance, cash and the source of funds is a key model when planning and monitoring business processes.
Detailed History Models (DHM)
The second area of the planning framework are the detailed history models (DHMs). These provide management with detailed analyses of what actually happened. They can be used to investigate abnormal variances in the OAM, as well as to confirm underlying trends and assumptions that were made when creating forecasts.
For larger, complex organisations the detailed history will probably consist of multiple models, each having a focus on a particular measure. The summary from those models is then transferred to the actual version of corresponding measures in the OAM. For example, a commercial company may have a more detailed history model in which total sales in the OAM are broken down by customer, product, channel, and so on. Similarly, the DHM may contain a list of general ledger transactions behind a departmental expense line that appears in the
OAM.
The subject matter of these DHMs and the level of detail are typically determined by the industry and activities being performed by the organisation. Not every measure in the OAM has to have a supporting model. It may be sufficient just to hold actual results within the OAM, with the supporting history models being added over time as required.
Within each DHM, users should be provided with analytical capabilities that allow them to search, filter, and produce additional summaries in different formats for their own investigative purposes. From a technology point of view, these models can be stored in a variety of formats, such as relational, multi-dimensional, and unstructured forms, and can come from external sources as well as internal systems.
DHMs tend to fall into the following categories:
• Transaction data sets. These come in the form of a tabular list containing fields that are often unique to each record. Examples include expense transactions or client purchases where the content has come directly from an existing system. In this case, the model can be used to support individual queries on actual results. Capabilities should also exist that allow the data to be summarised, sorted, and filtered.
• Business intelligence (BI) analytical models. These store data in a multi-dimensional format that allows users to conduct analyses rather than query individual records. These analyses create cross-tabulations that are able to
○ view data from different business dimensions (for example, show all actual sales for product X by location, or show actual versus budget for all locations by product).
○ compute new measures (for example, the percent of total sales made for each product or location).
○ identify trends (for example, show the annual average sales growth by period for all locations).
○ show exceptions (for example, show just the top ten products whose actual sales were greater than budget).
The benefit of a BI model is it provides the user a wide range of analytical capabilities that cannot be produced from a transaction set.
• Unstructured models. These models consist of information that is not organised in a predefined manner. In other words, it is not possible to categorise the data in terms of fields or records, as you can with transaction sets and BI models. This data will typically include dates, text, and numeric information, and tends to come in the form of electronic documents, website content, comments, audio, and video. This type of data can be stored and analysed through specialist software that can then be used to back up data within the OAM.
Whatever type of history model is chosen, not all dimensions need to be represented in the OAM. There are cases when the supporting model will have a lot more detail, such as invoice number, customer, product, location, transaction ID, sales representative, and so on. However, there must be a minimum number of key fields that link it directly with the OAM. These keys should include a member of each business dimension used in the OAM, which will typically include measure, department, period, year, and version.
Linking a DHM to the OAM causes designated values to be summarised and transferred so that the number reported in the OAM is exactly the same number as the summary of the detail provided in the supporting model. If a change occurs in a supporting model it should automatically feed through to the respective measures in the OAM.
Target Setting Model (TSM)
The aim of the target setting model (TSM) is to allow senior management to set aspirational goals and strategies for the organisation to achieve in the medium- to long-term. This model will be at a summary level and include a mixture of financial and operational measures. Input will come from current actual and forecast data, typically stored in the OAM, and structures that represent the future operation of the business for a given business environment. The model is also typically driver-based and links operational activities to long-term objectives. This allows management to quickly assess changes to business assumptions and the driver variables.
The TSM is used extensively when setting the long-term direction of an organisation and may come in multiple versions as different structures and objectives are evaluated. Once an agreement has been reached on goals, the model that generated them is used to populate the target version in the OAM for later comparatives. Other model versions may be kept for reference as part of organisational knowledge.
Detailed Forecasting Model (DFM)
In contrast to the TSM, the detailed forecasting model (DFM) is used to collect information on what is likely to happen,. Again, depending on the complexity of the organisation, there may be multiple models involved, each having a focus on a specific business area. In manufacturing, this could include a sales and operational planning model that seeks to balance demand with production so that the manufacturing process is run efficiently in terms of the resources it consumes. In the service sector, this could include modelling the type of customer interaction with the level of skill required in order to determine the appropriate staffing levels.
In both cases the DFMs must first acquire the latest forecast information along with the current business structures in place. For many organisations, the data is likely to be at a lower level of detail than found in the OAM, and so a separate model is required to collect and hold it.
Optimise Resources Model (ORM)
The optimise resources model (ORM) shows how assigned resources can be optimised in line with the forecast. In a complex organisation this may require specialist algorithms that can iterate through a range of scenarios before coming up with the most effective outcome or use of resources.
Summaries from the ORM are then passed to the OAM for comparison with actual, budget, and target data.
Performance Measures Model (PMM)
The planning framework is able to provide reports and analyses that help management assess current and projected performance. Most of the data in these reports is likely to come directly from the OAM as this holds much of the key information regarding performance, although supporting history and forecasting models may be able to provide some specific insights.
However, to fully understand performance, some data will need to be combined with external information. For example to assess the efficiency of business processes in comparison to competitors. As to whether this area needs its own model, to some extent, will depend on the technology system being used and the complexity of the organisation. For our purposes, we will envisage this area as being a separate model—the performance measures model (PMM)—that has direct links to the other models as well as external market or social media data. This model is then enriched with calculations and analyses.
Output from the PFM can be in a variety of formats including grids, charts, colour-coded variances, strategy maps, dashboards, scorecards, and combinations of all of these. The latter point is important, as the way in which data is displayed will determine how the information is assessed and any actions that it may trigger. To this, reports must also be able to handle notes, comments, attachments, and more.
Strategy Improvement Model (SIM)
Organisations should never stand still or rest on their laurels. Alternative solutions, technologies, and competitors with better business models will constantly chip away at the organisation’s ability to achieve its goals. For this reason, senior management is charged with a continual quest to improve established business processes, as well as to consider alternative markets or products that it could move into to achieve its mission.
This is where strategy comes in, which forms the next component of the framework. Strategic and operational planning processes are typically focused on the development of projects or initiatives that seek to improve the organisation’s capabilities or existing business processes. Strategy impacts all parts of the organisation; it is not simply a financial concept.
According to Michael Porter, each organisation’s business model should be unique as it forms the basis on how it gains a competitive advantage over other companies operating in the same market. For example, if company A is in the same business as company B, for one to gain an advantage over the other, there must be more value on the offer to a prospective customer for the price, compared to what is being offered by the other company. The only way they can do this in a sustainable way is by improving the way they add value, and hence the operation of the business.
There are many methodologies such as the balanced scorecard that can help organisations choose the most appropriate initiatives. Although each methodology has its own specific terminology, they tend to have a common approach, and that is to view initiatives as a cause and effect or strategy map (for example, figure 4-4). Whatever method is chosen, they will need to be linked to the OAM and CFM, as together they form the overall plan of how the organisation intends to meet its objectives.
Figure 4-4: Strategic Initiatives are Typically Focused on Improving the Organisation’s Established Business Model

In the book titled Best Practices in Planning and Performance Management, author David Axson cites that a planning characteristic of high performing companies is that they separate sustaining current operations from improving current operations and embarking on new ventures or initiatives. The planning framework with its strategy improvement model allows this separation to continue, but also to bring them together to see the overall impact on resources and outcomes.
A natural way of viewing initiatives is to consider them as new projects that consist of a number of activities not currently being performed by the organisation. Unlike a budget, initiatives (throughout this book we will refer to projects as initiatives) will be continually proposed and form a wish list of what an organisation could consider to choose to do, but may not necessarily do.
To assess which initiatives are to be adopted requires a planning system to model them in isolation and in combination with other initiatives. This allows managers to optimise the impact of initiatives with the resources av ailable while taking into account the market opportunity and competitor activity.
Once chosen, initiatives will need to be tracked in terms of their impact and the resources being consumed. This will be for both past performance to assess if they achieved what was planned, and for future performance to assess if they are going to achieve what was planned. Depending on the answers to these questions, initiatives may need to be rev iewed, modified, replaced, or even cancelled.
Management Processes
Management processes are the mechanism by which performance is planned, resourced, and monitored. They are primarily concerned with ‘what’ and ‘when’. From a user point of view, they determine when users interact with the different planning models previously described. From a data flow point of view, they determine what and when data flows between those models.
For example, the budget process typically requires departmental managers to plan expenditure by month for the upcoming year, whereas forecasting sales may be required by week for cash flow purposes. To monitor performance, there will be a need to automatically flow data between transaction sy stems and the planning models on a weekly or daily basis. However, to review funding, the flow of data to the funding model may only be required on a quarterly basis.
In general, management processes are typically seen and often implemented as the six distinct processes of strategic planning, tactical planning, financial planning, forecasting, management reporting, and risk management. However, as figure 4-5 shows, these six processes consist of a number of interconnected sub-processes that together form the basis for managing performance.
Figure 4-5: Performance Management Processes Combine to Form a Single Process Aimed at the Execution of Strategy

Each sub-process is critical to the management of the organisation, none can be left out. They need to be performed in a particular order and by different parts of the organisation. Even within an activity, there are interconnected tasks that each department has to perform, in a specific order and at specific times.
For example, budgeting may start off with the setting of a high-level target to which sales respond on how this will be delivered throughout the year. To do this they may need to work in collaboration with marketing and production. Once this has been completed, other areas of the organisation can start allocating resources that fit in with the sales and marketing plan.
In the past these planning and reporting activities were run according to the organisation’s planning or reporting calendar, and they focused on a particular period of time such as the current or next year. But as we have seen, the volatility of today’s business environment means that organisations are now unable to reliably predict events even a few months out, and so it makes little sense to wait for the next annual planning process when dealing with unexpected issues.
In the book Best Practices in Planning and Performance Management, research into high-performing companies found that
Best Practice companies decouple their internal management processes from the calendar and provide a set of planning and reporting processes that utilise continuous processing and monitoring of activity. The passage of time becomes (just) one of many criteria for triggering the reporting of information or the initiation of planning or forecast activities.
The report goes on to say, ‘[a]spects of strategic planning are not once-a-year events but a continuous process. The pace of change is so great that management needs to monitor the strategic implications of new developments on a continuous basis’.
As a consequence of this, the planning framework recognises the following:
• Although planning is seen as a discreet process, in reality it is comprised of multiple activities that have strong links to activities within other processes.
• Planning and monitoring activities need to act as a single continuous process triggered by events and exceptions.
• For effective performance management, none of the six management processes can be left out.
• What goes on within these processes and how they are interconnected will determine whether performance is effectively managed.
Knowledge
The last part of the planning framework is knowledge. Knowledge can come in many forms, much of which is not easily stored or retrieved through electronic systems. In the context of the planning framework, knowledge that is related to business processes exists in the following questions:
• What actions have been tried before and how did they perform and succeed?
• What would we do differently if we knew what we now know?
• What trends do we think are occurring in the business landscape and how are we positioned to make the most of them?
Knowledge is continually acquired and can be a valuable resource if a way is found to capture it and make it available in an easily accessible format.
REPORTING FROM THE PLANNING FRAMEWORK
All of the models within the planning framework can be used for reporting. These are not discrete views of performance, but are linked with a focus on answering the following questions:
• QAM. What did we achieve against the plan in relation to resources, workload, and outcomes for each business process? Is performance getting better or worse? How do each of these look for the future?
• CFM. What is the cash outlook and from what sources can this be funded?
• DHM. What is the detail behind the resources, workload, and outcomes reported by the OAM? How does this compare to previous periods?
• TSM. How accurate are the relationships between resources, outcomes, and business processes in predicting future performance?
• ORM. How are business processes best optimised to produce planned outcomes?
• SIM. What changes do we need to make and are they on track?
• PMM. How does performance relate to what is going on in the business environment and in comparison to competitors or peers?
That completes the framework overview. In the next few chapters we will look at how each of these models are derived and the way in which they can be put together.
CASE STUDY OVERVIEW
To help explain the concepts within the planning framework in more detail, we have created a fictitious company that we will use as the main example. For continuity purposes, XYZ, Inc. will be our stationery manufacturer, as introduced in chapter 2, ‘Planning Methods and Methodologies’. Although we have chosen a commercial organisation, hopefully readers from other industries will see how these can be made to apply where they work, including those from the services sector, government, and not for profit agencies.
About the Case Study Organisation
XYZ, Inc. is an international manufacturer of quality, personalised stationery products that are sold through different channels and in different locations around the world.
The market for personalised stationery products is undergoing rapid change as interactive websites and smartdevice applications provide organisations with the ability to self-service the design and ordering of products that are unique to their particular brand.
XYZ ‘s senior management is determined not to be left behind and has introduced a radical change programme that protects both its existing business streams and allows it to take advantage of intelligent web applications. As this is a volatile and fast changing environment, traditional annual budgets assigned to cost centres are inadequate to support the organisation’s strategy.
To succeed, it is vital that XYZ’s management understands their corporate strategy and their involvement in its implementation, and that its management processes are agile so that adjustments to operational plans can be made quickly as market conditions dictate.
Company Structure
From an operational point of view, figure 4-6 shows how XYZ, Inc. is split into business units.
Figure 4-6: Case Study Organisation Structure

The core business processes are controlled by the following:
• Sales departments. These are organised by geographic location and include orders taken via the Internet. Sales are planned by product and by major client, where appropriate.
• Marketing. This department is responsible for deciding which products are promoted in each location (operational marketing) and evaluating future products to be developed and sold (product marketing).
• Customer service. This department is responsible for dealing with customer queries once a product has been sold.
• Production. These departments are responsible for the procurement of raw materials and components, the manufacture and assembly of products based on sales orders, and in delivering products to customers.
There are a number of departments supporting these core processes that include IT, human resources, finance and public relations.
Company Strategy
The overall aim of XYZ is to grow by adopting the following objectives:
• Develop strong relationships with educational establishments
• Become involved in a self-service website and smart applications for design and order
• Become more efficient
To do this it has developed a number of strategic initiatives that are planned to enhance its current business model. These include the following:
• Educational marketing campaign This will be aimed at educational establishments to encourage them to buy branded stationery products and offer them to students.
• Specific products. This will involve visiting larger establishments to see what products they would like that are currently not offered by XYZ. This could include things like exam paper revision folders that are branded with the university and department being served.
• New territories. This will look at setting up offices to serve cities where XYZ does not have a presence.
• New website. This will see the first pass of the interactive self-service design and order Web pages that will initially focus on pens.
• Smart phone design applications. This will provide the new self-service page as a downloadable smart phone application.
• Sales training. The existing sales force will be trained on the new products being offered and how they can compete better.
• Re-equip plant. To make production more efficient and ‘green’, much of the older equipment will be updated or replaced.
• Retain staff. An experienced staff is essential to improve sales rates. This initiative looks at ways of improving morale to prevent good staff from joining competitors.
Versions and Other Information
XYZ, Inc. plans and tracks performance in four separate versions:
• Target. This is where management set aspirations for the future performance of the company.
• Budget. This is the bottom-up response from operational managers to the targets set.
• Actual. This is used to track what actually happened.
• Forecast. This is used to predict what is likely to happen should things continue as they are.
There is also a fifth version—benchmark—that is used to track performance against the market or major competitors should the relevant information be available.
Other details such as measures and processes to be supported can be found within the appropriate chapters.
So let’s take a look at how this case study can be implemented within the planning framework.