
Creating a new cube is very similar to creating a report. We use the same editor and the same objects. There are restrictions on which objects can be used inside a cube; for example, consolidations and custom groups cannot be added to the cube definition. However, there are alternative techniques that provide the same functionalities like derived elements (check the product documentation). Now that we learned how to transform a report into a cube, we will try to create a new one from zero. And this time we want it bigger.
Out of the box the limit for a cube dataset is 32,000 rows. We need to change that in order to do this recipe. Go to the Project Configuration window (right-click on the project name in the Desktop application) and set the Governing Rules | Default | Result Sets parameters (as in the following screen capture):
- Intelligent Cubes:
128000 - All other reports:
128000
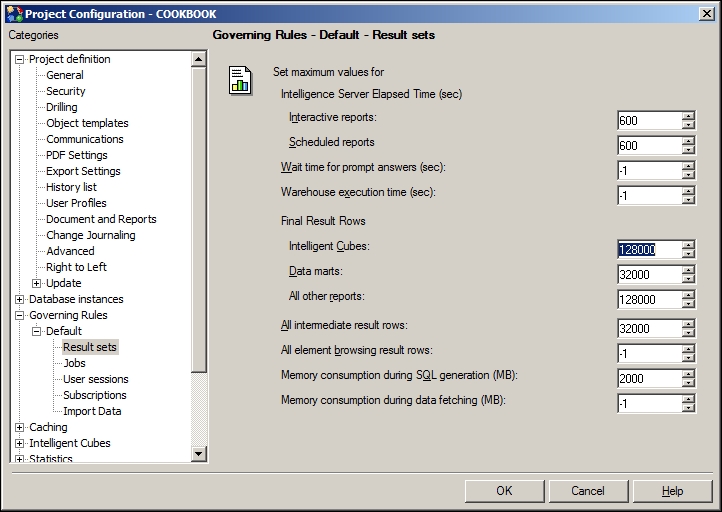
This setting will allow us to create a cube bigger than 32,000 rows.
Before building the cube, we create two additional metrics:
- In the Public Objects | Metrics folder, right-click on Sum USD SalesAmount from FactResellerSales and select Edit from the context menu.
- In the Metric Editor, click on File | Save As… and type
Sum USD SalesAmount from FactResellerSales Previous Month. Click on Save. - Now click on the line that says Transformation = (nothing) on the right and drag the Previous Month transformation from the Object Browser section onto the grid labeled Transformations.

- Save and Close this new metric.
- Repeat steps 1 to 4 with Sum OrderQuantity from FactResellerSales to create a new metric named
Sum OrderQuantity from FactResellerSales Previous Month. - Go to My Personal Objects | My Reports folder, right-click on an empty area on the right and select New | Intelligent Cube.
- Leave Empty Intelligent Cube selected and hit OK.
- The Intelligent Cube Editor is very similar to the Report Editor. Click on the Public Objects shortcut and navigate to the Metrics folder.
- Add the following metrics to columns:
- Sum USD SalesAmount from FactResellerSales
- Sum USD SalesAmount from FactResellerSales Previous Month
- Sum OrderQuantity from FactResellerSales
- Sum OrderQuantity from FactResellerSales Previous Month
- Sum Freight from FactResellerSales
- Sum TaxAmt from FactResellerSales
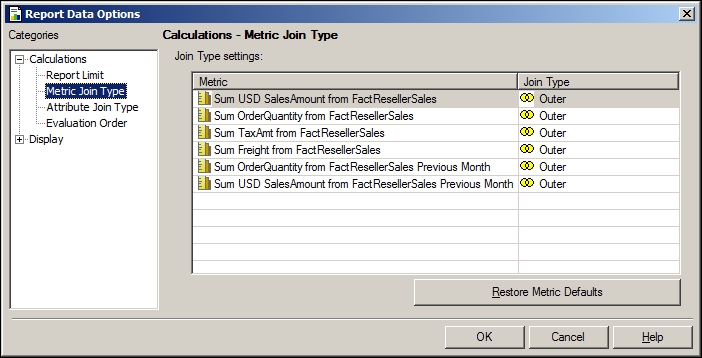
- Open the Data | Report Data Options… menu and go to the Metric Join Type category.
- Set every Metric Join Type to Outer, like in the following screen capture, and confirm with OK:
- Click on the Attributes shortcut and add the following attributes on rows:
- Currency
- Employee
- Month
- Product
- Product Category
- Product Subcategory
- Promotion
- Reseller
- Salesterritory Reseller
- Year
- Open the File | Save As… menu and name it
54 ResellerSales Cube. - Click on the Run Report button. This time it will take considerably longer than other previous reports.
- At the end, you will see a message saying that the result data has been published as
Intelligent Cube <54 ResellerSales Cube>. - Close this window and go to the Administration | System Monitors | Caches | Intelligent Cubes folder.
- Right-click on the cube 54 and select Quick View. Note down the Total number of rows and close this window.
- Now open MicroStrategy Web from Start | All Programs | MicroStrategy | Web | Web.
- Click on the COOKBOOK project and log in with
Administratorand the corresponding password. - Open My Report folder and scroll down to find the cube number 54.
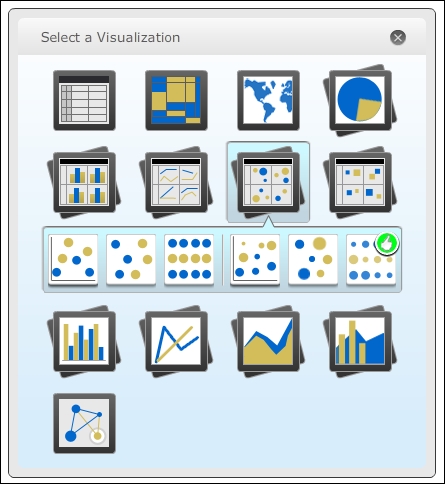
- Right-click on the cube and from the context menu select Create Analysis (starting from 9.3.1 this will be Create Dashboard).
- After a while you will be presented with a dialog box titled Select a Visualization. Click on the round X on the top-right corner of this dialog, we will select a visualization later:
- Welcome to the Visual Insight window. Move the cursor over the VI toolbar (not the MicroStrategy one) and click on the second button from the left (tool tip: Show Dataset Objects).
- You will see a new pane (titled Dataset Objects) on the left with all the attributes and metrics included in the cube plus an extra Row Count metric.
- Click on the Row Count metric and drag it to the second pane (titled Grid) inside the Columns area. Note that the border of the area turns green and the cursor changes to a plus symbol shape (white on green).
- When you drop the object, the right part of the screen changes to a grid named Visualization1, and the Row Count value matches the number that we noted down in step 17. See the following screenshot:

- You can close the browser window without saving.
We created a cube with many attributes and metrics, and published it. Once published, a cube can be used as a source dataset for reports, documents, and Visual Insight analyses. You may have noticed that all the objects contained in the cube come directly from one single fact table (FactResellerSales) or are hierarchically related to the fact table, like the Month and Year attributes. What we have done here is, in fact, denormalized data mart from a star schema. MicroStrategy stores the dataset in binary format and adds a row counter to the cube.
From the web browser, we created a new analysis with Visual Insight to check that the cube was correctly built and available.
From the Administration | System Monitors | Caches | Intelligent Cubes folder, you can right-click on a cube and choose Delete. The cube will be removed from memory and from the disk, but the cube definition will not be deleted from the metadata. You can still find the cube in My Reports folder; if you re-execute, it will be published and available again.