
Another useful feature that many analysis tools offer is the ability to color values depending on a condition. In MicroStrategy, these conditions are called thresholds.
In this recipe, we will color some cells in the 20 Cities sorted by SalesAmount report based on the metric value.
Double-click on the report to run it:
- Click on the Data | Thresholds… menu.
- In the Thresholds window, click on the text New Threshold and change the name to
Less than 4000. - Hover the mouse on the Click here to start a new qualification link and click on it; the text changes to Field Operator Value.
- Select Field and choose the Sum SalesAmount from FactInternetSales metric.
- From the Operator list, choose Less than and under Value | Type a value, enter
4000and then click on the white text area on the right, where it says 1234.12 to bring up the Format Cells dialog. - Here, you can apply different colors to different parts of the cell; for example, click on the Background tab, open the Background style drop-down list and select Solid.
- Then choose a Fill color from the palette (for example, Gold) and click on the Font tab.
- Here, change the Color combobox to red and the Bold value to Yes, then confirm by clicking on OK.
- Hit OK again and the values below 4,000 are now highlighted.
- We can add as many conditions as we want. Let's make another for the values under 10,000. Click on Data | Thresholds… and then on the New… button, which looks like a small traffic light in the toolbar.
- A new condition is added; now rename it
Less than 10000. - Create the condition with the Sum SalesAmount from FactInternetSales metric, Less than, and type a value of 10000.
- In the Format Cells dialog, set Background style to Solid and Fill color to Light Yellow and in the Font tab set Color to Brown and Bold to Yes; confirm with OK and OK again.
- Now the values between 10,000 and 4,000 are highlighted differently.
The order of the threshold conditions is important. They are applied starting from the bottom to the top; so that the top rule overrides the bottom one. Try it yourself: in the Thresholds window there are arrow buttons in the toolbar to move the conditions up and down the list. See the effect on the report when you change the order of the conditions.
Not only can we change the formatting but also replace the value by typing a text or inserting a small image. Think about the green up arrow and the red down arrow in many stock exchange reports. When you click on the Format label, a small listbox appears where you can select how to modify the metric value, as shown in the following screenshot:
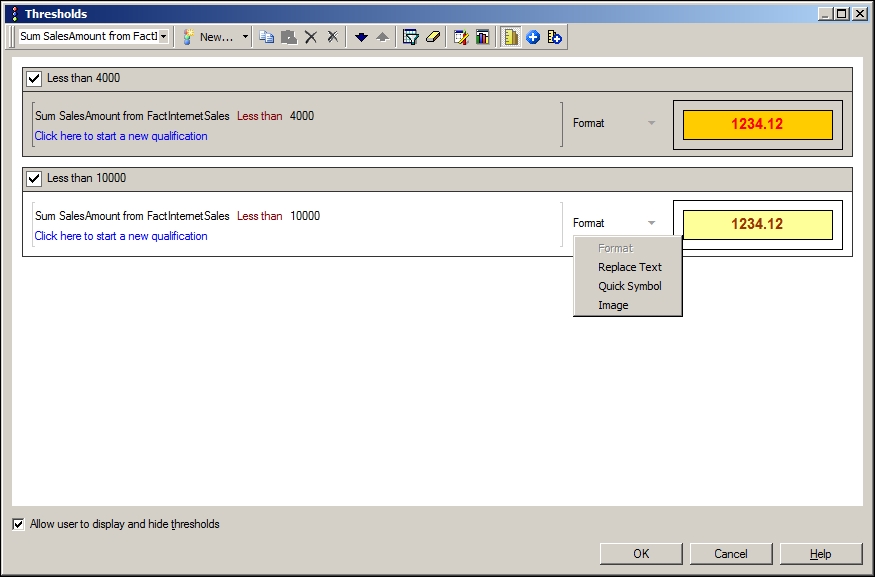
Try to select
Replace Text and write underperforming in the text area on the right.