
Appendix E. Themodynamic Properties
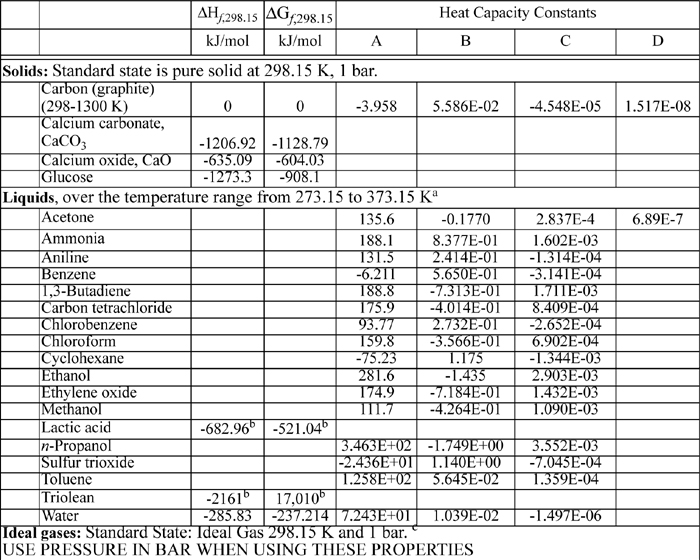
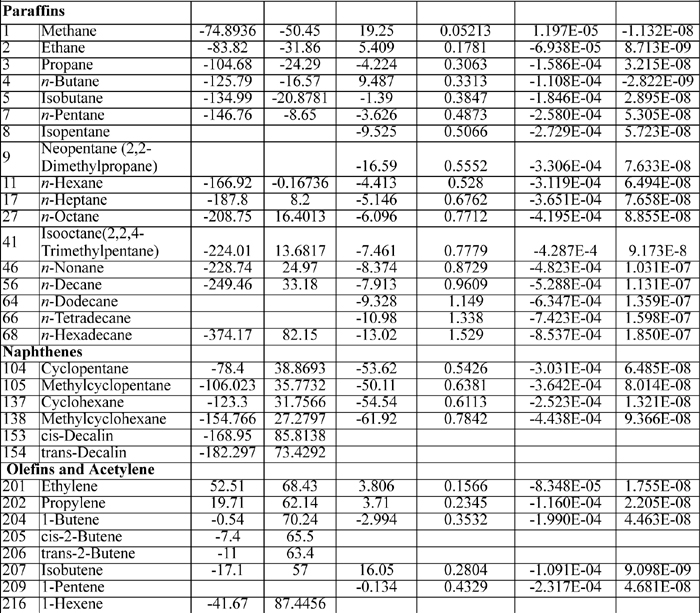
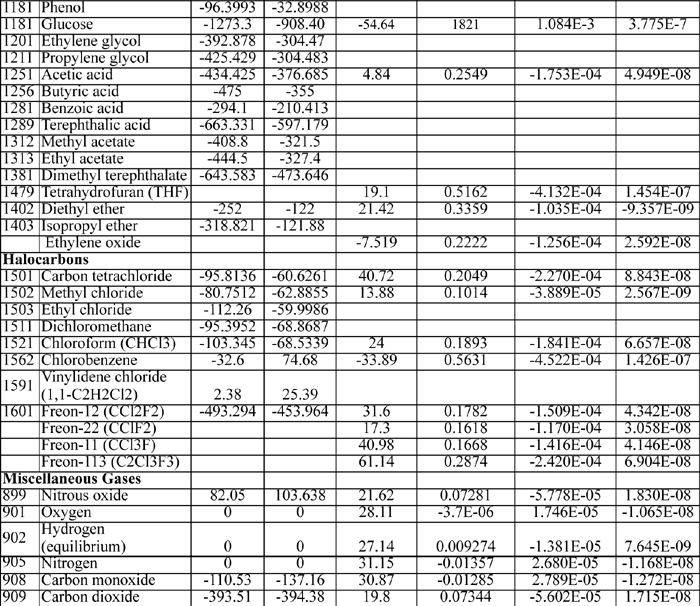
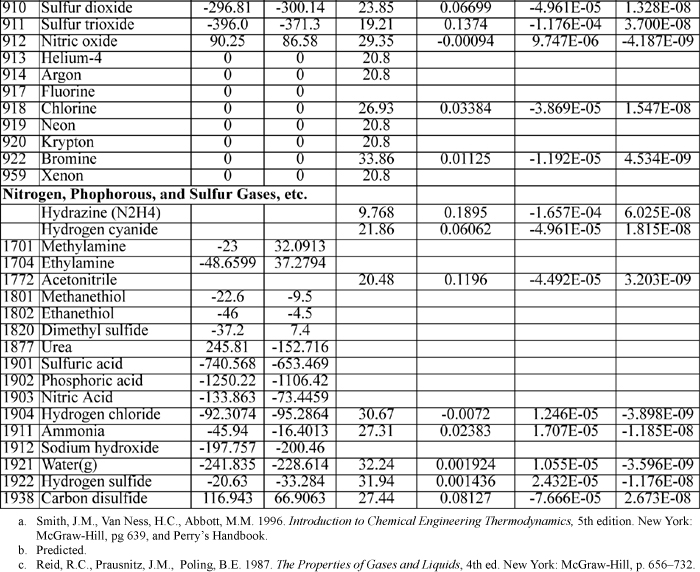
E.1. Thermochemical Data
The heat capacity coefficients are used in the equation:
CP = A + BT + CT2 + DT3
where T is in K and CP in J/mol-K The heat capacities tabulated on the back flap are only suitable for quick order of magnitude calculations. The full form of the heat capacity should be used when possible.
Note that the value of the heat capacity at room temperature is not given by the first coefficient A when other coefficients are present. The polynomial should not be truncated.

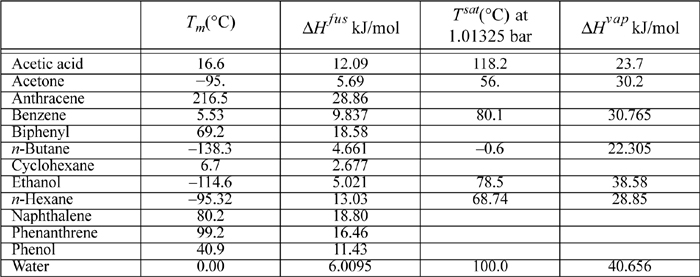
E.2. Latent Heats
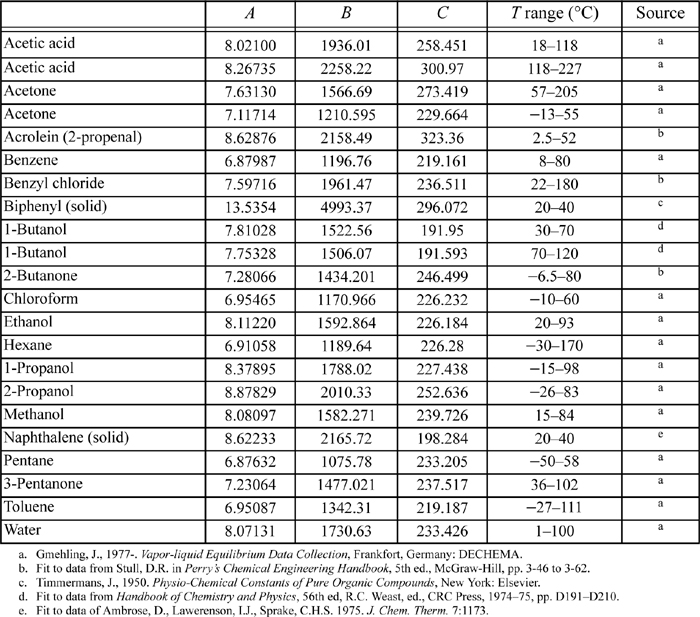
E.3. Antoine Constants
The following constants are for the equation
where Psat is in mmHg, and T is in Celsius. Additional Antoine constants are tabulated in Antoine.xls.
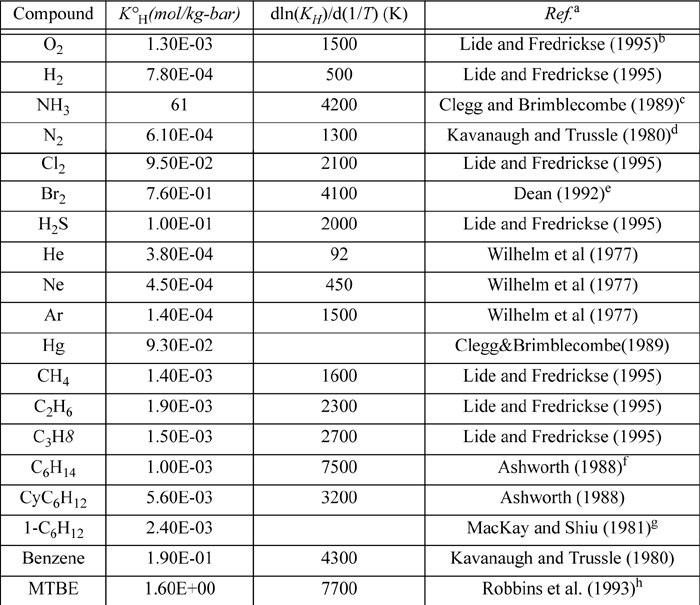
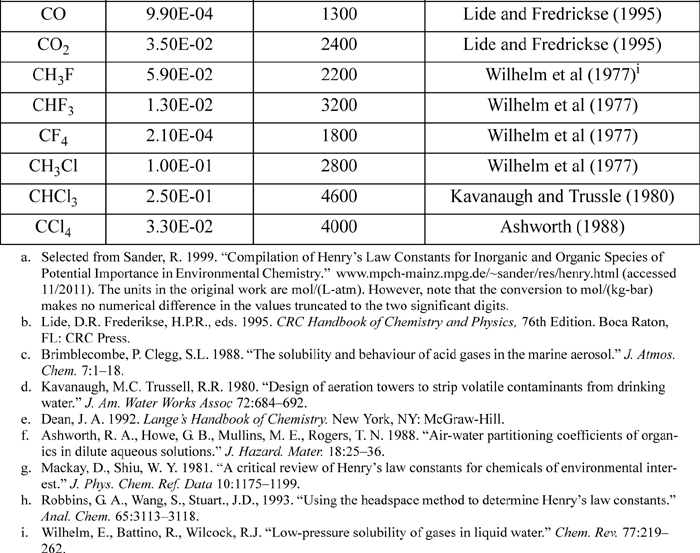
E.4. Henry’s Constant with Water as Solvent
Selected from the compilation of Sander. KH(T) = K°H exp(d(ln(KH))/d(1/T) ((1/T) – 1/(298.15 K))
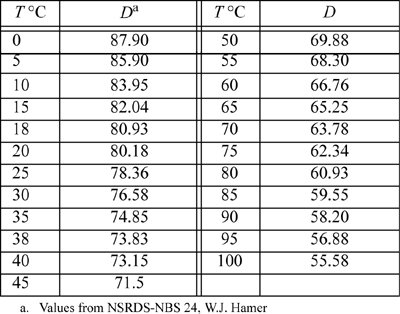
E.5. Dielectric Constant for Water
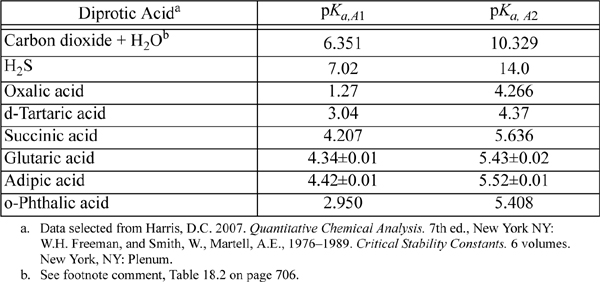
E.6. Dissociation Constants of Polyprotic Acids
The constants are at 25°C and I = 0.
Triprotic: o-phosphoric acid, 2.148, 7.198, 12.375.
Tetraprotic: citric acid, 3.128, 4.761, 6.396, ~16?(hydroxyl)
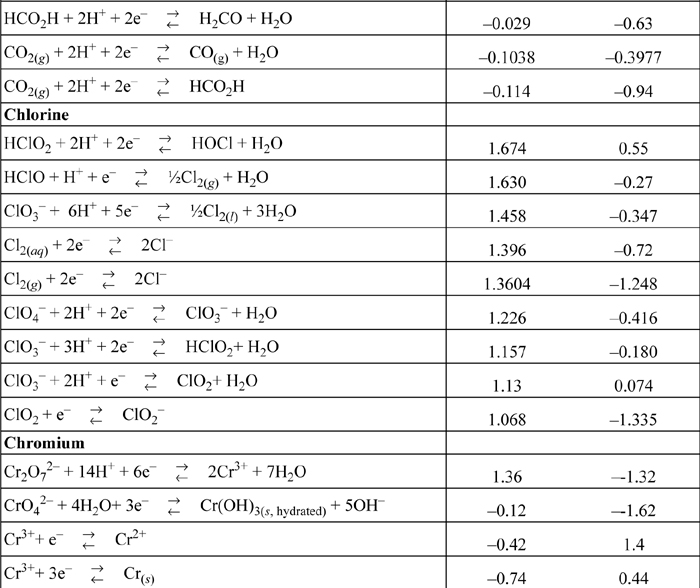
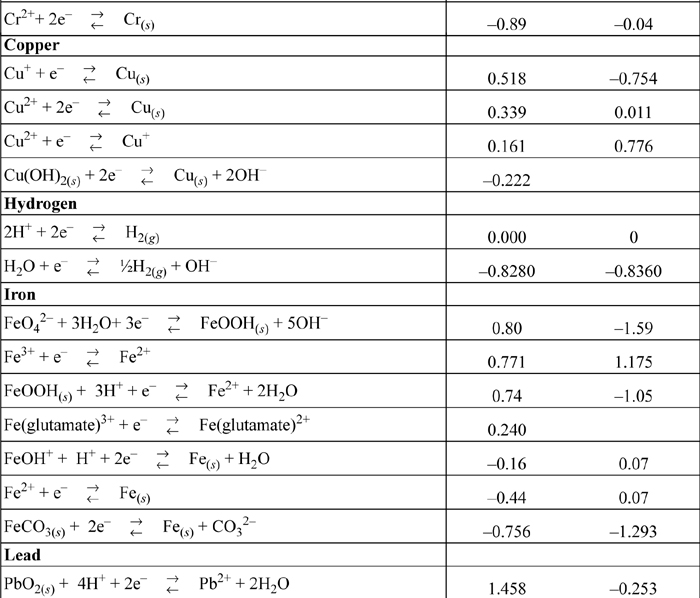
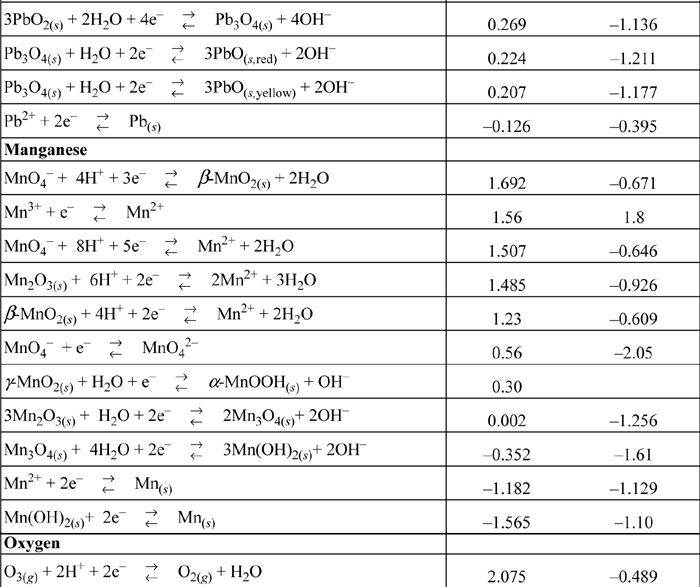
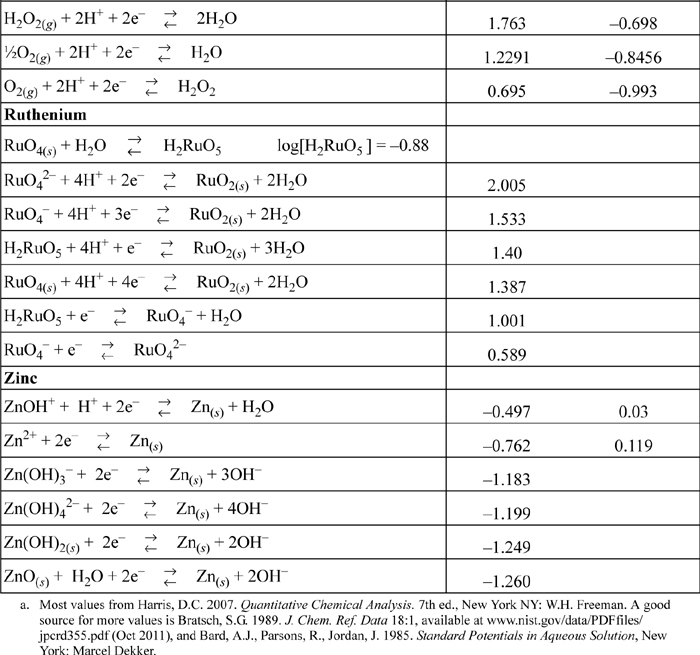
E.7. Standard Reduction Potentials
All species are at 298.15 K and 1 bar aqueous unless otherwise noted. Gases are at 1 bar partial pressure and pressure is measured in bar. The molal standard state is used for soluble species, with a molal activity coefficient of one at infinite dilution. For water the standard state composition is pure water. The temperature coefficients permit calculation of E°T = E°298.15 + (dE°/dT)(T – 298.15). This small subset is representative.

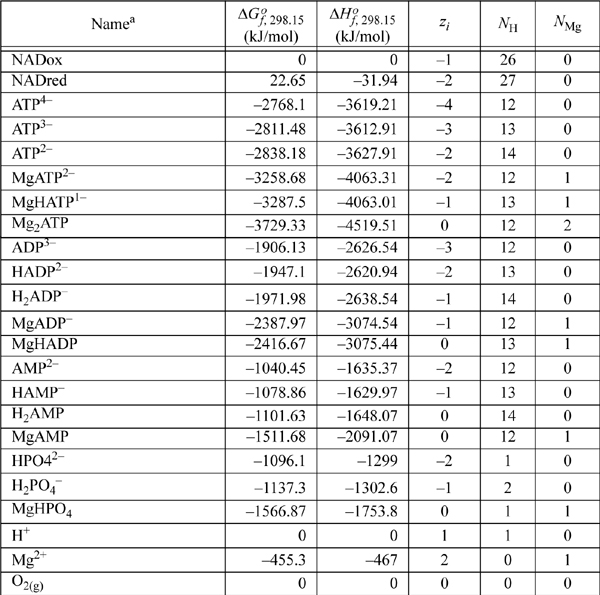
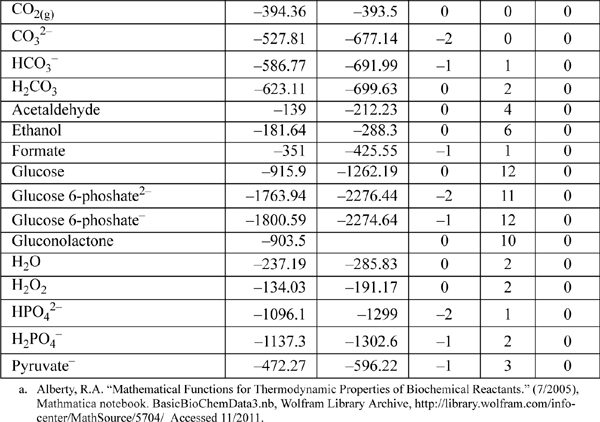
E.8. Biochemical Data
Standard state for soluble species is an ideal solution at 1 M except for water, which is relative to the Lewis-Randall standard state. The data are for the untransformed Gibbs energies and enthalpies.
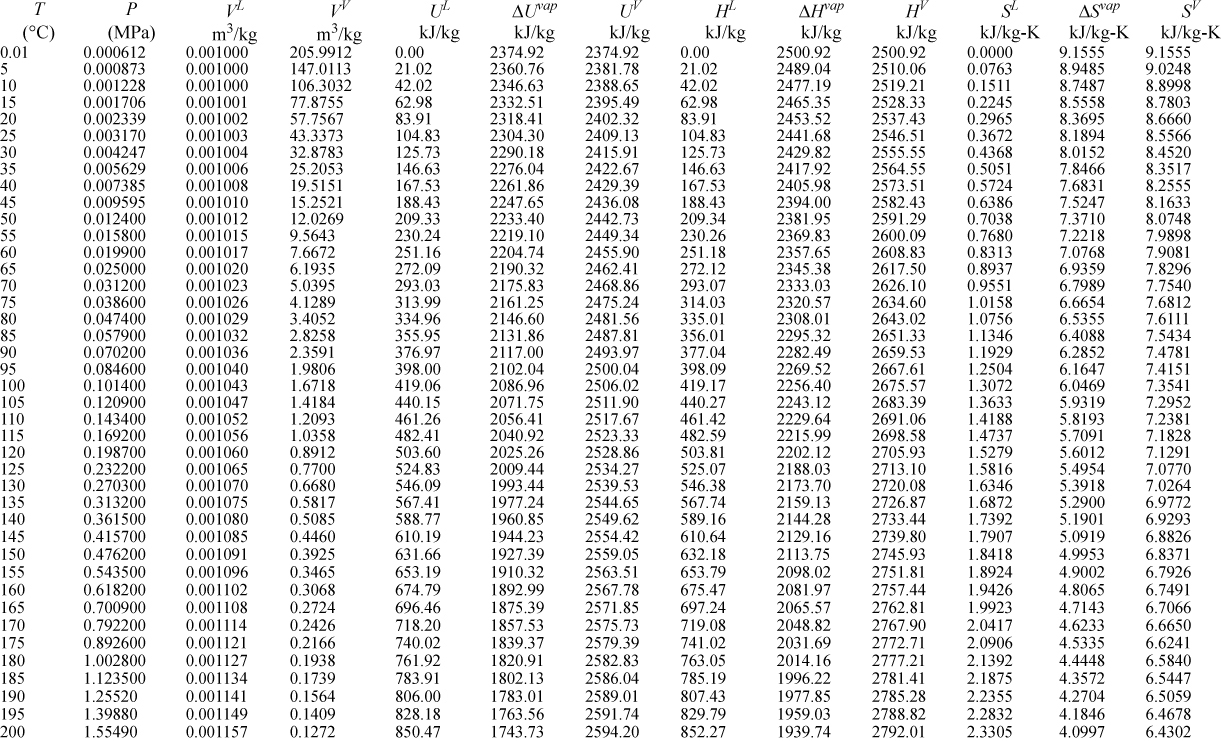
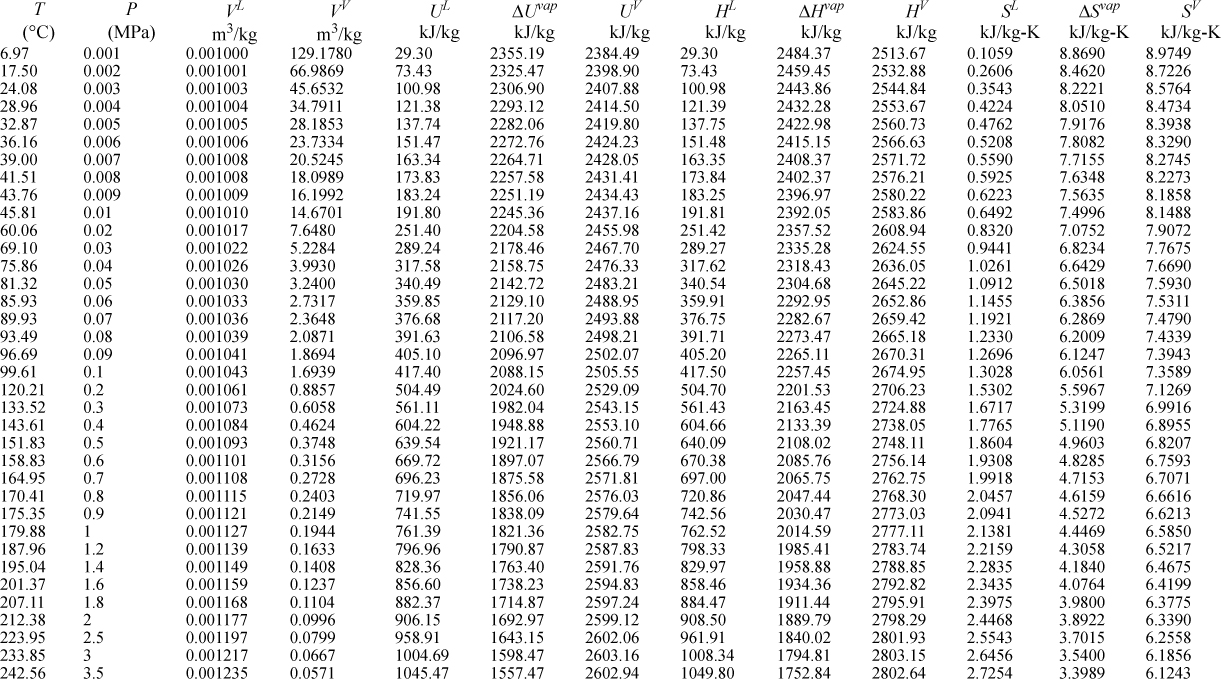
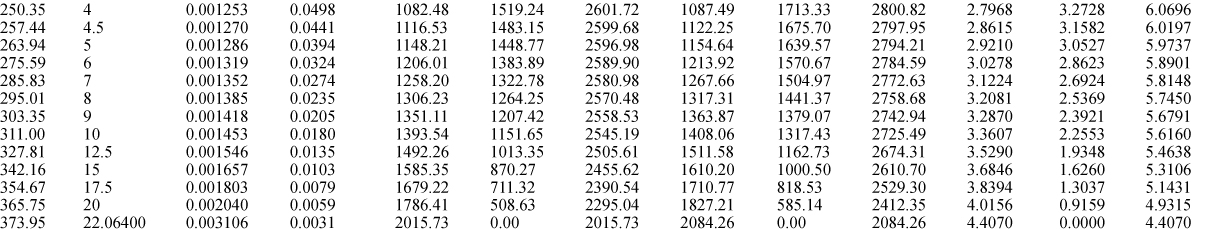
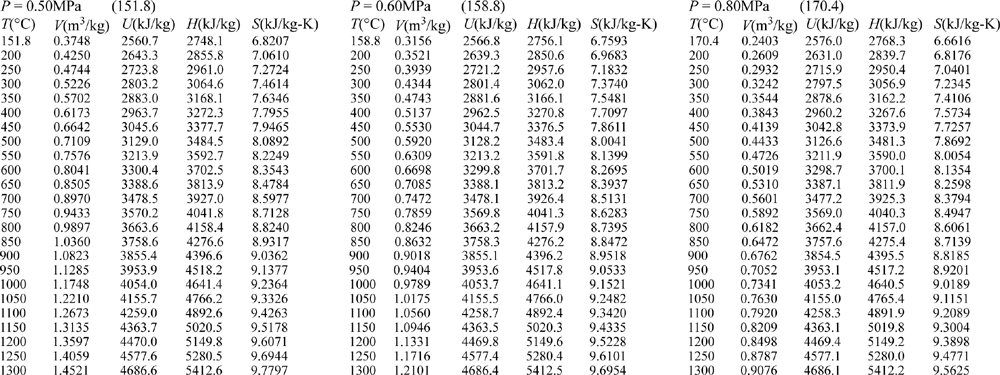
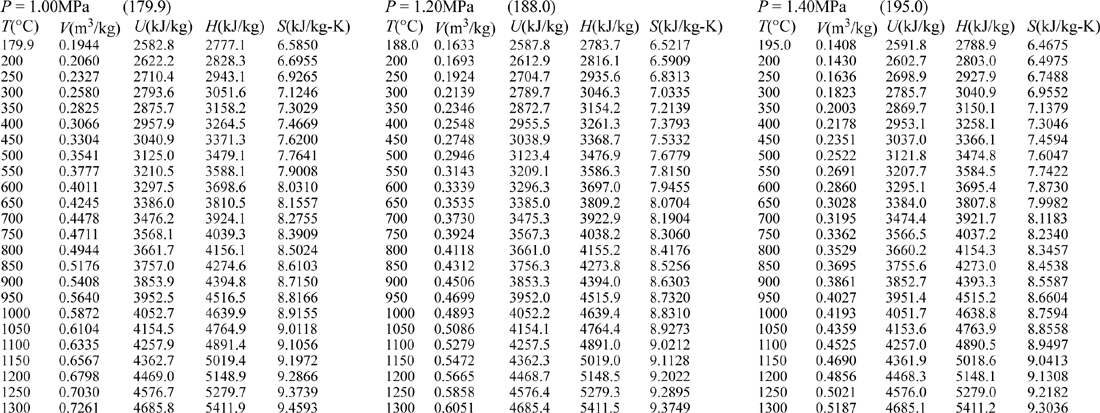
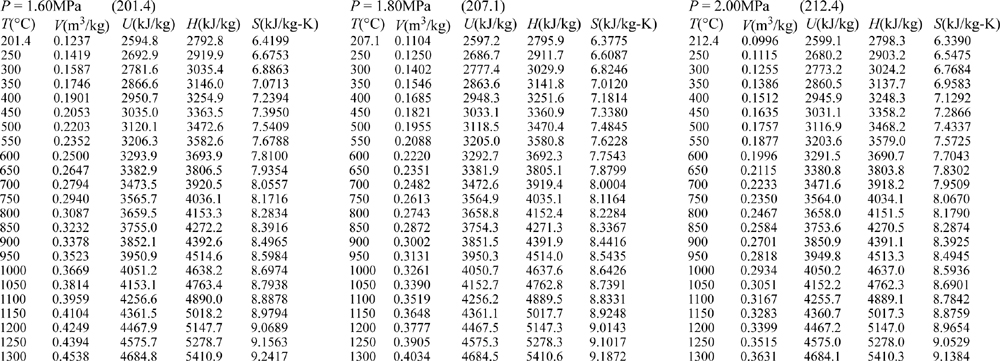
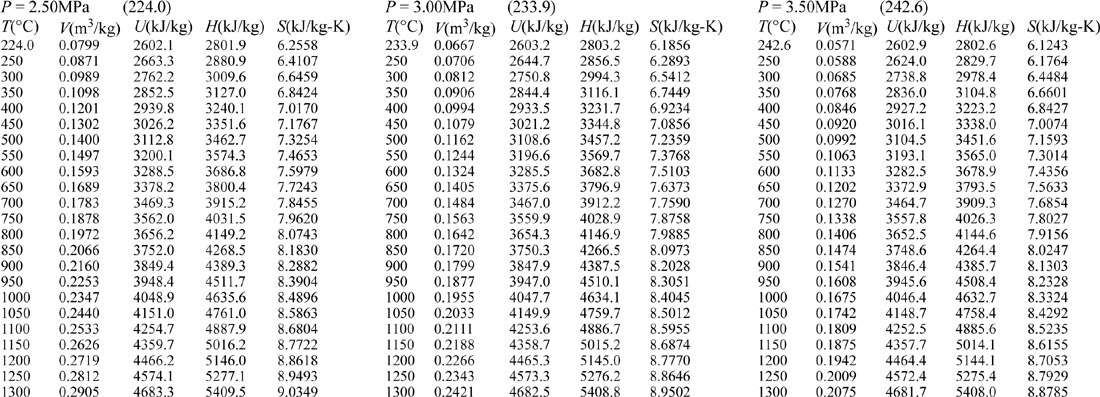
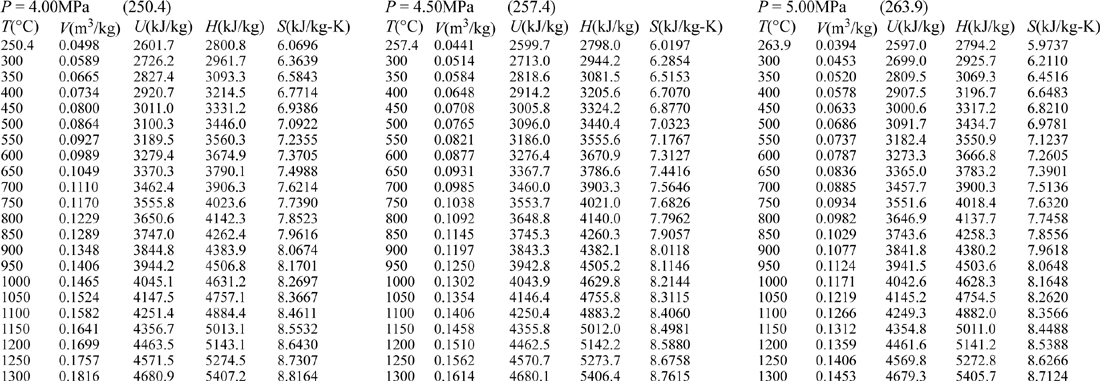
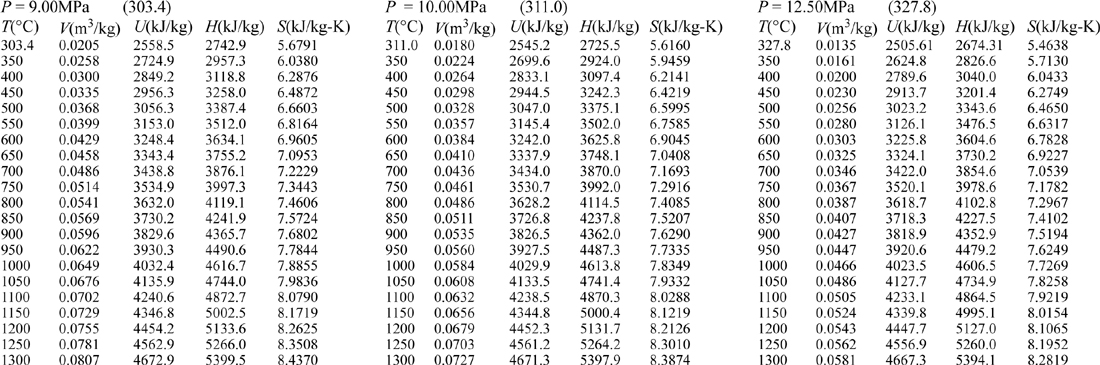
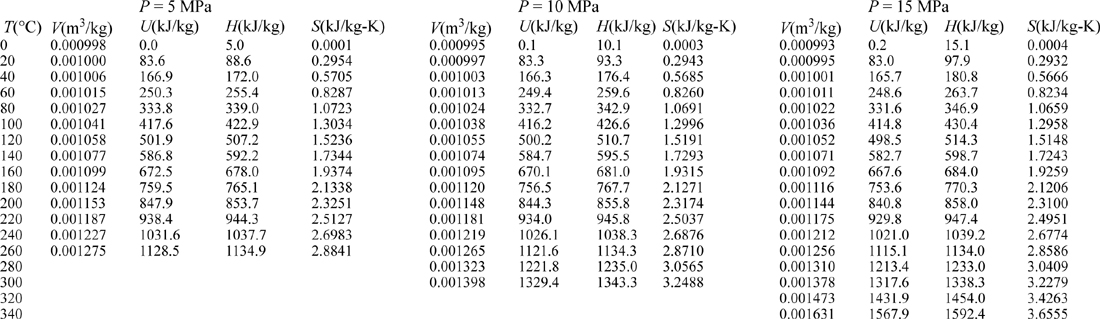
E.9. Properties of Water1
I. Saturation Temperature

III. Superheated Steam


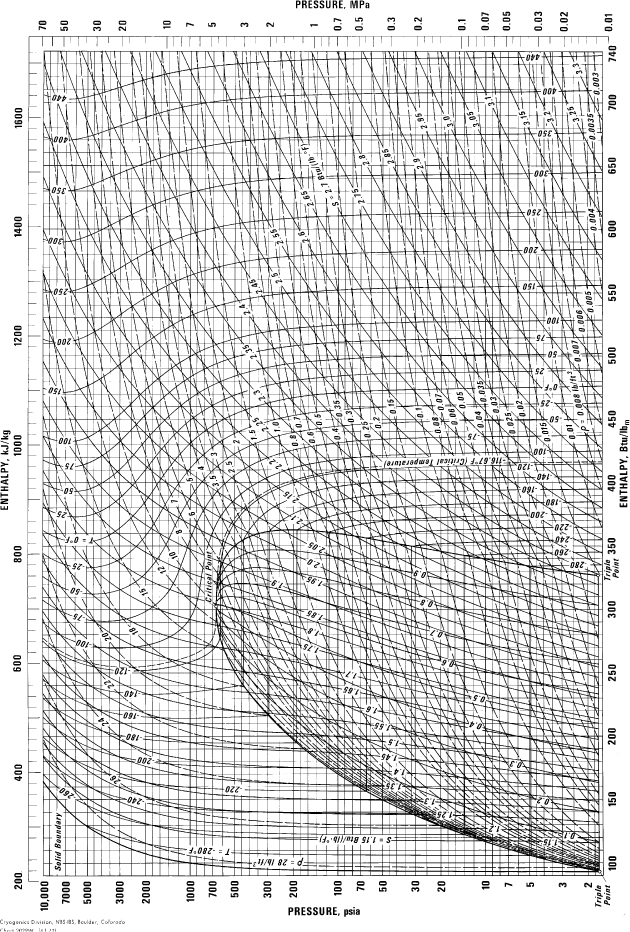
E.10. Pressure-Enthalpy Diagram for Methane
(Source: NIST, Thermophysics Division, Boulder, CO, USA, used with permission.)
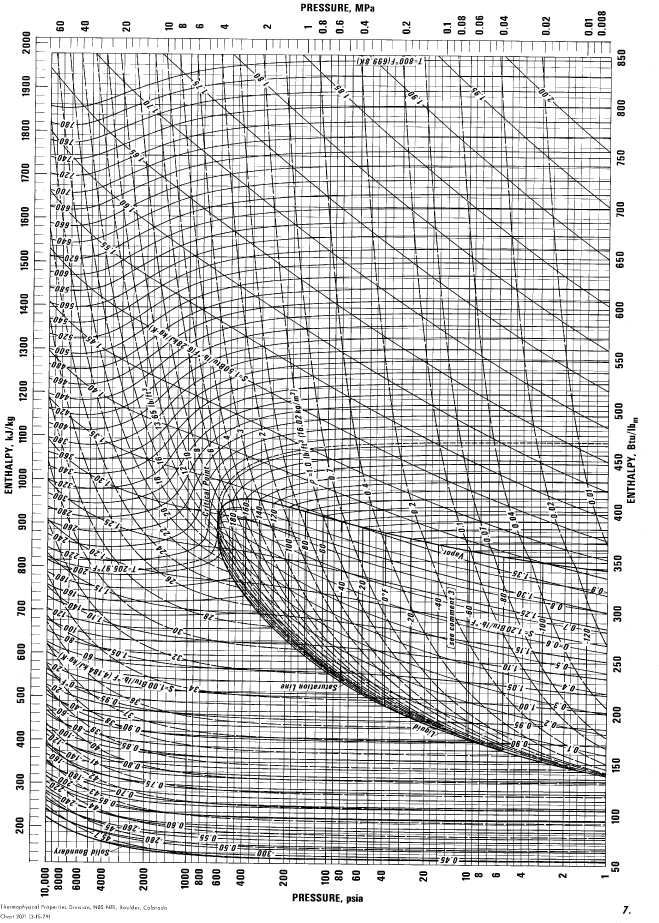
E.11. Pressure-Enthalpy Diagram for Propane
(Source: NIST, Thermophysics Division, Boulder, CO, USA, used with permission.)
E.12. Pressure-Enthalpy Diagram for R134a (1,1,1,2-Tetraflouroethane)
(Source: NIST, Thermophysics Division, Boulder, CO, USA, used with permission.)

Properties of Saturated HFC-134a.
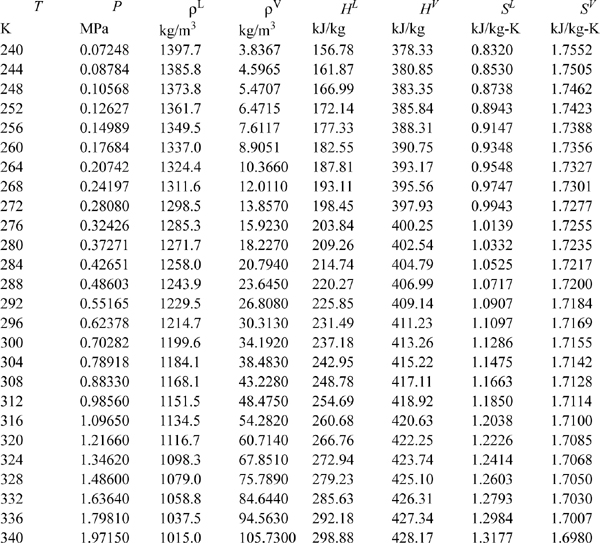
Abstracted from R. Tillner-Roth; H. D. Baehr, 1994. J. Phys. Chem. Ref. Data, 23:657.