
Meeting customer needs
6.1 The marketplace
This section takes a general look at the concept of marketing. It starts with explaining the role of marketing and aspects of supply and demand. The importance of a product’s life cycle is introduced. The section completes with examining the distribution routes available and aspects of promotion and selling.
Historically everyone lived in small communities where all demand was catered for by local personnel, who were often multi-skilled. As communities grew in size, some specialization occurred forming specific trades, such as cobblers and saddlers. Transport facilities severely limited the area able to be serviced by a single tradesman, except in the larger towns. Some small businesses started up employing a few people, but opportunities were limited as all work was manual.
As transport developed, so did trade but initially only in luxury goods which could not be easily supplied by local craftsmen. This luxury trade was mainly limited to the richer portion of society.
The industrial revolution made the mass production of certain goods an economic proposition, as long as the new transport system could economically and swiftly move the product from the factory to the customers. From this scenario, came the need for marketing to ensure that the customer and the goods being produced matched.
It still tended to be a seller’s market, but the spread of the industrial revolution soon introduced competition. Today that competition is truly worldwide with local products often competing against ones from half way round the world.
Marketing is no longer an optional choice – it has become a necessity for survival.
The role of marketing
The basic role of marketing is to match the resources of an organization to the needs and wants of its environment. To do this it must:
• Determine the internal factors which govern the total output of the organization, i.e. its ability to supply goods or services.
• Determine the external factors which influence the selection of goods, i.e. the demand.
Where there is a considerable mismatch between the internal resources, then management must bridge that gap. They do this either by changing the internal resources, or finding a market where the internal resources are useful.
The functions covered by marketing are:
• Forecasting future trends in market demand.
• Market research on their own present product and the competitions’.
• New product needs: To find needs which are not being met.
• Pricing strategy: To determine what price their products should be set at.
• Promotional strategy: What advertising and other promotions are required.
• Distribution channels: To ensure the product reaches all potential customers efficiently.
• Customer support: Support required prior to and after sales.
• Selling: The physical direct selling to the immediate customers.
Identifying the market
To survive an organization must first clearly identify its market:
Market classification
• Convenience good: Items bought every day, which the customers do not expect to shop around for, e.g. milk and bread should be available in any supermarket.
• Shopping good: Items for which a customer will look at what is available in several retail outlets, e.g. clothing and shoes.
• Speciality good: Items for which the customer expects speciality advice and for which they are prepared to travel to purchase, e.g. ski and professional level sports equipment.
Industrial goods:
• Raw materials: Basic raw materials which will be processed within the organization, e.g. steel bar and plate.
• Capital equipment: Items which are purchased for long-term use within the organization, e.g. machine tools, vehicles and computers.
• Components: Items which go into other products with minimum work being done on them, e.g. nuts and bolts and electronic components such as resistors. These could be sub-assemblies such as radiators for cars.
• Supplies: Items which are used by the organization, but are not incorporated into their products, e.g. electricity, paper, overalls.
These markets differ in how they operate and the trade cycles they experience. In the industrial goods markets, suppliers are completely dependent on other organizations’ success in buying and selling their products.
Determinants of demand
• Population: Groupings by age, number in households, etc. and trends therein.
• Population location, e.g. are they scattered or grouped in one location.
• Net disposable income after tax and basic living expenses.
• Socio-economic groups, e.g. high earners, unemployed, etc.
Psychological factors:
• Motivation: Why people buy particular items.
• Perception: What people see in product benefits.
• Beliefs and attitudes: What people think about certain factors, e.g. organic production. These do not necessarily reflect reality.
• Personality, e.g. attitude to credit, new technology, etc.
• Reference groups: How certain groups are influenced by what a few icons do, or wear.
Market segments can be forming and reforming continually.
Supply and demand
It is a common economic statement that price is a function of supply and demand and it does to a greater or lesser extent.
• When prices are high, producers are encouraged to start producing as opportunities for profits appear.
• When prices are low, many producers find they cannot make a profit and withdraw from producing.
The converse also applies – when there is a shortage, prices rise until the extra profit to be gained entices others into supplying. This balances out the demand and prices then fall again.
There are other factors which can affect supply and demand apart from price.
Factors changing supply relate to their impact on organizations’ decisions relating to costs and profits:
• Weather, natural disasters and civil disruptions: This could be small disruptions due to snow and localized strikes. It can also be due to factors such as flooding and earthquakes.
• Technology: Here we are not only looking at what is available, but the take-up of the technology by both suppliers and customers.
• Taxation and subsidies: Here we mean the impact of these on the decisions of organizations.
• Changes in costs of factors of production: Governmental decisions can impact here, but there are also general movements in the marketplace.
Factors changing demand for particular products (include items such as the net disposable income of individual consumers after paying taxes and covering their basic needs such as housing):
• Weather: Not only are there annual cycles, but many organizations find sales differ considerably depending on the weather. The food industry is particularly affected and this has led to major supermarket groups closing following the long range weather forecasts.
• Prices of other products: This can cause changes in buying patterns – an example would be a steep rise in petrol prices. This would reduce money available to purchase other items such as meals out -it may also cause a switch to public transport (or so the government hopes).
• Fashion: As well as the normal fashion cycles there are other fad products which suddenly arise, and almost as quickly fade away. An example is merchandise attached to movies.
• Credit availability: Loosening or tightening credit terms can impact on decisions on major purchases such as houses and cars.
• Advertising and promotion: Although they say that at least half of the money spent in advertising is wasted, it is recognized that a successful campaign can have significant effect on sales. An example is the Gold Blend series of adverts which is reputed to have increased the sales of this product by 30%.
• Population changes: Although these tend to be slow moving, nevertheless they can impact on profitability of certain niches. An example is the longer life attainment of the population leading to an increase in grandparents spending on children’s items.
• Confidence about the future: Perhaps a key decision as this will determine if a person saves against the future, or spends as they earn – and perhaps beyond that by using credit.
Some products show different elasticity in their price:demand ratios.
Product life cycle
Every product has a selling life cycle as shown in Figure 6.1.1. This is very similar to the human life cycle:
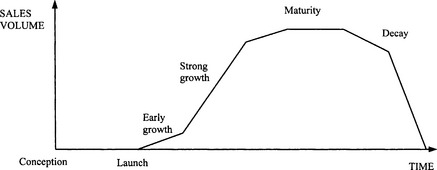
• Conception: The basic idea for a product is conceived. This may be after careful consideration of many factors, or can come as a flash of inspiration. Many ideas come to nothing at this stage.
• Pregnancy: After conception, the product idea must be developed within the organization to become fully fledged through a process of design, research and development. Most product ideas die at this stage.
• Birth: The launch of a new product. Many products fail to have a successful launch.
• Infancy: Growth of sales. During this period there will be a lot of changes and uncertainties.
• Maturity: The product sales have reached a plateau. This may go on for years, e.g. Mars bars – or may be for a short period only, e.g. computers and fashion clothing.
• Old age and decline: Sales start to slow down and decline.
• Death: The product stops selling. Continued support for the product in the form of spare parts may still have to continue. It is not unusual to have a demand for spare parts for over ten years after a white goods item, e.g. a washing machine, has stopped being made.
The main problem with the product life cycle, is that it is difficult to predict what is going to happen in the future. Most product ideas die during the design phase, many fail to break out of the early growth period, whilst others appear to be in a state of maturity for decades.
It may be possible to extend the product life by redesigning it periodically. This can give rise to a surge and extension in the product life cycle as shown in Figure 6.1.2. The car market is a prime example of this with the updating of a named model range after two to three years. It may be fifteen years before bringing out a completely new name model.

It is important that an organization maintains a steady supply of new products at various stages of their life cycles to maintain an even cash flow into the organization as in Figure 6.1.3. Many companies rely heavily on sales from products which have been introduced or redesigned within the last five years.

Many products are experiencing shortening life cycles. At the same time, products are becoming more complex and sophisticated. The complexity tends to increase development time. Figure 6.1.4 shows this conflicting requirement.

Figure 6.1.4 Comparison between product life spans and product development time due to complexity in products
It was once possible to change products into a different part of the market as their sales declined in one region. With worldwide competition this is no longer possible. It is therefore important that several things happen:
• Design cycles are managed to produce new designs in a short time period.
• Launch dates are firmly met.
• Opportunity is taken to maximize sales when at maturity.
• The manufacturing facilities are flexible in product and quantity.
The historic sequence of serial design could no longer be applied because the increased complexity led to jumps in communication channels. The method of organizing the design process had to change from a series set of stages into one where all aspects were being consider concurrently (see Figure 6.1.5).

It is estimated that a late product launch has more affect on profitability than cost overruns of the design stage, or even in extra costs in producing the product itself. An estimation of these effects is shown in Figure 6.1.6.
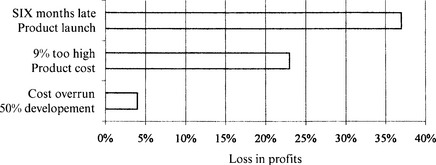
The reason for the lateness of a product having such an effect on profits is that late products capture a smaller share of the available market. If an organization comes late into a market it finds the competition have established their products and they will therefore gain fewer customers. The product sales will therefore have a smaller enclosed area.
The types of new products are:
• Replacement: For existing own, or competitors’, product.
• Extension: To the existing range of products.
• New: Products outside the present range in the present market, or for sale in a new market.
Ansoff’s matrix, as in Figure 6.1.7, shows the different type of combinations of products and markets.

Figure 6.1.7 Dimensions of the geographic growth vector. (From New Corporate Strategy, Igor Ansoff (1988) (John Wiley and Sons))
In order of increasing risk, i.e. departing from what you know and are good at, the strategies are:

• Market penetration: This means to sell more to existing potential buyers. This can only be gained from competition. An example is Ford attempting to increase sales of its product range of cars.
• Product development: Launching new products to sell within the same market. An example could be Ford introducing the Ka car. The problem here is that the new product may appeal to some existing customers and they buy the new product rather than an existing one. It is hoped that the gain of new customers outweighs the customers who simply switch to a different product from the same supplier.
• Market development: This means to find a new market altogether. Perhaps an example would be Ford’s decision to start selling their cars in Russia after the collapse of the USSR. The problem here is that you will be competing with organizations who will have considerable experience in the market and you have to learn about the new market’s particular characteristics. You will also have to set up a selling, and perhaps production, facility and cope with new languages, laws and customs.
• Diversification: There are different types of diversification:
– Forward towards the customer. An example would be if Ford decided to start up a chain of wholly owned car dealers. The problem then is that the organization takes on additional risks and costs which have to be matched to increased profits.
– Backwards along the supply chain. An example would be Ford deciding to go into the manufacture of windscreen glass. The problem here is that the internal supply has to be limited to selling only to its parent as competitors will be wary of dealing with them.
– Complete diversification. An example would be Ford deciding it was going to manufacture and sell cakes and similar confectionery.
The organization should build on its strengths, bearing in mind the customer’s needs. Most departures from the present products and customers involve the organization having to take on new tasks, buy new equipment and learn new skills. This takes time and money – even if bought in.
Risks with new products
Although new products are important to an organization’s future, not every product launch will lead to success. As an organization has invested considerable money, effort and emotion in bringing a new product to the market, it is worth listing some of the areas where launches fail:
Sales may not be achieved due to:
• Competitors’ actions – an earlier launch or a better product.
Design shortcomings:
Manufacturing shortcomings:
• Unreliable components purchased.
• Problems with new technology.
• Processing quality problems.
• Initial teething problems leading to late launch, or insufficient output to meet demand.
Servicing shortcomings:
Because of the importance of a new product, it is important to get the package right as early as possible in the design cycle as it becomes very expensive to modify the design at a later date as shown in Figure 6.1.8.

Distribution channels
In every market there are channels for products to move through between raw materials and the end user. These channels are important to minimize their effect on the organization, and maximize the organization’s use of them. Figure 6.1.9 demonstrates the channels available for electrical components used in telephones.

The distribution channels perform certain functions:
• Transfer of title of ownership.
• Physical movement of the goods.
Each organization can decide the degree of control it has over points within the distribution chain:
• Direct ownership: Has the advantage of having full control over the total marketing effort. The disadvantage is that all risks and costs have to be borne by the organization – and all customer contact has to be made.
• Independent intermediates: Has the disadvantage of not having control over the selling effort. It does minimize the cost, effort and risks involved – especially in reaching a large customer base.
Figure 6.1.9 is limited to dealing within a geographic area. In fact the electronic industry is very much a worldwide market in supply at all stages in the distribution chain. This adds a distance, language and cultural aspect into the decision of direct ownership or dealing through intermediates.
In addition there is considerable pressure to reduce the goods stocked in the supply chain and this leads to considerable pressure on production facilities to be highly flexible in being able to produce a range of different products in a very short lead time. Many supermarkets have highly sophisticated computer systems to collect information at the sales point and use this to control their inventory and ordering system.
Promoting and selling
The different market segments require differing techniques of communication and personal selling to get a customer to purchase a particular product. The stages that a customer goes through and the associated promotional method are:
• Awareness: The customer becomes aware of the products on sale.
• Comprehension: The customer begins to differentiate between the various competing products.
• Conviction: The customer begins to move towards purchasing a particular product.
It is important that customers complete the route for your product -especially if they already are a customer and have already gone through the process. It is estimated that it costs ten times as much to gain a new customer as to retain an existing one.
Industrial and consumer goods do have differing proportions. Personal selling tends to be more important in industrial selling between organizations.
Typical communication media are (some can be more directed towards particular potential customers):
In addition there is the mass media, which is more useful for a broadcast approach.
Each of these has advantages in reaching particular customers, but remember they are individuals with home lives as well as their organizational roles. Reaching them in an out of the organization circumstance may make a greater impact than it would in the organizational setting.
We are not covering the art of advertising in this text, but it is worthwhile examining the above range of media and communication methods to see what they carry in the way of advertisements.
Selling skills
As it is only when a sale is made that the company will obtain an income, we shall therefore briefly look at this process in an organization-to-organization context rather than retailing to broad numbers of customers.
This is particularly important because a small number of successes here can sell a large number of products. The stages to go through are:
Preparation. It is important to ensure that you are prepared for the meeting. This means you have to carefully carry out the following phases:Research:
• Is this a new prospect or an existing (past) customer?
• Who is the person to be seen – name, title and function?
• How was the call arranged – i.e. cold from your organization, or by invite from the potential customer?
• The company and the industry.
• All the purchase influencers in the organization.
• The competitions’ offerings.
• Possible immediate customer needs and future plans.
Preparing for the meeting:
• Dress to match customer expectations – not too formal, or informal. One style does not cover all.
• Have all resources available that you may need – paperwork, price list, technical brochures, etc.
• Ensure up-to-date product knowledge.
• Sales aids which may be needed.
Opening the call. This is important as first impressions do count in any interview situation. A bad start is difficult to recover from:
• Remember from the customer point of view that they are important, therefore consider their needs.
• Orient the discussion to the customer.
• Make a proper greeting, e.g. an interest creating comment; your reason for calling; an opening question.
Agreeing the customer’s needs:
• Background questions, not directly related, to establish connection.
• Problem question, e.g. what problems are you experiencing with present supply?
• By implication, e.g. do you feel that you are achieving the best price?
Statement techniques:
• Rephrasing of questions that have not been answered.
• Agreeing needs once established.
• Present dissatisfactions in the supply side.
• Create dissatisfaction with competitors’ offerings.
Establishing priorities. Normally customer has many, often conflicting priorities. Try to establish what his priorities and working range are on factors such as the following. This may give indications where a tradeoff is possible, e.g. higher price for a guaranteed delivery schedule:
Presenting your case:
• Clear and unambiguous statements and offers.
• Visual aids to highlight important aspects of your case.
Making ideas attractive:
• Stress benefits to your customer, not just the product features.
• Select benefits appropriate to each person’s role in making the decision on who to buy from:
Making ideas convincing by:
Ensure you involve the buyer by obtaining and giving feedback.
Techniques for handling objections:
• Anticipate possible objections and prepare the case against them beforehand.
• Listen to exactly what is being said and how it is said.
• Pause and think before replying.
• Acknowledge remarks made in your reply.
Different types of objections can be raised such as:
• Price – establish value definition and boundary conditions.
• Fear of unacceptable disadvantage.
• Habit, i.e. present supplier.
• Conflict with existing systems.
• Previous complaints against suppliers in general, or more seriously your organization.
Closing is the most important part of any sales meeting:
Obtain customer commitment to at least one of the following:
• A specific order, even if only for a trial.
• Further meeting to hold open possibility of supplying.
It is important to stop selling once your customer decides to buy. Further effort will not only be superfluous, but may appear to be overselling to the customer. Recognizing buying signals such as:
Reassure the customer at the end of the meeting by:
Problems 6.1.1
(1) What factors will affect the demand for prints of paintings by a particular artist?
(2) Can you name five products which normally have a selling life cycle of less than one year?
(3) You make hand pottery items, what are the risks attached to deciding to start mass production of similar items?
(4) If you had a hobby of making model ships, identify the possible distribution chain you would enter if you decided to make a business out of it.
(5) If you developed a new process for attaching electronic components to a board, who would you attempt to see in a company making mobile phones.
6.2 Forecasting the future
The ability to foretell what the future holds may be impossible but in business it must be attempted to form the basis for rational decisions which need to be made now. Because of the lead times in design and manufacture you cannot wait until something actually happens before taking action – this will often be too late. This section looks at the reason for forecasting and the techniques available.
Need for a forecast
Forecasting is the starting point for:
• Capacity requirements: Determining what factories you will operate and the mix of labour, machinery and equipment inside them.
• Production planning: Deciding on how much of each product you will make and the dates to produce it.
• Raw material: Deciding on what to purchase – the quantity and timing of this.
• Personnel: Deciding how many people are needed, and their skills and training requirements.
• Budgeting: Determining the cash budget requirements and whether sufficient profit will be made.
• Technology: Determining the changes in the process and the products which will be affected by changes in technology.
• Marketing campaigns: The best time to launch a new product so that it naturally replaces an existing one.
If you make a pessimistic forecast, i.e. you set out to make less than you can eventually sell, then you will have stockouts and irritate your customers – perhaps even to the extent that they will go to your competitor. You may have to react by the expensive use of overtime or sub-contracting to meet customer demand.
If you are overoptimistic, it can also be expensive. You can have high inventories and underused equipment. With high inventories you tie up money and carry the risk of obsolescence, or delaying new designs to use up these inventories.
The main problem with a forecast is that it will never be exactly accurate. There are too many factors which are outside the control of an organization, or even a government. What industry requires is a fairly accurate forecast – which means a probable range rather than a single figure with an indication of the risk attached to it.
Time horizons in forecasting
Each type of industry has different time horizons due to their nature. The chemical and other basic industries, because of their high capital requirement and slowly changing products, tend to think in the relatively long term. Industries such as newspapers tend to think in relatively short terms.
Short Range. One week to three months:
• Purchasing material: Placing, or confirming final details of components and quantities.
• Job scheduling: Determining the final production schedule of what will be made when.
• Working pattern: Short-term alterations to working hours such as overtime working.
• Job assignments: Allocating actual named people to particular tasks.
• Cash flow: Ensuring money is available as required.
• Customer servicing: Arranging the schedule of service personnel’s visits.
Medium range. Three months up to one year:
• Sales planning: Detail of visits to be made, and targets to be achieved.
• Production plan: Semi-finished plan of what products will be produced.
• Procurement: Many items have a delivery lead time that requires orders to be placed several weeks before desired delivery.
• Shift pattern: Finalize working pattern of individuals and equipment.
• Personnel level: Finalizing recruitment and redundancy plans.
• Training: Finalizing training schedules of courses and match of personnel.
Long range. One to five years:
• Strategic plan: To cover whole business.
• Capital investment: Allocating capital spending in conjunction with strategic plan.
• Capacity plan: Make any forward arrangements to open up or close plant including forward arrangement for personnel and equipment placement.
• New products: Determine the product development which will be concentrated on.
• R&D expenditure: Determine the lines of enquiry to be followed to develop new products and processes.
• Facility location: Decide on the opening up or closing down of retail outlets, warehouses and offices.
• New markets: Determine what new product or geographic areas the organization wishes to investigate.
The longer the time horizon involved the greater the risk of a forecast being significantly wrong. When factors such as competition and technology enter the picture this increases the risk involved.
Therefore when considering the medium- and long-term picture, an organization has to take into account what governments may do (in, for example, inflation or unemployment policies); demographic changes in population concentration and age dispersion; general education levels; special grants; etc.
Basis of forecasts
Forecasts tend to be made up from a variety of sources both internal to an organization and external. Some of this will be hard data such as previous sales, other soft data such as an opinion.
Management goals
The aspiration of the top management is often the initial starting point as this decides the length of time being considered in paying back investment of time or money.
Sales force
The sales people should be in touch with the customers and see directly the impact of the competition and contribute substantially to any forecast.
Where the sales cover a large area, or several countries each sales point should initially make forecasts of how the market is growing/shrinking, the changes expected in market share, the changes in technical specifications desired, competitors’ offerings and tactics, etc.
Area forecasts can be consolidated into a regional one, then an overall forecast. It is usual on an international scale to find distinct differences between customer demand on products in different locations.
At the same time the organization may be a newcomer into some market areas and much of this information has to be especially gathered. Where they are established, the present sales force should be a good source.
Leading indicators
There are often indicators available locally or nationally which can give some guidance to the overall direction of the economy within a country:
• Changes in inventories levels. These can indicate when the market is slowing down (increase in inventories) or quickening up (reduction in inventories).
• New manufacturing orders: An increase or reduction in these can be especially important to organizations supplying capital equipment such as machines.
• Changes in employment levels: An early indicator here can be changes in the number of jobs advertised. This is of special interest to organizations supplying luxury or shopping goods as it can indicate a possible general trend towards particular products.
• New plant and equipment orders: These indicate how confident industries are in their future trading prospects.
• New buildings started: Of interest to organizations in the white goods or furnishing markets.
• Demand for money: The availability of credit is useful in shopping and luxury goods markets, e.g. cars.
• New government contracts: Those organizations supplying capital goods and in civil engineering are interested in these.
• Elections or government changes: Each party has particular areas they prefer to target, or to diminish, spending on. There may be a rise in spending when an election is about to take place – and perhaps a cut-back afterwards.
Therefore it is possible to come to a reasonable forecast without analysing past sales figures, but often the past does give an indication about the future, especially in seasonal changes in demand.
Forecasting techniques
There are many mathematical forecasting techniques in use within industry. The main problem is that no technique will produce a guaranteed accurate figure and all must be treated with an attitude of partial disbelief. There are too many factors outside the direct control of an organization that can affect both the total market movement and the organization’s share of that market. Therefore any technique used must be modified by a good knowledge of the market itself.
Time series patterns
In addition to market fluctuations, there are normally five components of demand (see Figure 6.2.1). There can be several of these in action at the same time.

• Random: Unfortunately in any set of data there are normal variations. Some of these have undefined causes and these are impossible to predict. Even those with identifiable causes are difficult to predict as the causes themselves require predicting as well as their effect.
• Trend: A straight or curved line showing an increase or decrease over time. Normally only reliable for a limited period and may vary.
• Curved, e.g. the product life cycle.
• Short-term cycles: Often seasonal but can be over a day, e.g. traffic density, a week or a year. Can be associated with a single annual event, e.g. Christmas.
• Long-term cycles: Over the longer term there appears to be natural business cycles. The exact prediction of these is extremely difficult.
It is these components that make accurate forecasting unlikely – therefore a range of figures should always be given instead of a single number. All quantitative methods rely on a historic database – but remember, history does not always repeat itself!
Quantitative methods
In order to test the quantitative methods, we try them out on past data, i.e. as if they were being used on that data. They are run as if the old data was new, i.e. the future values cannot be seen.
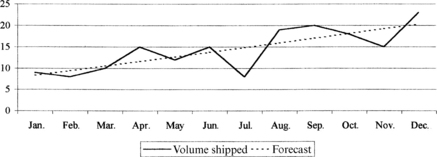
Figure 6.2.2 shows a graph of the historic demand pattern. On first looking at the graph, there appears to be an upwards trend but there is also considerable variation from period to period. The variation may be random, or due to definable causes such as a new product slowing gaining acceptance, seasonal factors, supply problems or competitors’ actions.

Where there are definable causes then they must be allowed for. It may be, for example, that period 7 was an annual holiday shutdown that resulted in less product being available.
In this particular example, we will assume there are only random variations and make no other assumptions regarding any of the other possible causes, except to say there were no supply problems.
There are a number of error analysis techniques available which we can use to judge the effectiveness of a forecasting technique. Only the BIAS and MAD (mean average deviation) figures are calculated and shown here.
• The BIAS gives an indication of whether the forecast is on average too high (positive) or too low (negative). It can be used to adjust the forecasting process.
• The MAD value gives an indication of the overall accuracy of the forecasts – it is the average error. It can be used to give a probable range to a forecast.
To calculate the BIAS, take the actual sales as the base. Find the error between the forecast and the actual sale, i.e. include the plus and minus sign. Now add up these values and find the average. If the answer is positive the forecast is, on average, too high – if the answer is negative, the forecast is too low.
To calculate the MAD, repeat the process as for the BIAS – but this time take the absolute value of the error, i.e. ignore the sign. The average figure signifies the expected error in a forecast – it can be used to give a range from a central prediction. Note it is an average and therefore 50% of errors can be larger than this. To ensure that all errors are within this may give an extremely large range.
An organization has to find a method of controlling large sales variations, or a method of coping with them – e.g. carrying inventories.
Simple forecasting method
The first method, one can say, is an educated guess.
It consists of examining the immediately past data to guestimate (a hybrid word made up of joining guessing and estimating) the future demand. A graph of historic data, such as that shown in Figure 6.2.2, can give a good guide to what will happen in the future – but only if the future is similar to the past. Any known factors that may cause changes should be taken into account.
Table 6.2.1 shows a series of simple forecasts made and the corresponding actual sales made. Figure 6.2.3 shows the graph of these forecasts against actual sales.


As can be seen in the graph in Figure 6.2.3, this method does tend to err some, especially in reaction to sudden changes in demand, but can give a reasonable forecast. It produces BIAS of −1.73 and a MAD of 3.91 respectively that are reasonable in comparison to some of the other forecasting methods, as we shall see later.
Linear trend
It is often worthwhile to develop the linear regression of the historic demand, to give a guide to a trend. This can then be projected forward to give the forecast demand. The basic regression formula is the formula for a straight line:
where
Fx = the trend forecast of demand Y for period number X
a = the estimated inception on the y-axis
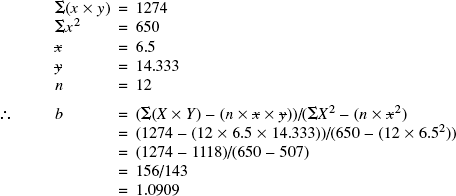
The equations used to determine a and b are:

where
| Σ(x × y) | = | sum over all periods of X times Y for each period |
| Σx2 | = | sum of the X value squared for each period |
| x | = | the average of the X values |
| y | = | the average of the Y values |
| n | = | number of periods of data used |
In this particular case, looking at Table 6.2.2 where we have calculated out the values we have:
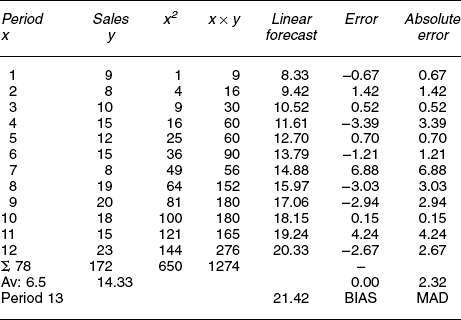
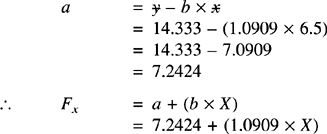
If we substitute for any period number for X in this equation, we find the resultant forecast. For example, if we want the forecast for period 6, the answer is:
Table 6.2.2 shows in a column the forecasts made using this projection. The table also shows the errors from the actual demand against each forecast. On the error analysis, the BIAS shows up as zero as the trend is calculated from this actual data. The MAD analysis shows that the average individual error is 2.32 against the average volume shipped of 14.333 equal to +/−16%, which appears quite large, but is not unusual where significant random variations in demand are present.
The graph in Figure 6.2.4 shows these forecasts against the actual. It includes a range based on the MAD projected from the single figure forecast to give an average error range. As can be seen, some of the actual sales values fall outside this projected error range. This is because the MAD represents an average error hence some must be larger than it – to include for all possible errors would mean the application of a much wider range.
There are more complex mathematical methods such as multiregression analysis which can be used, but these are not covered in this textbook.
Moving average
One could use a simple average of all the past data to estimate the future demand. If the market changes over time, as all do, this method could be highly inaccurate.
If instead of taking all past data, the average of only the immediate past was used to project the future then it should be more accurate.
We calculate this ‘moving’ average by:
where
Table 6.2.3 shows the values calculated when producing a three-period moving average. For example, the forecast for period 5 is reached by:

As can be seen in Table 6.2.3, using this method, the BIAS = −1.81 and the MAD = 5.96. Figure 6.2.5 shows a graph comparing this forecast against the actual sales. This shows that, on average, the forecast is low (by 12%) with a large average error of +/−40%.


The use of past data averaging will have a BIAS where there is a trend (positive or negative). Using weighted moving averages can reduce the BIAS because later values have a higher relative value.
Exponential smoothing
We can produce a forecast based on past data giving preference towards either the latest data, or even that from earlier periods by using weighed average methods. The problem remains that in any moving average method any data before the period used in the calculation is ignored.
Another technique called exponential smoothing considers all past data, and modifies its forecast based on how close the forecast was to the latest actual figures. We can decide what is more important – total history or recent history by adjusting the value of a smoothing constant, α, in the formula:
The higher values of α give a forecast that reacts much in line with the latest demand. Lower values of α give more preference to the previous forecasts, i.e. a longer historical period. The result of this is that the higher values of α tend to be more effective in following trends but it does not produce a smooth forecast. For a smooth forecast you require a low value of α.
Forecasts for period 5 in Table 6.2.4, for the differing values of α used, are:
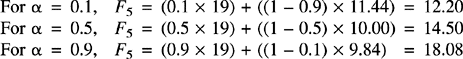
If we examine the graph in Figure 6.2.6, we can see:


• α = 0.1 gives a very smooth forecast, but it is not following the trend of the demand well, i.e. it is lagging the trend.
• α = 0.9, there is a good correlation to the trend but the forecast is almost the same as the previous period’s actual demand and hence is fluctuating almost as much as the actual demand, but one period behind.
• α = 0.5 demonstrates in between results from the low and high values of α.
A low value of α is useful to smooth out fluctuations, but should only be used where there is little trend, as it quickly lags behind the trend.
Note from Table 6.2.4 that α = 0.1 gives a BIAS of −4.89 and a MAD of 5.37 against a BIAS of −1.57 and MAD of 4.41 for α = 0.9. The lower α value gives a smoothing out of the high fluctuation of the actual demand but produces the higher BIAS and MAD because the forecast is lagging behind the actual trend. The best overall value for MAD comes when α = 0.5.
Comparison of forecasts for period 13
Table 6.2.5 brings together the end result of all the methods, including a forecast for period 13 and the BIAS and MAD values. Note that although each technique is a valid one, they produce answers from a low of 13.79 to a high of 22.23. They are graphed together in Figure 6.2.7.
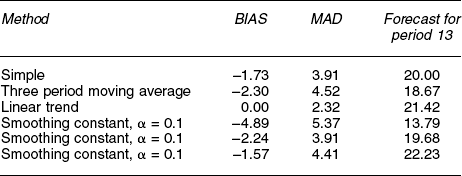

Which one gives the correct forecast?
The answer is that they are all mathematically correct but probably all inaccurate! For example, the figures for demand may represent a normal year’s figures and the actual for period 13 may be similar to period 1.
Only time and trial application of each can tell how useful any of the techniques would be.
Determining cyclic components and outside influences
As referred to in page 273, there are often cycles within any demand pattern. These can be over:
• The day, e.g. traffic volume.
• The week, e.g. food sales pattern.
• The month, e.g. spending on luxury items reduces as the month advances.
• Year, e.g. sales of electric fans peak in the hot summer.
• Particular events, e.g. Christmas, Guy Fawkes (fireworks), new car registration letters.
Where they have existed for a number of cycles, they need to be identified so that production schedules and inventory can be planned to service them. Table 6.2.6 shows the daily sales of a particular food item in a supermarket.

By adding up the sales on each of the days and calculating the percentage they are of the total sales for the four weeks, we can arrive at an expected daily factor that we can apply to any projected week’s sales. These factors are shown graphically in Figure 6.2.8.

In addition to a daily pattern, we could find other patterns and correlations for this item:
• One Monday sales were much less than the other three Mondays – this was put down to a Bank holiday – and this reduction could be built into any future forecast.
• There will probably be an annual pattern for the item as people’s eating preferences change over the year.
• There could be a correlation to an outside influence, e.g. ambient temperature, if a popular local football team is playing at home or away, perhaps even if that team wins or loses.
• There could also be a correlation to special offers for this product, or perhaps a negative reaction to a special offer on a similar product.
These all can be built into past data to provide a guide towards the future, but no matter how accurately the recording – all the influences probably have not been captured. The future will always be different, we just hope not too much is unpredictable.
Foretelling the far future
If it is difficult to forecast the immediate future, then how do we go about forecasting even further ahead? Some organizations, such as utilities, have to make decisions now, as the lead time of developing new plant is years.
This does not involve using crystal balls but assembling a group of acknowledged experts and recording their views on what changes are liable to take place, especially in the technology aspects. This can be by focus groups or using the Delphi Technique where each expert records separately their predictions and these are then discussed and put in order of probability.
• A full PEST analysis (see page 1) to extend present trends in the political, economic, sociocultural and technologies aspects into the future.
• A five-force analysis (see page 304) to determine foreseeable, or possible, changes in the competitive forces operating.
These long-term forecasts often act as the input to scenario analysis (see page 306).
Problems 6.2.1
(1) What happens if you use a value of α = 0 in an exponential smoothing forecast?
(2) What are the problems associated with a highly seasonal product such as fireworks in the UK?
(3) If in the example you have been following in this section the actual sales in period 13 were 10% higher than month 1, what would you use as forecasts for periods 14 to 24?
(4) How would you build the launch of a product revision into a forecast?
(5) If you are supplying the retail market with a range of similar products, what effect do you think a sales promotion on one item has on the remaining items in the range?
6.3 Marketing research
For an organization to make a decision relating to its market, it requires as much information as possible about what people want and how much they are prepared to pay for it. The aim of marketing research is to provide that information with as much accuracy as possible.
There are four main areas that marketing research is involved with:
• Product research: Concerned with the design and range of existing and possible products from the organization and its competitors.
• Customer research: Concerned with the buying pattern of potential customers and trends in their spending and changing criteria for selecting products. Can be consumer or industrial.
• Sales research: Investigations both into internal unit and competing units in sales outlets and sales patterns.
• Promotion research: Investigations into the effect of advertising and other promotional efforts.
Some of that information will be gained from just operating in a market from personnel such as salesmen. However, this is from a narrow base of experience and can be highly personalized and biased. It cannot possibly cover the whole potential range of customers, unless that is very small.
The research programme
There are many ways of gaining useful information from the marketplace. Some of these are:
Before deciding on which method to use, marketing research should go through a design sequence to ensure that the total research gives a reasonably valid answer. The phases are similar to that seen in Chapter 5 on project management.
Stage 1 – research brief
Initial discussions about the situation to be investigated need to be held to discuss the extent and limits of the project, especially the population involved, and the degree of accuracy required.
For example, initially it may be suggested to research into the reasons for selecting an intended higher education subject area amongst 16–18-year-olds. But that raises a number of questions, amongst which could be:
• Why do we want to know the answer?
• Is it nationwide (UK), limited to only certain geographical regions or even should it cover the EC?
• Should it cover all people in this age group, even though many of them do not have qualifications to enter higher education?
• Should it be limited to those qualified and intending to enter higher education?
• How broad should the subject categories be?
Once there appears to be agreement about the subject matter, we move onto:
Phase 2 – research proposal
Once this is accepted, we can move onto:
Phase 3 – data collection
The main part of the research. Careful records need to be kept of how data was actually collected, the responses received and any significant variations to plan.
Target of the research
Whatever research method is used there is a problem associated with it. How do we identify the group(s) which the survey has to cover.
Typical segmentation models used are:
UK National Readership Survey (NRS)
| A | Upper middle class | 3% of population |
| B | Middle class | 10% |
| C1 | Lower middle class | 24% |
| C2 | Skilled working class | 30% |
| D | Working class | 25% |
| E | Other | 8% |
ACORN Life Style Segmentation
Household composition: Single; couple; family; shared.
Age structure: Child; young adult; mature; established; retired.
Industry. In some ways easier than consumer as there tends to be a concentration of buyers, unless the target is the small businesses. First place to start is to quantify the actual group that we are interested in, e.g.:
Secondary data sources. These are non-obtrusive, i.e. do not require soliciting responses and are termed desk research.
• Internal data, e.g. sales records, complaints records.
• Government publications: Good guides here are Guide to Official Statistics (HMSO) and Regional Statistics (HMSO). Copies can normally be found within public libraries – the local librarians will tell you what detailed reports they hold in stock, or will arrange inter-library loans for many of them. UK government statistics include social trends, regional trends and family spending.
• Trade press: Again consult your local library or one of the particular industry bodies.
• Business Links and local chambers of commerce.
• Commercial data: there are many subscription services such as Mintel Market Intelligence Reports and Financial Times Business Information Services.
• On-line services: Teletext (Ceefax and Oracle), Viewdata and many of the internet providers. Many of these are subscriber services.
• Libraries: In addition to official and commercial information sources, they are often a contact point for local interest groups and clubs.
Using these sources, a picture can be built up of potential customers, or users, who it may be of interest to carry out a survey on. These sources are initially identified at the research proposal stage, but a more detailed picture is required before we finalize the design of the data gathering phase.
In the industrial market, it is important that we follow the distribution chain to identify all possible uses and potential buyers. Following such a chain will produce a list of contacts and their positions within all the organizations.
Sampling plan
Once we have the target group, we now have to decide how to collect the data and how much we need. The main constraint on any research is cost. The aim is to collect as much meaningful data as possible within that constraint.
Ideally we would like to solicit information from everyone who may be involved. The cost of doing so would be prohibitive, except in very narrow markets. This forces us into sampling rather than full coverage.
The basics of sampling are that if a representative group (see Figure 6.3.1) is taken and examined then any statistic of the sample group will be reflected in the total population. The mathematics of sampling is not covered here – just a few words about sampling itself:

• Who is to be surveyed: A clear picture is required of all the different groups that require to be surveyed.
• Sample size: Basically, the larger the better to improve the probability that their response will echo the population we are interested in. Unfortunately accuracy does not follow a straight linear correlation, but depends on the square of the number involved, i.e. to double accuracy, we require four times as much coverage. Note that the larger the survey, the more it will cost to carry out and analyse.
• Sampling procedure – how to choose the respondent: Here one must make sure that a truly representative cross-section of potential customers and decision makers is reachable and is actually covered during the survey. Otherwise we could have a misleading bias in the answers.
• Contact method: Linked to the necessity to reach the respondents. Methods include:
– Telephone: Does access most of the population, but not all, e.g. ex-directory at one end and poorer households at the other. Times of availability of different consumers can be problematic, i.e. many family members will be out during normal working hours.
– Postal: Will reach a good spread, but heavily reliant on recipients responding. In many surveys a 10% response is considered good. However, this self-selecting group may not be representative of the whole population.
– Interviewing: Expensive method, but does allow more information to be collected. Has problems in reaching balanced audience and in the questioner influencing the answers by body language.
In addition to surveys, we may wish a more detailed response, although the actual sample used will be smaller to prevent excessive cost. This is achieved by:
• Observational research: This is non-obtrusive and involves recording reactions such as stopping to look at displays and resultant action, e.g. enter shop – make a purchase. Can be expended into analysing facial responses.
• Focus groups: Here one selects a small group of intended target and conducts detailed enquiry, e.g. taste panels are used by most food groups as a test/intermittent activity during product development.
• Test marketing: Here the product, or service is offered in a limited geographic area to test response to the product, or advertising campaign. This gives an opportunity to alter the offering before a nationwide launch.
Each method has problems ensuring responses, and a post analysis is required to ensure spread of respondents matches the initial target.
The questioning technique
This is the key skill area in any marketing research and therefore potentially the most error prone. Care has to be taken that questions are not leading, especially in a sequence which may guide participants towards particular answers.
We have to decide what information we want and the best way to structure interviews to get it:
• Facts and knowledge, i.e. about particular products or services.
• Opinions: Attitudes towards products and services – may also require depth of feeling.
• Motives: What makes people do things.
To collect the information, there is a variety of ways we can frame questions:
• Closed-end: Very quick to collect and analyse, but forces a direct choice, which may not reflect reality.
– Two choice: These are typically of the yes/no type. May be agree/disagree. Need to collect number of non-responders, i.e. ‘don’t know’.
– Multi-answer choice: Here a choice is given of several probable answers as in Figure 6.3.2. Can be single or multiple choice. Need to leave room for ‘others’ and don’t knows.

– Scales: Here responder has to quantify answer as in Figure 6.3.3:

• Open-end: Here the actual words used by responder to a question or stimulus are recorded. Ways of framing question/answer can be:
– Unstructured answer: Normal invite is by use of the word ‘why?’ as in Figure 6.3.4.

– Word association: Immediate answer to a word – normally a trade name or similar.
– Sentence, story and picture completion can be used to give stimulus to open up inner feelings.
Note open-ended type questions can be severely influenced by the questioner leading. They also need much more careful analysis.
Several problems in collecting data are:
• Bias in question, e.g. ‘You don’t think … do you?’
• Questions too long, e.g. asked to select several from a list of twenty items.
• Wording of question may be unclear, or can be interpreted in different ways.
• Response is based on what responder thinks is the ‘correct’ one.
• Responders may, on reflection, not carry out stated intentions.
Using the results
The answers from a market research project can be used to:
• Determine the potential market for a new product at different selling prices.
• Form a competitive picture of a product against its main competitors.
• Identify and rank customer needs/wants for a new design specification, i.e. first stage of QFD (quality function deployment).
There have been notable occasions where a market research has apparently been correctly carried out and acted on – with disastrous consequences. The most recent famous failure was that of the ‘new coke’ recipe by the Coca-Cola Company.
Indications were that its launch would be successful which persuaded the company to make a complete changeover from its previous recipe. Instead it cost Coca-Cola substantial market share which was only addressed by bringing back the traditional recipe.
Product image
By making a profile of the customers’ responses against selected attributes or images associated with a product, we can see a product profile as in Figure 6.3.5. This enables a company to see the overall image of its product and gives areas for possible improvement or to stress in advertising as we can build on existing images.

Product attribute correlation
These matrices can be used to form a series of cross-correlation between attributes of a product, and its competition, against stated customer desires. For a sports car, the competing desires could be:
It is not unusual to find that different market segments will not only put different desired values to these attributes, but they will also score models differently. Being able to differentiate what the different segments value and how they score can guide targeted advertising campaigns in what is portrayed and where different messages should be published.
In the next section (6.4), we shall examine an overall company profile where comparison on a range of supporting attributes is made. Marketing research is the basis for this.
The customer matrix
It is possible to amalgamate all the attributes when measured into a particular segments customer’s perceived use value and then compare this with the customers’ perception of the product’s price to determine an overall competitiveness.
• Identify all the attributes that the customers value.
• Assess the importance of each attribute to the customers – i.e. score them to give a value weighting.
• Rate each competitor and own products by customer.
• Amalgamate the attribute scores into a perceived use value for that product’s attribute, i.e. multiply the attribute rating for a product by that attribute’s customer value weighting.
• Average out the different attribute values into an overall customer perceived value (PV) for each product.
• Determine the customer perceived price (PP). This may not reflect actual price differences as the customer may have only an initial price in mind but an amalgamation of life costs.
• Graph each product onto the matrix as in Figure 6.3.6.

• Analyse the matrix as Table 6.3.1.

We should find a reasonable correlation between the perceived value and the perceived price across the range of products.
Where a product appears to be highly competitive these perceptions must be maintained. Conversely if a product is seen not to be competitive, then action for improvement must be made, or perhaps a withdrawal from the market.
If the matrix indicates that the product is in line with the market then by concentrating on improving the attributes that the customer values, we should be able to drive up the customers’ perceived value. This will increase the sales, or allow us to set higher prices without affecting sales.
It is more difficult to alter the customers’ perception of the price, except by changing it. The basic question is how much of a change in price is required to change an impression of being highly priced. Will that change be judged as being achieved by cheapening the offering? Perhaps a price revision needs to await a new opportunity arising from a new product.
Problems 6.3.1
(1) How many people do you know? Out of these, how many own a Ford car less than three years old? From your answers, estimate how many Ford cars a year will be sold in the UK in the next calendar year? How accurate do you think this answer is?
(2) Using the NRS and ACORN models, describe yourself and determine the best method to gain a good response rate from your group.
(3) If you wished to open a shop specializing in fishing tackle in your home town, what basic information do you think you will need to form an estimation of potential customers? Where will you find it?
(4) Can you think of several questions where your answer may be swayed by a desire to be seen as being politically correct?
(5) Using the matrix in Table 6.3.1, categorize a number of restaurants.
6.4 Market strategy
For an organization to be competitive it must have products that the market wants, at the right price and in the right place backed up by effective promotion.
It must satisfy all its customer’s needs to win orders by critically examining its competitive strength. It must then determine which market it can best serve, if need be by forming partnerships with others. These are examined in this section.
The marketing mix
In marketing terms, there are said to be four ‘P’s which lead to a customer purchasing a particular product:
![]()
As these are what makes someone actually buy the product, it is worthwhile examining them in detail – especially in relation to what your competitors are offering.
The products
As anyone who has watched advertisements should realize, a product is more than just a physical mixture of features. Each product has many connotations and images attached to it, which are worthwhile examining separately.
Benefits
Designers of products, especially in engineering, tend to concentrate on the features of a product as that is the physical matter that they are creating. When you buy a product you are actually buying benefits rather than features. Benefits are everything that a customer gets from owning the product, over and above the physical product itself. These are the needs that a product should be designed to meet. They are what our salesmen should be stressing to potential customers.
Intangible benefits. These are the deeper underlying reasons why people buy particular types of products. There can be more than one intangible associated with a product. Examples are:
• Perfume and cosmetics – to achieve increased appeal to others.
• Sports car – to achieve increased appeal plus excitement.
• Washing powder – to show that you are a proper parent.
• Fashion clothing – a sense of belonging and being up to date.
Tangible benefits. These are less deep than intangible, but could be said to be the more apparent need that the product is meeting. Again there can be several tangible, and intangible, needs that a product could satisfy:
Feature attributes
These relate to the physical product itself and can be easily perceived by the customer, sometimes even before purchasing. They are normally easy to compare to the features of our competitors’ products externally. They are therefore important in being pleasing and what the customer expects in a product.
• Size: Could relate to any measurement such as overall length or internal width of a car, or the screen size of a television.
• Shape: Customers associate a certain shape to a product – that is why it can be difficult to sell a technically superior product when it comes in a shape that the customer does not associate with the product.
• Quantity: Could relate to the content of a package, or the seating capacity of a car.
• Service: Could relate to the time to be served in a restaurant, the number of trains each hour between two towns.
• Taste: Could be related to sweetness or bitterness of a soft drink.
• Odour: Could relate to the smell of a perfume on someone’s skin – or even how long that smell lasts.
• Colour: Could relate to the range of colours that a car comes in.
• Power: Could relate to a car engine or the wattage of a CD sound system.
• Efficiency: Could relate to the kilometre per mile performance of a car or the amount of water used by a washing machine.
Signal attributes
These are more aesthetic and aimed to appeal to the senses, although they are also closely linked to the intangible benefits above. Sometimes they are used in the selling environment, rather than in the product itself.
Product range
As not all customers want exactly the same product, we have to produce differentiated products so that we can attract a variety of customers. This differentiation causes problems within manufacturing – so our designs have to be careful to use as many common parts as possible, whilst being able to show real differences. There are two measures here:
• Range: The number of different product lines available. Examples include the different named models from a car manufacturer or the different toothpastes produced by the same company.
• Depth: Depth within each product line. This could be the various models (can be over twenty) from a car manufacturer under the same name. Could also refer to the different size of packaging containing the same product as in soft drinks or breakfast cereals.
Place (distribution)
This relates to ensuring that the product is in a place where potential customers can see and access it, so that they will make the purchase. This must be done efficiently and effectively.
• Distribution cover – how many potential customers are reached and the channel used.
– Transport used, e.g. road, rail, postal service, specialist carriers. Speed of delivery may be important as in the newspaper industry.
– Service – covers matters such as number of deliveries per day/week and reaction time to a variation in order pattern.
• Nature of outlets – the product should match expectations of the customer in where to find it.
Promotion
This is how the organization communicates with its customers along the distribution channel. There can be a variety of reasons for communicating, e.g. special offers or a new advertising campaign can be directed at retailers. There are a number of avenues used:
• Advertising: The common recognized means of drawing people’s attention to a product offering (see page 266 for range of aims and means).
– Focus: Can be directed to particular channel members or individual groups of end customers.
– General: Direct to all members of channel or general public.
– Publicity: Although more a general broadcast, this can be tying a specific product to an event, such as Formula One racing, or getting sport celebrities to wear, or use, particular products.
• Sales promotion: This relates more to direct inducement:
• Sales: This relates to the direct selling:
– Sales system. How the actual transaction takes place.
– Personal selling. How many staff deal with customers. In supermarkets no direct selling takes place.
• Public relations: More general publicity around an organization to improve particular aspects of its image, e.g. by support of a special charity event or a local organization.
• Packaging: Although primary function is protection and appeal, it also offers an opportunity to send messages to customers.
Price
Although price can be very important, we have to remember that it determines the profit after deducting all the costs. Less than cost price can be used as a marketing tool, but only where long-term profit results, e.g. to penetrate a market, or as a loss leader to entice customers to buy other profitable products. It can also be used to target particular customers who may be useful either through the bulk purchases they bring or through future sales. We have to be careful about our pricing structure in relation to our other customers and our competitors.
Allowances and discounts. These are used to pass on some of the savings that result through large commitments. Usually varied in relation to quantity or order value, but can also be used to entice early payment of invoices, e.g. 2% reduction if paid within seven days.
Pricing gap. This is between all the costs and the price. Can be used to set allowances and discounts (see Chapter 5 for margins).
Customer valuation of benefits. This is where real profits can be made. If there are criteria such as quality or on-time delivery that the customer values highly, they may be willing to accept a higher price.
Service extensions
In addition to the four Ps, there are other criteria that customers use in deciding where to trade, and who to trade with. These could be said to be another three Ps.
People
There is a variety of your people that your customers come into contact with when trading with you. It is important that staff are trained as being representatives of your organization and show the expected attitude towards your customers. This includes their appearance and behaviour.
Order process
The most important transactions with the customer are the placing of the order and the associated payment. The procedures should be friendly, efficient and error resistant, even when chasing late payments.
Automation may appear to save money, but can be a turn-off for your customer. They like to deal with friendly and efficient people, not machines. Information technology can assist your people to be fast and efficient – when the systems are correctly designed. Credit control procedures are especially important here.
It is possible to increase customer involvement as in self-service in supermarkets and on the Internet, but remember to have staff available as a back-up to answer customer queries and problems.
Physical surroundings
The customer expects certain environments when they are doing business. You therefore have to examine all areas that the customer may visit and ensure that they meet the customer’s expectations. Key areas are the approach to your plant/offices (i.e. look at them as if you were approaching them for the first time) and the impression of the reception area and meeting rooms. Do not forget the factory and despatch areas -your customer may visit these.
Market qualifying and order-winning criteria
For every product, the customers not only examine the product offering, but have a further set of criteria in their minds when examining which of a number of competing products to purchase. Terry Hill of the London Business School laid down the following in his book Manufacturing Strategy:
• Market qualifying criteria are attributes that the customer expects from all competing suppliers. Some are more critical and are termed order-losing sensitive qualifiers.
• Order-losing criteria are those considered to be critical to the customer and a failure to demonstrate them will exclude the supplier from consideration.
• Order-winning criteria are those attributes that enable a company’s offerings to gain an advantage over their competitors in the eyes of the customers. These eventually win the actual order.
Over time, order winners will tend to change to market-qualifying or order-losing criteria and new order winners take their place. We must therefore continually identify what these criteria are and ensure that our internal processes can deliver them to the customer and ensure they are satisfied.
Criteria can be either related directly to the product itself, or they can be more service oriented. A company, by focusing on those criteria in which it does well, will often gain a competitive advantage. Criteria looked for include:
• Speed of design process: Being able to quickly give a customer an idea of how you can meet his stated need. Increasingly important in conjunction with customer’s redesign process. Component and sub assembly suppliers are increasingly working hand in hand with their customers on new designs. Being able to communicate electron ically can be key here.
• Speed of quoting: As many customers are looking for quick deliveries of the product itself, the speed of replying to their requests for price and delivery can be crucial in gaining the order.
• Quality: This covers several aspects:
– Conforming to the customer specification for use.
– Number of defects in a batch. Especially important as more customers are moving towards having no incoming inspection and putting incoming components straight onto the manufacturing line. This can apply to information as well as tangible products.
– Reliability, i.e. the maintenance of good functional operation over time. Important to all customers, but more so to some, e.g. aeronautical and defence. May include aspects of ease of maintenance.
• Delivery on time: Being able to give a reliable time frame for a delivery is becoming more important as customers move towards minimal inventory of raw materials and are geared up to JIT (just-in-time) operations. Being able to meet an advertised product launch date is especially important in maintaining an organization’s customer image.
• Quick delivery: In many situations being able to give the customer immediately what he wants when he asks for it is critical. In this case, we either need extremely efficient manufacturing or need to carry a stock of items that may be wanted. The latter involves storage facilities, opens up the risk of obsolescence and ties up our money. Many items, however, are expected to be available ex-stock, especially in convenience goods. However, we do need to be able to give all customers their delivery within the time they need it. The P:D ratio can be critical in winning orders (see Figure 6.4.1).

• Flexibility in volume: Being able to react in tune with the quantity needed by the customer in volatile markets can be attractive.
• Flexibility in design: Being able to quickly customize standard designs to meet the customer’s particular needs. Modular design is advantageous here.
• Technical information: As many customers will not carry the technical expertise which should be within your organization, you may need to be able to quickly and accurately answer technical queries. This can be pre-sales or after-sales.
• After-sales service: Often the product’s relationship does not finish with the sale – there can be a large degree of follow-up service required, e.g. service engineers, spare parts, technical information about operations or maintenance.
• Ethical behaviour: As worldwide trading expands, concerns such as child labour, a fair price for indigenous materials and other human rights concerns have to be addressed to ensure that different customer concerns are being meet.
• Environment: As this is another area of concern, processes have to be environmentally neutral by producing a minimum of waste and pollutants. Recyclability and reuse may be important.
Figure 6.4.2 demonstrates a profile comparison between what the market requires and an organization. Where the two profile lines harmonize the organization is matching the market’s needs.

Where there is a large difference, this is an indication of either of two things:
• We are not being sufficiently efficient in matching what the market criteria are. We therefore need to improve this weakness in our internal processes and facilities, or find a different market to supply to.
• We are overefficient in meeting the market criteria. We can either:
The basic brief was to increase productivity at a minimal capital cost. Time available was an eight-week BESO assignment.
A competitive profile derived for the organization is reproduced in Figure 6.4.3. Time was too short to interview many customers and the market requirements were based mainly on discussions with the organization’s marketing personnel. The company’s achieved performance was arrived at by observation and discussion.

Figure 6.4.3 Company profile analysis showing difference between consultant’s view and organization’s view
This clearly showed that the organization’s competitive advantage lay in its design skills. However, it also showed several weaknesses, namely:
Initially the identification of quality as one of the company’s major weaknesses was not believed as they had a reputation of producing high-grade products for their customers.
The starting point in persuading personnel that internal quality problems were the most important and were behind the other symptoms started with demonstrating the consequence of quality faults as per Figure 6.4.4. The important items that were identified were the following internal failure costs.

• Scrapped products – extra costs and delays in producing replacements.
• Reworked products – extra costs and delays.
• Inspection – highly skilled labour used in non-productive work.
The personnel within the organization, by not identifying root causes, were too often demonstrating their skill in rectifying defects rather than in preventing them reoccurring. By eliminating much of the quality problems they could produce items quicker and with less costs.
The competitive profile
You need to closely assess your own position within the marketplace, not only against your customers’ criteria, but also in how your competitors are matching these.
A polar chart (see Figure 6.4.5) or a profile comparison can illustrate the difference between you and your competitors in meeting the customers’ criteria. This demonstrates their and your relative strengths and weaknesses under a variety of attributes.

Figure 6.4.5 Polar chart comparison of organization and major competitor. The profiles are similar except that the organization is performing better in quoted delivery but worse in reliable delivery
Weaknesses have to be corrected, or protected. Strengths have to be built on – especially if they are superior to the competition. In Figure 6.4.5, we have a weakness in new equipment, but a strength in cash reserves. The strong cash reserve could be used to purchase up-to-date equipment that may convert the present weakness into a strength. It could be used to support price reductions, mount a large advertising campaign or even to buy over a competitor.
We also need to examine our entire supply chain for existing, or potential, risks and problems. We are especially concerned with our reliance on either particular suppliers or customers.
Suppliers
Here we are looking at our vulnerability to problems in supply from happenings such as strikes, takeovers, fires, etc. Question how dependent on each supplier you are, and how important you are to them in turn. Indicators are:
• What proportion of the requirement for any item does any individual company, or small group, supply?
Where we are heavily dependent on one, or a few suppliers we must take strategic measures to ensure maintenance of supply. This may involve seeking other possible suppliers.
The problem here is that relationships with suppliers can be crucial if they have expertise, or are willing to be flexible in their dealings with you. Spreading purchasing can damage long-term relationships that have been built up.
Looking at the supply position matrix (Figure 6.4.6) shows the four extremes:
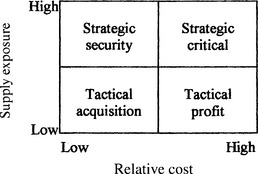
• Exposure low – low cost item: Buy tactically – play off suppliers against each other to give us special terms on delivery, etc.
• Exposure low – high cost item: Buy when prices are low, or demand is low.
• Exposure high – low cost item: Arrange a guarantee of supply, perhaps using a few key suppliers.
• Exposure high – high cost items: Serious if vulnerable – secure long-term supply agreement.
Customers
Here we are looking at our strength in relation to our customers. What happens if a major customer stops buying from us? In other words, how important we are to each customer and how dependent they are on us. Questions to be asked are:
• What proportion of your output goes to your main customer, or even the top three customers?
When we are heavily dependent on a few customers we are vulnerable not only to the possible loss of the trade, but to pressure being put on us by the customer, e.g. to reduce prices, accept late payments, reduce lead time, etc.
Again we have a matrix to guide strategy – the supplier preference (Figure 6.4.7) where we examine our competitive advantage against the attractiveness of the customer.

• Low profit – no competitive advantage: This is a nuisance, and we should examine it to determine marginal profits involved in dropping it.
• Low profit – high competitive advantage: This should be exploited to maximize revenue, bearing long-term relationship in mind.
• High profit – no competitive advantage: We need to develop long-term supply arrangements, being careful what we are willing to give in return.
• High profit – high competitive advantage: This is our core business and we need to ensure that we do not lose it.
Threats of new entrants to market
Even when we a do have a strong position in a particular market, we are not necessarily secure there in the future. If it is a profitable area, this will attract new producers to move into the industry. We need to ensure that this is difficult by considering:
• Economy of scale: There are breakeven points for manufacturing different quantities. We have to ensure that we maintain these for our own facilities which will make it difficult for new entrants to get enough orders to cover their costs. We also have to guard against unnecessary centralization as that adds complexity and makes it easy to get out of touch with customers.
• Capital requirements: Often costs are contained by using expensive processes. We have to ensure that we maximize this through investment and keeping capacity filled.
• Customer loyalty: The cheapest customer to get to buy from us is one with whom we have already built up a relationship. We should ensure we keep our customer happy.
• Learning curves: As an organization builds up experience in design and manufacturing, it discovers ways to improve output at reduced cost. We have to ensure we maintain our own learning and improvement and keep ahead.
• Sophistication of technology: We must ensure that we keep up to date in both product and process technology.
• Distribution Channels: The complete channels give access to a range of customers. We have to maintain good relationships all along the supply chain – both into us and from us to the end user.
Where entry barriers are weak, we need to strengthen them by building cost and relationship advantages.
Threats of substitute products
All products have a natural life. The ideal situation is that the end of that life is within your hands and you can replace products readily. To maintain that position we need to be continually researching the market to determine what substitute products already exist, and researching to see how easily they could be developed.
These researches should also feed back into your own development programme for new products. Better that you bring them to market, than your competitors.
Existing competition
We have to continually be aware of our competitors and what they are doing. We also need to be aware of factors that may lead to intense competition developing:
• Numerous, or equal sized companies: Difficult to maintain a dominant position.
• Slow market growth: As capability improves, we normally need to expand sales to maintain our return on investment. Slow market growth means that all the suppliers intensify their activity to gain whatever growth there is.
• Lack of product differential: Where all suppliers offer the same basic product, then other non-feature aspects are used to try to gain customers. These include advertising campaigns, price cuts, special offers, etc.
• Capacity utilization: Where spare capacity exists either in the industry as a whole, or in a particular competitor, then special efforts will be made to fill that capacity. Often the only way to do this is to capture customers from others.
Looking at the influence of each of these four factors together leads to what is termed a five-force analysis – the fifth factor being the resultant rivalry.
Market strategy and planning
It is important that an organization carefully plans out its future strategy in product development.
The Ansoff matrix (see page 263) explored potential areas of growth. The General Electric matrix (Figure 6.4.8) attempts to denote an organization’s market competitiveness. The circle size indicates the size of the market and the segment the market share. The length and direction of the arrow indicate direction and speed of the expected change.

Competitiveness position is determined by a mixture of market share, strength of product line, relative cost/price structure, distribution facilities, brand profile, technical skills, production facilities, raw material sources, strength of sales staff, etc.
Market size, market share, profit margins, capital investment needed, competition, technical synergy, customers, risk, growth, etc. determine the market attractiveness.
From an analysis of where we are and where we can/wish to go, we can draft detailed marketing plans:
• Determine relevant markets and their segmentation.
• Identify characteristics of the potential segments.
• Evaluate segment attractiveness and the organization’s competitive position serving each segment.
• Select target market segments.
• Set objectives and strategies for each selected segment.
• Develop full marketing mix for each selected segment.
An organization’s ability to turn these plans into reality is determined by their capability. It is important therefore to be able to clearly establish what the organization has in resources, i.e. its staff and their skills; techniques; processes, etc. They can then ensure that the market plan utilizes their strengths, or that action is taken to rectify any weaknesses. A full SWOT (Strengths, Weaknesses, Opportunities, Threats) analysis needs to be carried out looking both internally and externally.
Co-operation with other organizations
At sometime, most organizations have to co-operate with other organizations. The idea behind co-operation is to make use of the separate skills, experience and contacts in a way that each of the separate organizations are unable to do by themselves. The co-operation may be due to:External forces:
• Globalization: In order to gain access to markets it is necessary to have a very wide presence. This can be expensive and difficult.
• Share technology: Because of the cost of researching and developing new products and processes and then attended risk, many organizations share the cost and benefits.
• Trading in other sectors can counterbalance turbulence in the organization’s normal sectors.
Internal forces:
• Competence weakness in skills, technology.
• Capital involved may be difficult for one organization to fund.
Type of co-operation:
• Alliance: A temporary informal joining together, normally to tackle a particular problem.
• Consortium: Coming together to make up a wider skill base -such as bidding for the building and equipping of a power station.
• Joint venture: Forming a separate legal entity to exploit a particular market or product development. Often the only legal way to work in some countries is a joint venture with a local company or individual.
• Merger: A full joining into one organization.
• Acquisition: Buying over another organization – may be hostile (unsupported by the board of the bought company) or friendly (recommended by the board).
In all cases there will probably be problems arising through several different cultures and management styles competing in the new organization or relationship. It is noticeable that over 50% of mergers end up with a smaller benefit than envisaged.
Making contingency plans
The difficulty with the marketplace is that it is always changing and a company must be ready to react to these changes. One way is to follow up a forecast of the possible future changes in the market or the environment by devising plans to cope with these possible changes.
The way that this is achieved is by scenario analysis. This is based on the organization’s competitive analysis and then applying the principal impact factors from three scenarios, derive the likeliest possible severe impact on the organization. By looking at this impact and its probability the need to develop a contingency plan to deal with the impacts will be prioritized.
As an example take a university offering engineering degree courses. The scenarios are:
The principal areas of concern are:

The evaluated events are then placed on a scenario matrix as in Figure 6.4.9. Using the letter and number, e.g. A.1, is the cost factor change under scenario 1. The axes are ‘probability of occurrence’ and ‘strategic importance’. Quadrant one, i.e. top right hand, is where the likely strategically important factors will congregate. In this case, strategic contingency plans must be made for events A.2, C.2 and D.1.

Further outline plans may be considered for those just outside this quadrant, i.e. events within the dotted lines, e.g. A.1, B.2, C.1 and A.3.
Problems 6.4.1
(1) What are the product features and attributes associated with a wrist-watch?
(2) Why do order-winning-criteria tend to change to market-qualifying criteria over time?
(3) If you were in the home delivery service, what factors would you consider worthy of considering in a scenario analysis?
(4) If you were a university, what factors should you consider in a competitiveness analysis?
(5) What partners could a university consider in the UK and further afield and what would be the best relationships to be formed?