
Implementing a Risk Mitigation Plan
The next step is to implement the risk mitigation plan, which is when the countermeasures are put into place. The two primary goals when implementing a risk mitigation plan are:
- Staying within budget
- Staying on schedule
Any project will have unknowns and surprises, and this is especially true for complex countermeasures. However, advance planning will reduce these unknowns to a minimum. Without adequate planning, the project may go overbudget or be frequently delayed.
Either problem could cause management to change its mind on the value of the countermeasure. If it costs too much or takes too long to implement, management will question the value of the countermeasure.
Staying Within Budget
In the example of the addition of the web farm and failover cluster presented earlier in the chapter, after they are implemented, they will decrease outages and increase availability of the website. These are examples of complex countermeasures.
If all the costs to implement the plan have been identified, the project will go smoothly, but, if some of the costs were not identified, the project will have problems. These problems could appear in any of the following areas:
- Initial purchase costs—The equipment is expensive, and servers used in a failover cluster have specific technical requirements. If someone decides to cut costs and buy cheaper servers at the expense of the failover cluster requirements, additional problems may be encountered. Extensive testing may be necessary to ultimately determine whether the cheaper servers would be reliable in the failover cluster. Worse, the cheaper servers might not work in a failover cluster, and more servers would need to be purchased.
- Facility costs—The new servers may not fit in the existing equipment bays, which would require facility costs to accommodate them. As well, the addition of the servers may overload the power fed to the room and cause circuit breakers to pop, which could result in outages for other servers. The air-conditioning may be inadequate to sufficiently cool the room, which could overheat and result in equipment damage to existing servers. Any of these problems could be substantial if they were not addressed earlier.
- Installation costs—If the in-house personnel don’t have the expertise to install the countermeasure, additional expenses will be incurred for a professional installation, and the project will be delayed. In-house technicians, without the necessary expertise, trying to but failing to do the install and configuration will expend valuable labor hours, and, worse, their efforts may actually damage the countermeasure.
- Training costs—If technicians don’t know how to operate the countermeasure, it may just sit in the corner gathering dust. Yes, it is a fancy new server that can do great and wonderful things. But, if no one knows how to use it, it may stay in the box or be powered down after technicians install it, and a delay in implementation will occur until personnel receive adequate training.
Any of these additional costs could easily bust the budget. If the cost of the countermeasure exceeds the allocated budget, management could decide to pull the plug on the countermeasure. Moreover, each time an additional cost is identified, the CBA needs to be reevaluated because the original decision to implement the countermeasure was based on the original costs. As the costs go up, the value of the countermeasure goes down.
Staying on Schedule
An important consideration for any project is the schedule. Tasks should be planned to ensure they occur in a specific order, which means that, if any task is delayed, other tasks may also be delayed, and these delays may affect the actual implementation date.
One of the tools that can be used for staying on schedule is a milestone chart. FIGURE 11-5 shows a sample milestone chart for the web server upgrade discussed in this chapter. Project managers typically use project management software that automates the creation of these charts.

FIGURE 11-5 Milestone plan chart.
When using project management software, the milestone dates and the length of any specific tasks can be entered. The software then allows for the displaying of the data in multiple formats.
For example, FIGURE 11-6 shows the same project in a Gantt chart format. Once the data has been entered into the project management software, showing the data in an alternate format is relatively easy. Often, changing the format requires only a few clicks of the mouse.

FIGURE 11-6 Gantt chart.
Some tasks are dependent on each other. For example, new equipment bays need to be installed before power can be run to the bays, and the timing of the training is important. If training is provided too early, it won’t be fresh when the technicians need to install the equipment, whereas, if it’s provided too late, they may need to install the equipment without the training or the project schedule could slip.
A critical path chart shows dependencies, as shown in FIGURE 11-7. If any of the items in the critical path slip, the entire project will be delayed. Managers must pay close attention to critical path items to ensure the project stays on schedule.
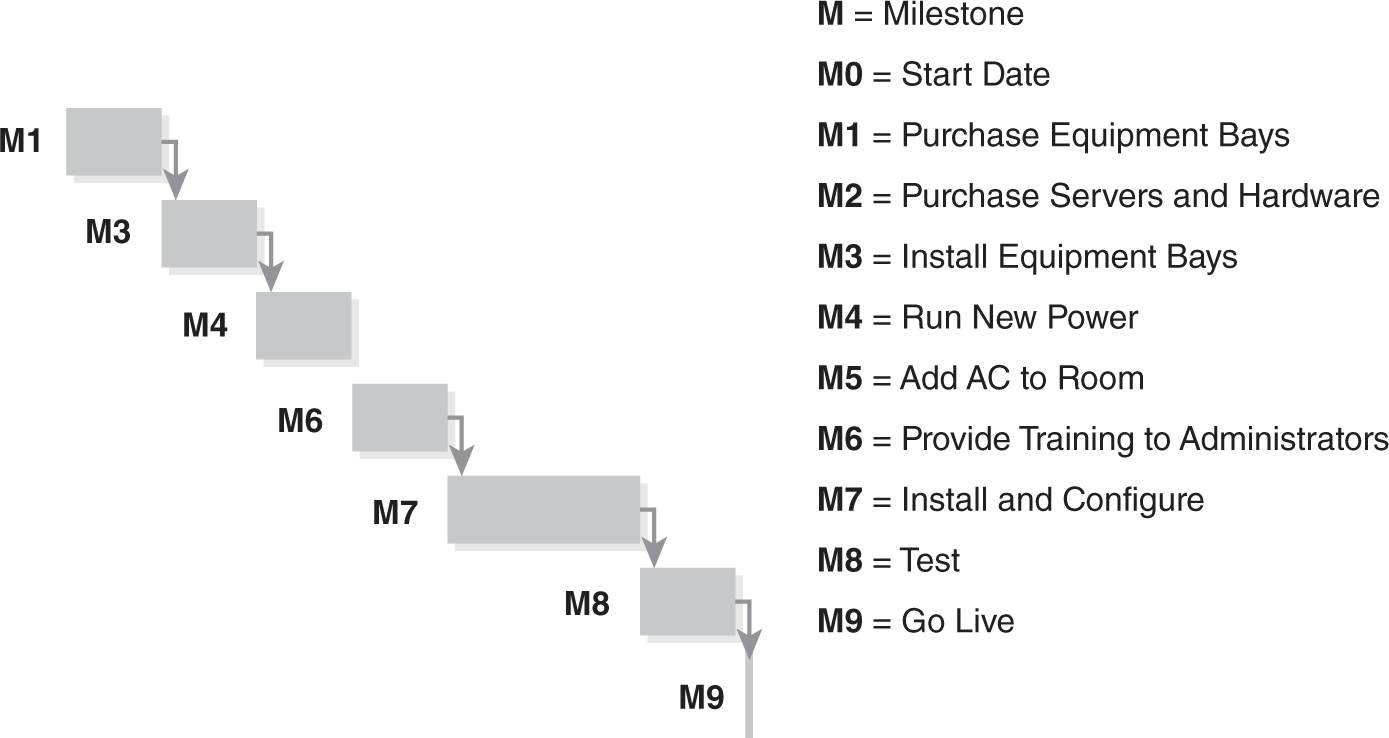
FIGURE 11-7 Critical path chart.
For example, milestones 2 and 5 are not on the critical path. The purchase of the servers and hardware and the addition of air-conditioning to the room can be delayed. Of course, they can’t be delayed indefinitely. When it’s time to install and configure the servers, these milestones must be met. However, managers can give milestones 2 and 5 less attention early in the project as they focus on critical path milestones.
The tools used aren’t as important as realizing that they are available. For simple projects, the schedule may simply be sketched out on a napkin, but larger projects would benefit from the more sophisticated project management tools that are available.