
Reporting Requirements
After data on the risks and recommendations has been collected, the data needs to be included in a report. This report will then be presented to management. The primary purpose of the report is to allow management to decide on what recommendations to use.
There are four major categories of reporting requirements:
- Presenting recommendations—These recommendations are the risk response recommendations.
- Documenting management response to recommendations—Management can accept, modify, or defer any of the recommendations.
- Documenting and tracking implementation of accepted recommendations—This process becomes the actual risk response plan.
- Creating a POAM—The POAM tracks the risk response actions.
Presenting Recommendations
The collected data is compiled into a report, which will include the lists of threats, vulnerabilities, and recommendations. This report is then presented to management. Management will use this data to decide what steps to take.
Remembering the overall goal of the risk management plan is important at this stage. The goal is to identify the risks and recommend strategies to reduce them. Most of the risks won’t be eliminated, but, instead, they will be reduced to an acceptable level. Every risk identified will be accompanied by a recommendation to reduce the risk.
This report should include the following information:
- Findings
- Recommendation cost and time frame
- CBA
Findings
The findings list the facts. Remember that losses from risks occur when a threat exploits a vulnerability. Risk management findings need to include threats, vulnerabilities, and potential losses. The findings are described as cause, criteria, and effect:
- Cause—The cause is the threat. For example, an attacker may try to launch a DoS attack. In this case, the threat is the attacker. Identifying the root cause is also important. A successful attack is dependent on an attacker having access and the system being vulnerable. Risk management attempts to reduce the impact of the cause or reduce the vulnerabilities.
- Criteria—The criteria that will allow the threat to succeed are identified, which are the vulnerabilities. For example, a server would be susceptible to a DoS attack if the following criteria are met:
- Inadequate manpower—If manpower isn’t adequate to perform security steps, the site is vulnerable.
- Unmanaged firewall—Each open port represents a vulnerability. If ports are not managed on a firewall, unwanted traffic can be allowed in.
- No intrusion detection system (IDS)—Depending on the type of IDS, it not only detects intrusions, but also responds to intrusions and changes in the environment.
- Operating system not updated—Applying patches to the system as they are released and tested is imperative. If updates are not applied, the system is vulnerable to new exploits.
- Antivirus software not installed and updated—Antivirus software can detect malware. The software should be updated with definitions to ensure it will detect new malware.
- Effect—The effect is often an outage of some type. For example, the effect on a website could be that the website is not reachable any more.
 NOTE
NOTE
A DoS attack is any attack designed to prevent a system from providing a service. A distributed DoS (DDoS) attack is a DoS attack launched from multiple systems at the same time. DDoS attacks often include zombie computers controlled in a botnet.
An important consideration as findings are documented is resource availability. Possibly, all the discovered issues were previously known. However, money may not have been allocated to purchase the solutions in the past. Also, possibly, manpower wasn’t adequate to implement the solutions.
When adequate manpower isn’t available, security is often sacrificed for ease of use. Consider the website example. The first goal may be to ensure the website is operational. Once it’s up, resources may be used for other jobs. The website may still not be secure, backups may not be made, or other security issues may still exist.
A cause and effect diagram can be used to discover and document the findings. FIGURE 4-2 shows an example of a cause and effect diagram for the website scenario. In this diagram, the primary cause is an attack. The remaining items are contributing factors that allow the attack to succeed. The effect is an outage.
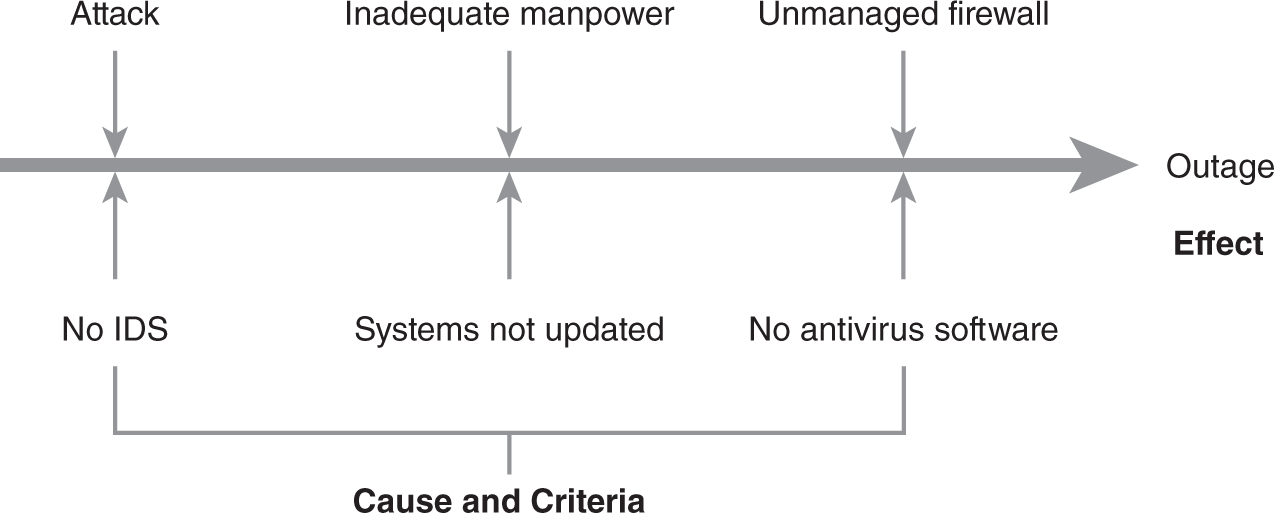
FIGURE 4-2 Website cause and effect diagram.
Using a cause and effect diagram has several advantages. It can help guide discussions during the discovery process and help visualize the relationships between causes and effects in documentation. Cause and effect diagrams can be used for any problem.
A cause and effect diagram starts by creating the line and the ultimate effect. In Figure 4-2, the effect is the outage. Then, additional items are added (the causes), making the diagram look similar to a fishbone. The diagram can be expanded for any of the elements. For example, “attack” could be expanded to include specific types of attacks. Attacks may include malware, DoS, buffer overflow, or other types of attacks.
NOTE
The cause and effect diagram is also called an Ishikawa diagram, or a fishbone diagram. It is used to link problems with causes.
When creating a cause and effect diagram, running out of ideas or focus on a single topic might happen. To balance the diagram, the following five elements can be considered, but not all of them need to be included. However, any of them can be used to help identify causes:
- Methods—What methods could contribute to an outage?
- Machinery—What machinery issues could contribute to an outage?
- Manpower—What manpower issues could contribute to an outage?
- Materials—What material issues could contribute to an outage?
- Environment—What environmental issues could contribute to an outage?
FIGURE 4-3 shows another example of a cause and effect diagram. In this example, the cause is loss of confidentiality. The remaining items show the criteria that can allow the loss of data. For HIPAA, the effect can be substantial fines or criminal charges such as jail time.
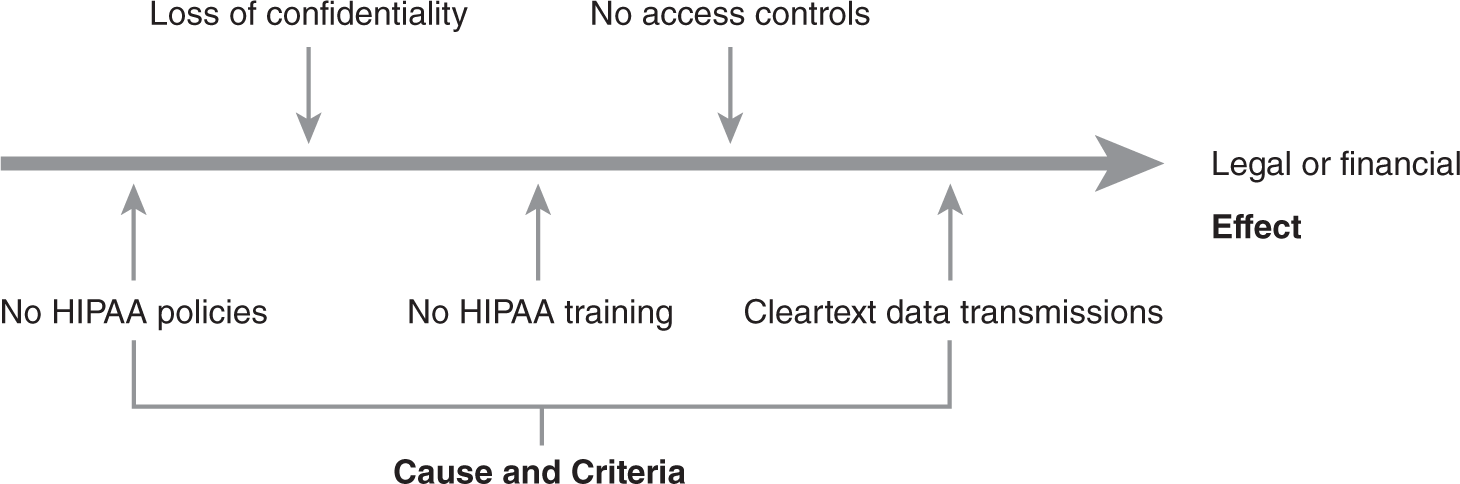
FIGURE 4-3 HIPAA compliance cause and effect diagram.
Recommendation Cost and Time Frame
In addition to the findings, the report will include a list of recommendations. These recommendations will address the potential causes and criteria that can result in the negative effect.
NOTE
The individual ongoing costs may be small, but the cumulative requirements may be more. In this example, the time required to maintain these solutions may justify an additional administrator.
Each item should include the cost required to implement it. The timeline should also be included to implement the solution. Management will use this data to decide whether the solution should be applied.
For example, the following partial list of recommendations could be included in the website risk management plan:
- Upgrading firewall—Initial cost: $4,000. Ongoing costs: $1,000 annually. The initial cost will cover the purchase of the firewall. The ongoing costs are related to training and maintenance. The firewall should be purchased and installed within 30 days of approval.
- Purchasing and installing IDS—Initial cost: $1,500. Ongoing costs: negligible. The IDS should be purchased and installed within 30 days of approval.
- Creating a plan to keep the system updated—Initial cost: manpower. Ongoing costs: manpower. The system should be purchased and installed within 30 days of approval.
- Installing antivirus software on server—Initial cost: $75. Ongoing costs: negligible. The software should be purchased and installed within 30 days of approval.
- Updating antivirus software—Initial cost: negligible. Ongoing costs: negligible. Antivirus software for automatic updates should be configured after installation.
- Adding one IT administrator—Cost: negotiated salary. Because of the ongoing maintenance requirements of these recommendations, an additional administrator is required.
Cost-Benefit Analysis
The CBA is a process used to determine how to manage a risk. If the benefits of a control outweigh the costs, the control can be implemented to reduce the risk. If the costs are greater than the benefits, the risk can be accepted.
In this context, the CBA should include two items:
- Cost of the recommendation—The recommendation is the control intended to manage the risk. If ongoing costs are anticipated, they should be included in the calculation.
- Projected benefits—Benefits are calculated in terms of dollars. They can be expressed as money earned or losses reduced.
Management is responsible for making the decisions on how to manage the risks. An accurate CBA allows management to make intelligent decisions.
Here is an example of a CBA for a website recommendation:
- Recommendation—Install antivirus software on the web server.
- Cost of the recommendation—$75.
- Background—Antivirus software was not installed on the web server in the past because of performance concerns. Malware infected the web server several times in the past year, which caused multiple outages on the web server. The total downtime was five hours. The web server generates approximately $500 per 15 minutes of uptime, or $2,000 per hour. Antivirus software is expected to prevent 90 percent of infections.
- Loss before antivirus software—$30,000. Outages resulted in $10,000 of direct loss of revenue ($2,000 × 5 hours). Indirect losses are estimated to be $20,000, which includes the advertising costs to bring back lost customers.
- Expected loss with antivirus software—$3,000. The antivirus software is expected to reduce the losses by 90 percent [$30,000 − ($30,000 × .9) = $3,000].
- Benefit of antivirus software—$27,000 ($30,000 × .9 = $27,000).
- CBA—$26,925. The CBA is calculated as:
- Loss before antivirus software − Loss after antivirus software − Cost of antivirus software
- $30,000 − $3,000 − $75 = $26,925
The importance of accurate data can’t be overestimated. The key to completing an accurate CBA is starting with accurate data. Again, sometimes, accurate data is difficult to get. Finding accurate data often requires digging below the surface to determine costs.
Probing questions can often uncover flaws in the data. Following are scenarios and questions to be considered:
- If a control is said to reduce losses by 90 percent, ask, “How did you arrive at 90 percent?”
- If the cost of a control is given, ask, “Does this include any ongoing costs?”
Probing questions don’t need to be accusatory. The goal isn’t to create a conflict. Instead, the goal is to validate the data. Questions should be asked with a tone of “help me understand.” If the data is flawed, the presenter can easily get defensive. On the other hand, if the data is valid, the presenter can answer questions with facts to support the claims.
Risk Statements
Reports are often summarized in risk statements. Risk statements are used to communicate a risk and the resulting impact. They are often written using “if/then” statements. The “if” part of the statement identifies the elements of the risk, and the “then” portion of the statement identifies the effect. For example, the following risk statement could be used for the website:
- If antivirus software is not installed on the web server, then the likelihood that the server will become infected is high. The web server has a constant connection to the Internet.
- If the server is infected, then an outage is likely to occur. Any outage will result in $500 of lost sales for every 15 minutes of downtime.
The risk statements should be able to be matched to the scope and objectives of the project. If the statement isn’t within the scope or objectives, the risk assessment may be off track, which means the findings or the recommendation need to be focused.
Documenting Management Response to Recommendations
After the recommendations have been presented to the managers, they will decide what to do. They can either accept, defer, or modify recommendations:
- Accept—Management can approve the recommendation. Approved recommendations are funded and implemented. They will then be added to a POAM for tracking.
- Defer—Management can defer a recommendation. The recommendation may still be implemented at a later time. However, the recommendation is not included in the list of accepted recommendations.
- Modify—Management can modify a recommendation. For example, a firewall may be recommended, but management decides to install two firewalls to implement a demilitarized zone (DMZ). On the other hand, a $4,000 firewall may be recommended, but management decides to purchase an $800 firewall instead.
NOTE
A demilitarized zone (DMZ) is commonly used to protect Internet-facing servers. It usually consists of two firewalls. One firewall filters traffic from the Internet to the DMZ, and the other firewall filters traffic from the internal network to the DMZ.
Documenting and Tracking Implementation of Accepted Recommendations
Documenting the decisions made by management is important. As time passes, the decisions can become distorted if they are not documented, which is especially true if the recommendations are deferred or modified.
For example, in managing the risk management plan for the website, the plan recommended purchase of antivirus software, but this recommendation was deferred. Three months later, the system is infected with malware. A four-hour outage results in losses exceeding $8,000. The question may be asked why the software wasn’t purchased.
If the decisions had been documented, this would be a simple matter to address. Without documentation, the result may be uncomfortable finger-pointing.
The documentation doesn’t need to be extensive. It could be a simple document listing the recommendation and the decision. It could look similar to this:
- Recommendation to purchase antivirus software—Accepted. Software is to be purchased as soon as possible.
- Recommendation to hire an IT administrator—Deferred. IT department needs to provide clearer justification for this. In the interim, the IT department is authorized to use overtime to ensure security requirements are met.
- Recommendation to purchase SS75 firewall—Modified. Two SS75 firewalls are to be purchased as soon as possible. These two firewalls will be configured as a DMZ.