
Chapter 1
Malware Incident Response
Volatile Data Collection and Examination on a Live Windows System
Solutions in this chapter:
• Volatile Data Collection Methodology
![]() Collecting Subject System Details
Collecting Subject System Details
![]() Current and Recent Network Connections
Current and Recent Network Connections
• Collecting Process Information
• Correlate Open Ports with Running Processes and Programs
![]() Identifying Services and Drivers
Identifying Services and Drivers
• Non-Volatile Data Collection from a Live Windows System
![]() Forensic Duplication of Storage Media
Forensic Duplication of Storage Media
![]() Forensic Preservation of Select Data
Forensic Preservation of Select Data
![]() Assessing Security Configuration
Assessing Security Configuration
![]() Assessing Trusted Host Relationships
Assessing Trusted Host Relationships
![]() Inspect Auto-Starting Locations
Inspect Auto-Starting Locations
![]() Reviewing User Account and Group Policy Information
Reviewing User Account and Group Policy Information
![]() Dumping and Parsing Registry Contents
Dumping and Parsing Registry Contents
• Examining Web Browsing Artifacts
• Malware Artifact Discovery and Extraction from a Live Windows System
![]() Tool Box Appendix and Web Site
Tool Box Appendix and Web Site
The “![]() ” symbol references throughout this chapter demarcate that additional utilities pertaining to the topic are discussed in the Tool Box appendix, appearing at the end of this chapter. Further tool information and updates for this chapter can be found on the companion Malware Field Guides Web site, at http://www.malwarefieldguide.com/Chapter1.html.
” symbol references throughout this chapter demarcate that additional utilities pertaining to the topic are discussed in the Tool Box appendix, appearing at the end of this chapter. Further tool information and updates for this chapter can be found on the companion Malware Field Guides Web site, at http://www.malwarefieldguide.com/Chapter1.html.
Introduction
This chapter demonstrates the value of preserving volatile and select non-volatile data, and how to do so in a forensically sound manner. The value of volatile data is not limited to process memory associated with malware, but can include passwords, Internet Protocol (IP) addresses, Security Event Log entries, and other contextual details that together can provide a more complete understanding of the malware and its use on a system.
When powered on, a subject system contains critical ephemeral information that reveals the state of the system. This volatile data is sometimes referred to as stateful information. Incident response forensics, or live response, is the process of acquiring the stateful information from the subject system while it remains powered on. As we discussed in the introductory chapter, the Order of Volatility should be considered when collecting data from a live system to ensure that critical system data is acquired before it is lost or the system is powered down. Further, because the scope of this chapter pertains to live response through the lens of a malicious code incident, the preservation techniques outlined in this section are not intended to be comprehensive or exhaustive; instead, they are intended to provide a solid foundation relating to incident response involving malware on a live system.
Often, malicious code live response is a dynamic process, with the facts and context of each incident dictating the manner and means in which the investigator will proceed with his investigation. Unlike other contexts in which simply acquiring a forensic duplicate of a subject system’s hard drive would be sufficient, investigating a malicious code incident on a subject system very often requires some degree of live response. This is because much of the information the investigator needs to identify the nature and scope of the malware infection resides in stateful information that will be lost when the computer is powered down.
This chapter provides an overall methodology for preserving volatile data on a Windows system during a malware incident, and presumes that the digital investigator already has built his live response toolkit of trusted tools, or is using a tool suite specifically designed to collect digital evidence in an automated fashion from Windows systems during incident response. There are a variety of live response tool suites available to the digital investigator—many of which are discussed in the Tool Box section at the end of this chapter. Although automated collection of digital evidence is recommend as a measure to avoid mistakes and inadvertent collection gaps, the aim of this chapter and associated appendices is to provide the digital investigator with a granular walk-through of the live response process and the digital evidence that should be collected.
![]() Analysis Tip
Analysis Tip
Field Interviews
Prior to conducting live response, gather as much information as possible about the malicious code incident and subject system(s) from relevant witnesses. Refer to the Field Interview Questions appendix at the end of this chapter for additional details.
Local versus Remote Collection
![]() Choose the manner in which data will be collected from the subject system.
Choose the manner in which data will be collected from the subject system.
• Collecting results locally means storage media will be connected to the subject system and the results will be saved onto the connected media.
• Remote collection means establishing a network connection from the subject system, typically with a netcat or cryptcat listener, and transferring the acquired system data over the network to a collection server. This method reduces system interaction, but relies on the ability to traverse the subject network through ports established by the netcat listener.
Investigative Considerations
• In some instances, the subject network will have rigid firewall and/or proxy server configurations, making it cumbersome or impractical to establish a remote collection repository.
• Remotely acquiring certain data during live response—like imaging a subject system’s physical memory—may be time and resource consuming and require several gigabytes of data to traverse the network, depending on the amount of random access memory (RAM) in the target system. The following pair of commands depicted in Figure 1.1 sends the output of a live response utility acquiring data from a subject system to a remote IP address (172.16.131.32) and saves the output in a file named “<toolname>20101020host1.txt” on the collection system.
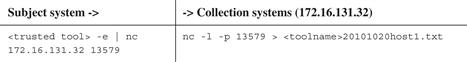
Figure 1.1 Netcat commands to establish a network listener to collect tool output remotely
• The netcat command must be executed on the collection system first so that it is ready and waiting to receive data from the subject system. ![]()
• Local collection efforts can be protracted in instances where a victim system is older and contains obsolete hardware, such as USB 1.1, which has a maximum transfer rate of 12 megabits per second (mbps).
• Always ensure that the media you are using to acquire live response data is pristine and do not contain unrelated case data, malicious code specimens, or other artifacts from previous investigations. Acquiring digital evidence on “dirty” or compromised media can taint and undermine the forensic soundness of the acquired data.
Volatile Data Collection Methodology
![]() Data should be collected from a live system in the Order of Volatility. The following guidelines give a clearer sense of the types of volatile data that can be preserved to better understand malware:
Data should be collected from a live system in the Order of Volatility. The following guidelines give a clearer sense of the types of volatile data that can be preserved to better understand malware:
• On the compromised machine, run a trusted command shell from an Incident Response toolkit
• Document system date and time, and compare them to a reliable time source
• Acquire contents of physical memory
• Gather hostname, user, and operating system details
• Gather system status and environment details
• Identify users logged onto the system
• Inspect network connections and open ports
• Examine Domain Name Service (DNS) queries and connected hostnames
• Correlate open ports to associated processes and programs
• Examine services and drivers
• Examine command-line history
• Identify mapped drives and shares
• Check for unauthorized accounts, groups, shares, and other system resources and configurations using Windows “net” commands
Preservation of Volatile Data
![]() After obtaining the system date/time, acquire physical memory from the subject system prior to preserving information using live response tools.
After obtaining the system date/time, acquire physical memory from the subject system prior to preserving information using live response tools.
• Because each version of the Windows operating system has different ways of structuring data in memory, existing tools for examining full memory captures may not be able to interpret memory structures properly in every case.
• Therefore, after capturing the full contents of memory, use an Incident Response suite to preserve information from the live system, such as lists of running processes, open files, and network connections, among other volatile data. A number of commonly used Incident Response tool suites are discussed in the Tool Box section at the end of this chapter.
• Some information in memory can be displayed by using Command-line Interface (CLI) utilities on the system under examination. This same information may not be readily accessible or easily displayed from the memory dump after it is loaded onto a forensic workstation for examination.
Investigative Considerations
• It may be necessary in some cases to capture non-volatile data from the live subject system, and perhaps even create a forensic duplicate of the entire disk. For all preserved data, remember that the Message Digest 5 (MD5) and other attributes of the output from a live examination must be documented independently by the digital investigator.
• To avoid missteps and omissions, collection of volatile data should be automated.
Physical Memory Acquisition on a Live Windows System
![]() Before gathering volatile system data using the various tools in a live response toolkit, first acquire a full memory dump from the subject system.
Before gathering volatile system data using the various tools in a live response toolkit, first acquire a full memory dump from the subject system.
• Running incident response tools on the subject system will alter the contents of memory.
• To get the most digital evidence out of physical memory, perform a full memory capture prior to running any other incident response processes.
• There are a myriad of tools that can be used to acquire physical memory, and many have similar functionality. Often, choosing a tool comes down to familiarity and preference. Given that every malware incident is unique, the right tool for the job may be driven not just by the incident type but by the victim system typology.
Investigative Considerations
• Remember that some tools are limited to certain operating systems and capture only up to 4 gigabytes (GB) of RAM; others can acquire memory from many different operating system versions, gather up to 64 GB of RAM, and capture the Windows pagefile. If possible, determine subject system details and select appropriate forensic tools prior to beginning incident response. Having numerous tool options available in your toolkit will avoid on-scene frustration.
• In addition to assessing tool limitations based upon operating system and memory capacity, also consider whether to use a command-line utility or a graphical user interface (GUI)-based tool.
• This section will explore some of the ways to acquire physical memory contents, but consult the Tool Box section at the end of this chapter for further tool discussion and comparison.
Acquiring Physical Memory Locally
![]() Physical memory dumps can be acquired locally from a subject system using command-line or GUI utilities.
Physical memory dumps can be acquired locally from a subject system using command-line or GUI utilities.
Command-line Utilities
![]() A commonly used command-line tool for physical memory acquisition is HBGary’s FastDump.1
A commonly used command-line tool for physical memory acquisition is HBGary’s FastDump.1
• FastDump Community2 version is a free version of FastDump that supports the acquisition of memory from 32-bit systems with up to 4 GB of RAM. ![]()
• FastDump Community version does not support Vista, Windows 2003, Windows 2008, or 64-bit platforms.
• Using FastDump Community version, the following command captures the contents of memory from a subject Windows system and saves it to a file on removable media (Figure 1.2):
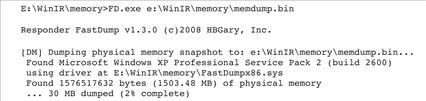
Figure 1.2 Acquiring physical memory with FastDump
• FastDump Pro3 is the commercially supported version of FastDump, which supports all versions of Window operating systems and service packs (2000, XP, 2003, Vista, 2008 Server). ![]()
![]() FastDump Pro can capture memory from both 32-bit and 64-bit systems, including systems with more than 4 GB of RAM (up to 64 GB of RAM), and supports acquisition of the Windows pagefile with the memory dump.
FastDump Pro can capture memory from both 32-bit and 64-bit systems, including systems with more than 4 GB of RAM (up to 64 GB of RAM), and supports acquisition of the Windows pagefile with the memory dump.
• Using FastDump Pro, the following command captures the contents of both memory and the pagefile from a subject Windows system and saves it to a file on removable media (Figure 1.3):

Figure 1.3 Acquiring physical memory with FastDump Pro
![]() Other Tools to Consider
Other Tools to Consider
Additional command-line utilities to capture physical memory, including Memoryze, Mantech DD and Moonsols Memory Toolkit, are discussed in the Tool Box section at the end of this chapter and on the companion Web site for the Malware Forensic Field Guide, http://www.malwarefieldguide.com/Chapter1.html.
GUI-based Memory Dumping Tools
![]() Agile Risk Management’s Nigilant324 is a GUI-based incident response tool.
Agile Risk Management’s Nigilant324 is a GUI-based incident response tool.
• Nigilant32 provides an intuitive interface and simplistic means of imaging a subject system’s physical memory using a drop-down menu in the tool’s user console.
• To image memory from Nigilant32, select the “Image Physical Memory” option from the “Tools” menu, as shown in Figure 1.4.
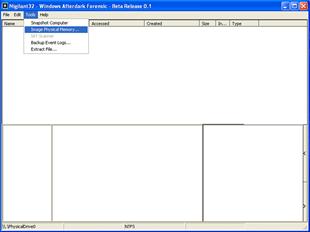
Figure 1.4 Imaging physical memory with Nigilant32
• At the prompt, select the location where the memory dump file will be saved; memory imaging will start thereafter.
Remote Physical Memory Acquisition
![]() Physical memory dumps can be remotely acquired from a subject system using F-Response.
Physical memory dumps can be remotely acquired from a subject system using F-Response.
![]() F-Response is an incident response framework that implements the Microsoft iSCSI initiator service5 to provide read-only access to the full physical disk(s) of a networked computer, as well as to the physical memory of most Microsoft Windows systems.6
F-Response is an incident response framework that implements the Microsoft iSCSI initiator service5 to provide read-only access to the full physical disk(s) of a networked computer, as well as to the physical memory of most Microsoft Windows systems.6
• There are four versions of F-Response (Field Kit, Consultant, Enterprise, and TACTICAL) that vary in deployment method, but all provide access to a remote subject system drive as a local mounted drive.
• F-Response is flexible and “vendor agnostic,” meaning that any tool can be used to acquire an image of the subject system’s hard drive and physical memory once connected to it.
• F-Response Field Kit and TACTICAL are typically used in the context of live response, particularly in scenarios where the subject systems are at a third-party location and F-Response Consultant Edition or Enterprise Edition have not been deployed prior to the incident.
• F-Response Field Kit requires a single USB key FOB dongle and the Field Kit executable (f-response-fk.exe), both of which are initiated on subject system. Conversely, the examiner system, which enables the digital investigator to leverage the results of F-Response, simply requires the installation and invocation of the Microsoft iSCSI initiator service. F-Response TACTICAL, which uses a distinguishable paired key FOB deployment, is discussed in the Tool Box section at the end of this chapter. ![]()
• To access the physical memory of the remote subject system with an F-Response Field Kit, connect the USB key FOB dongle to the subject system and execute F-Response. Enter the proper subject system identifiers, and enable “Physical Memory,” using the radio button, as shown in Figure 1.5.

Figure 1.5 Using F-Response to connect to a subject system
• On your local examiner system, invoke the iSCSI initiator service, select the “Discovery” tab, and add the subject system as a target, as shown Figure 1.6.
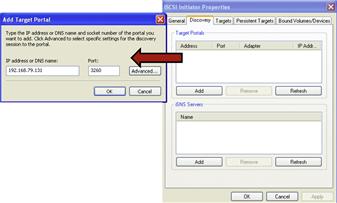
Figure 1.6 Adding the subject system as a target through the iSCSI initiator service
• Choose the “Advanced” option and provide the same username and password credentials used in the F-Response Remote Configuration (Figure 1.7).
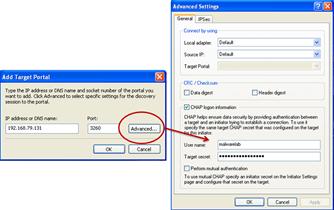
Figure 1.7 Authenticating through the iSCSI initiator to acquire the target system
• After authenticating, the subject system will appear as a target. Select the subject system hard drive and physical memory from the target list (requiring re-authentication) and connect to the subject system; the connection status will be displayed in the target list (Figure 1.8).
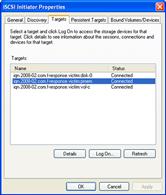
Figure 1.8 Connecting to the subject system
• Once connected to the subject system through F-Response, the subject system’s hard drive can be accessed locally on your examiner system, as shown in Figure 1.9.
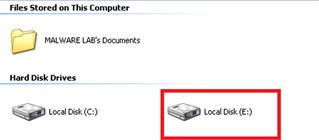
Figure 1.9 Viewing the remote subject system hard drive through F-Response
• On your local examiner system, use the Disk Management snap-in to verify that the physical memory is also “mounted.”
• As physical memory does not have a file system or partition table, the physical memory will not be recognized as a drive, but rather as an unknown disk, as shown in Figure 1.10.
![]()
Figure 1.10 Identifying physical memory from a remote subject system
• In Figure 1.11, Helix3 Pro7 was used to acquire the memory image from the remote subject system. The Helix3 Pro Live CD was initiated on the examiner system and identified the subject system’s physical memory as a local drive (PhysicalDrive2); acquisition was conducted by selecting PhysicalDrive2 as the item to image. ![]()
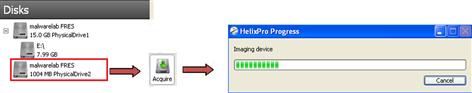
Figure 1.11 Acquiring physical memory from a remote subject system
![]() Other Tools to Consider
Other Tools to Consider
Commercial remote forensics tools such as ProDiscoverIR and OnlineDFS have been developed to capture full memory contents from remote systems. These, and other remote forensics tools, are discussed further in the Tool Box section at the end of this chapter and on the companion Web site, http://www.malwarefieldguide.com/Chapter1.html.
Collecting Subject System Details
![]() System details are helpful for providing context to the live response and post-mortem forensic process, establishing an investigative time line, and identifying the subject system in logs and other forensic artifacts.
System details are helpful for providing context to the live response and post-mortem forensic process, establishing an investigative time line, and identifying the subject system in logs and other forensic artifacts.
![]() Obtain the following subject system details:
Obtain the following subject system details:
System Date and Time
![]() After acquiring an image of the physical memory from a subject system, the first and last items that should be collected during the course of conducting a live response examination are the system date and time. This information will serve both as the basis of your investigative time line—providing context to your analysis of the system—as well as documentation of the examination.
After acquiring an image of the physical memory from a subject system, the first and last items that should be collected during the course of conducting a live response examination are the system date and time. This information will serve both as the basis of your investigative time line—providing context to your analysis of the system—as well as documentation of the examination.
• The most common method to collect system date and time is to issue the date /t and time /t commands from a trusted command shell in your live response toolkit.
• After recording the date and time from the subject system, compare them to a reliable time source to verify the accuracy of the information.
• Identify and document any discrepancies for comparison to the date and time stamps of other artifacts you discover on the system.
System Identifiers
![]() In addition to collecting the system date and time, collect as much system identification and status information from the subject host as possible prior to launching into live response examination, including:
In addition to collecting the system date and time, collect as much system identification and status information from the subject host as possible prior to launching into live response examination, including:
| System Identifier | Tool/Command |
| Host Name | Identify the name of the subject system by using a trusted version of the hostname utility, which is native to Windows operating systems. |
| Current User | Identify the current system user with the whoami8 command |
| Operating System/Environment | Collect system environment identifiers by issuing the ver9 command. |
| IP address and related network identifiers | The ipconfig/all command is used to display the IP address assigned to the subject system, along with the system hostname, network subnet mask, DNS servers, and related details. |
Network Configuration
![]() When documenting the configuration of the subject system, keep an eye open for unusual items.
When documenting the configuration of the subject system, keep an eye open for unusual items.
• Look for a Virtual Private Network (VPN) adapter configured on a system that does not legitimately use a VPN.
• Determine whether a network card of the subject system is in promiscuous mode, which generally indicates that a sniffer is running.
• Several tools are available to query a network configuration, including promiscdetect10 and Microsoft’s promqry11 (which requires the .NET framework).
Enabled Protocols
![]() Document which protocols are enabled on the subject system to help identify potential vectors of attack.
Document which protocols are enabled on the subject system to help identify potential vectors of attack.
• Identify the protocols enabled on the subject system using the URLProtocolView utility from NirSoft.12
System Uptime
![]() Determine how long the subject system has been running, or the system uptime.
Determine how long the subject system has been running, or the system uptime.
• Knowing that the subject system has not been rebooted since malware was installed can be important, motivating digital investigators to look more closely for deleted processes and other information in memory that otherwise might have been destroyed.
• To determine system uptime, invoke the uptime13 utility from your trusted toolkit, as shown in Figure 1.12.
![]()
Figure 1.12 Querying a system with the uptime command
System Environment
![]() Documenting general details about the subject system, including operating system version, patch level, and hardware, is useful when conducting an investigation of a Windows system.
Documenting general details about the subject system, including operating system version, patch level, and hardware, is useful when conducting an investigation of a Windows system.
• System environment information may reveal that the system is outdated and therefore susceptible to certain attacks.
• Knowing the version of Windows can be helpful when performing forensic examination of a memory dump.
• A granular snapshot of a subject system’s environment and status can be obtained by querying the system with psinfo,14 as shown in Figure 1.13 on the next page. ![]()

Figure 1.13 Collecting system information with psinfo
Identifying Users Logged into the System
![]() After conducting initial reconnaissance of the subject system details, identify the users logged onto the subject system both locally and remotely.
After conducting initial reconnaissance of the subject system details, identify the users logged onto the subject system both locally and remotely.
![]() Identifying logged on users serves a number of investigative purposes, such as to:
Identifying logged on users serves a number of investigative purposes, such as to:
• Help discover any potential intruders logged into the compromised system.
• Identify additional compromised systems that report to the subject system as a result of the malicious code incident.
• Provide insight into a malicious insider malware incident.
• Provide additional investigative context by being correlated with other artifacts discovered.
• Obtain the following information about identified users logged onto the subject system:
![]() There are a number of utilities that can be deployed during live response to identify users logged onto a subject system, including PsLoggedOn,15
quser,16
netusers,17 and loggonsessions.18
There are a number of utilities that can be deployed during live response to identify users logged onto a subject system, including PsLoggedOn,15
quser,16
netusers,17 and loggonsessions.18
![]()
![]() Psloggedon is a CLI utility that is included in the PsTools suite that identifies users logged onto a subject system both locally and remotely. In addition, PsLoggedOn reveals users that have accessed a subject system from resource shares, such as shared drives.
Psloggedon is a CLI utility that is included in the PsTools suite that identifies users logged onto a subject system both locally and remotely. In addition, PsLoggedOn reveals users that have accessed a subject system from resource shares, such as shared drives.
Inspect Network Connections and Activity
![]() Network connections and activity on the subject system can reveal vital information about an attacker’s connection to the system, including the location of an attacker’s remote data collection server and whether the subject system is beaconing to a command and control structure, among other things.
Network connections and activity on the subject system can reveal vital information about an attacker’s connection to the system, including the location of an attacker’s remote data collection server and whether the subject system is beaconing to a command and control structure, among other things.
![]() In surveying a potentially infected and compromised system, try to obtain the following information about the network activity on the subject system:
In surveying a potentially infected and compromised system, try to obtain the following information about the network activity on the subject system:
Active Network Connections
![]() An investigator should identify current and recent network connections to determine (1) whether an attacker is currently connected to the subject system, and (2) if malware on the subject system is causing the system to call out, or “phone home,” to the attacker, such as to join a botnet command and control structure.
An investigator should identify current and recent network connections to determine (1) whether an attacker is currently connected to the subject system, and (2) if malware on the subject system is causing the system to call out, or “phone home,” to the attacker, such as to join a botnet command and control structure.
• Often, malicious code specimens such as bots, worms, and Trojans have instructions embedded in them to call out to a location on the Internet, whether a domain name, Uniform Resource Locator (URL), or IP address, or to connect to another Web resource to join a collection of other compromised and “hijacked” systems and await further commands from the attacker responsible for the infection.
• To examine current network connections, a common approach is to use a trusted version of the netstat19 utility on the subject system. Netstat is a utility native to the various Windows operating systems that displays information pertaining to established and “listening” network socket connections on the subject system. ![]()
• For granularity of results, query with the netstat –ano command (available on Microsoft Windows XP and subsequent versions; see Figure 1.14), which along with displaying the nature of the connections on the subject system, reveals:
![]() Whether the session is Transmission Control Protocol (TCP) or UDP protocol
Whether the session is Transmission Control Protocol (TCP) or UDP protocol
![]() The address of connected foreign system(s)
The address of connected foreign system(s)
![]() The process ID number of the process initiating the network connection
The process ID number of the process initiating the network connection

Figure 1.14 Netstat –ano command
• Alternatively, the netstat –an command reveals the same information but without the process ID associated with the connection.
DNS Queries from the Host System
![]() Many malware specimens have network connectivity capabilities, whether to gather further exploits from a remote location, join a command and control structure, or await further commands from an attacker. Many times, the malware is hard coded with connectivity instructions in the form of domain names, which the program will attempt to query and resolve to identify the location of the network-based resource to which it is intended to connect.
Many malware specimens have network connectivity capabilities, whether to gather further exploits from a remote location, join a command and control structure, or await further commands from an attacker. Many times, the malware is hard coded with connectivity instructions in the form of domain names, which the program will attempt to query and resolve to identify the location of the network-based resource to which it is intended to connect.
NetBIOS Connections
![]() When native Windows networking is involved, additional details about active network connections may be available that can be useful in an investigation. There may be volatile data showing which computers were recently connected to the subject system and what files were transferred.
When native Windows networking is involved, additional details about active network connections may be available that can be useful in an investigation. There may be volatile data showing which computers were recently connected to the subject system and what files were transferred.
• Windows networking uses the NetBIOS protocol, which supports a variety of services, such as file and printer sharing.
• Each computer that is configured with NetBIOS is assigned a unique name used to communicate with others.
• The NetBIOS name cache on a subject system is a section in system memory that contains a mapping of NetBIOS names and IP addresses of other computers with which the subject system has had NetBIOS communication.20
• The NetBIOS name cache is volatile and is preserved for a limited period of time.
• Capture the NetBIOS name cache using a trusted version of the native Windows utility, nbtstat with the –c option, which displays a list of cached remote machine names and their corresponding IP addresses.21
![]()
• Identify current NetBIOS sessions by using the nbtstat –S option and the net sessions command. ![]()
• Identify if any files were recently transferred over NetBIOS using the net file command. ![]()
ARP Cache
![]() The Address Resolution Protocol (ARP) resolves Media Access Control (MAC) addresses or Ethernet addresses (residing at the Data Link Layer in the Open Systems Interconnect (OSI) model) to IP addresses (residing at the Network Layer of the OSI model).22
The Address Resolution Protocol (ARP) resolves Media Access Control (MAC) addresses or Ethernet addresses (residing at the Data Link Layer in the Open Systems Interconnect (OSI) model) to IP addresses (residing at the Network Layer of the OSI model).22
• The mapping of these addresses is stored in a table in memory called the ARP cache or ARP table.
• Examination of a subject system’s ARP cache will identify other systems that currently or recently have established a connection to the subject system.
• To display the contents of the ARP cache, issue the arp –a command23 from your trusted command shell, which will reveal the IP address assigned to the subject system, along with the IP addresses and MAC addresses assigned to suspicious systems that are currently or have recently had connections to the subject system. ![]()
Collecting Process Information
![]() Collecting information relating to processes running on a subject system is essential in malicious code live response forensics. Once executed, malware specimens, such as worms, viruses, bots, key loggers, and Trojans, often manifest on the subject system as a process.
Collecting information relating to processes running on a subject system is essential in malicious code live response forensics. Once executed, malware specimens, such as worms, viruses, bots, key loggers, and Trojans, often manifest on the subject system as a process.
![]() During live response, collect certain information pertaining to each running process to gain process context, or a full perspective about the process and how it relates to the system state and to other artifacts collected from the system. To gain the broadest perspective, a number of tools gather valuable details relating to processes running on a subject system. Although this chapter covers some of these tools, refer to the Tool Box section at the end of this chapter and on the companion Web site, http://www.malwarefieldguide.com/Chapter1.html, for additional tool options.
During live response, collect certain information pertaining to each running process to gain process context, or a full perspective about the process and how it relates to the system state and to other artifacts collected from the system. To gain the broadest perspective, a number of tools gather valuable details relating to processes running on a subject system. Although this chapter covers some of these tools, refer to the Tool Box section at the end of this chapter and on the companion Web site, http://www.malwarefieldguide.com/Chapter1.html, for additional tool options. ![]()
• Start by collecting basic process information, such as the process name and Process Identification (PID), with subsequent queries to obtain the following details:
Process Name and Process Identification
![]() The first step in gaining process context is identifying the running processes, typically by name and associated PID.
The first step in gaining process context is identifying the running processes, typically by name and associated PID.
• To collect a simple list of running processes and assigned PIDs from our subject system, use tlist,24 a multifunctional process viewer utility for Windows distributed with Debugging Tools for Windows.
Temporal Context
![]() To gain historical context about the process, determine the period of time the process has been running.
To gain historical context about the process, determine the period of time the process has been running.
Memory Usage
![]() Examine the amount of system resources that processes are consuming. Often, worms, bots, and other network-centric malware specimens are “active” and can be noticeably resource-consuming, particularly on a system with less than 2 GB of RAM.
Examine the amount of system resources that processes are consuming. Often, worms, bots, and other network-centric malware specimens are “active” and can be noticeably resource-consuming, particularly on a system with less than 2 GB of RAM.
• To get output identifying running processes, associated PIDs, and the respective memory usage of the processes, use a trusted version of the tasklist utility with no switches.25
![]()
Process to Executable Program Mapping: Full System Path to Executable File
![]() Determine where the executable images associated with the respective processes reside on the system. This effort will provide further contextual information, including whether an unknown or suspicious program spawned the process, or if the associated program is embedded in an anomalous location on the system, necessitating a deeper investigation of the program.
Determine where the executable images associated with the respective processes reside on the system. This effort will provide further contextual information, including whether an unknown or suspicious program spawned the process, or if the associated program is embedded in an anomalous location on the system, necessitating a deeper investigation of the program.
• To get an overview of the running processes and associated location of executable program locations, use PRCView (pv.exe)26 with the -e switch, as shown in Figure 1.15.
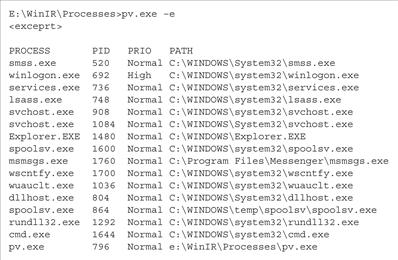
Figure 1.15 Using PRCView to reveal the location of executables associated with running processes
Process to User Mapping
![]() During the course of identifying the executable program that initiated a process, determine the owner of the process to gain user and security context relating to the process. Anomalous system users or escalated user privileges associated with running processes are often indicative of a rogue process.
During the course of identifying the executable program that initiated a process, determine the owner of the process to gain user and security context relating to the process. Anomalous system users or escalated user privileges associated with running processes are often indicative of a rogue process.
Child Processes
![]() Often upon execution, malware spawns additional processes, or child processes. Upon identifying a potentially hostile process during live response, analyze the running processes in such a way as to identify the hierarchy of potential parent and child processes.
Often upon execution, malware spawns additional processes, or child processes. Upon identifying a potentially hostile process during live response, analyze the running processes in such a way as to identify the hierarchy of potential parent and child processes.
• Query the subject system with any of the following commands to obtain a structured and hierarchical “tree” view of processes.
| Tool | Command |
| Pslist | pslist –t |
| Tlist | tlist –t |
| PRCView | pv –t |
Command-line Parameters
![]() While inspecting running processes on a system, determine the command-line instructions, if any, that were issued to initiate the running processes. Identifying command-line parameters is particularly useful if a rogue process already has been identified, or if further information about how the program operates is sought.
While inspecting running processes on a system, determine the command-line instructions, if any, that were issued to initiate the running processes. Identifying command-line parameters is particularly useful if a rogue process already has been identified, or if further information about how the program operates is sought.
• The command-line arguments associated with target processes can be collected by querying a subject system with any of the following commands.
| Tool | Command |
| Cmdline | Invoking cmdline with no switches displays the process ID number, the full system path, and the executable file associated with each process running on the system. By issuing the –pid argument and supplying the PID number of a specific process of interest, cmdline will only display information relating to that process. |
| Tlist | tlist –c |
| PRCView | pv –l |
File Handles
![]() Another important aspect to examining running processes is to identify handles opened by the respective processes. System resources like files, threads, or graphic images are data structures commonly referred to as objects. Often, programs cannot directly access object data and must rely upon an object handle to do so.
Another important aspect to examining running processes is to identify handles opened by the respective processes. System resources like files, threads, or graphic images are data structures commonly referred to as objects. Often, programs cannot directly access object data and must rely upon an object handle to do so.
• Each handle has an entry in an internally maintained handle table containing the addresses of the resources and the means to identify the resource type.
• To get additional context about the nature of running processes, obtain information about which handles and associated resources the processes are accessing by using the handle27 utility.
• The handle utility has a number of switches that can be applied, but for the purpose of revealing all handles related to the running processes, use the handle –a command.
Dependencies Loaded by Running Processes
![]() Dynamically linked executable programs are dependent upon shared libraries to successfully run. In Windows programs, these dependencies are most often Dynamic Link Libraries (DLLs) that are imported from the host operating system during execution. Identifying and understanding the DLLs invoked by a suspicious process can potentially define the nature and purpose of the process.
Dynamically linked executable programs are dependent upon shared libraries to successfully run. In Windows programs, these dependencies are most often Dynamic Link Libraries (DLLs) that are imported from the host operating system during execution. Identifying and understanding the DLLs invoked by a suspicious process can potentially define the nature and purpose of the process.
• Many malicious code specimens, particularly rootkits, use a technique called “DLL injection,” wherein malware “injects” code into the address space of a running process by forcing it to load a dynamic link library.28
• A great utility for viewing the DLLs loaded by a running process is listdlls,29 which identifies the modules invoked by a process and reveals the full path to the respective modules. Other utilities to consider for this task include Procinterrogate,30 PRCView,31 and ListModules.32
![]()
Exported DLLs
![]() To discover the DLLs exported by an executable program that launched a process—that is, identifying the functions or variables made usable by other executable programs—consider querying a subject system with NirSoft’s DLLExportViewer.33
To discover the DLLs exported by an executable program that launched a process—that is, identifying the functions or variables made usable by other executable programs—consider querying a subject system with NirSoft’s DLLExportViewer.33
Capturing the Memory Contents of a Process on a Live Windows System
![]() During the course of examining running processes on a subject system, potentially rogue processes may be identified. In addition to locating and documenting the potentially hostile executable programs, capture the individual process memory contents of the specific processes for later analysis, as described in Chapter 2.
During the course of examining running processes on a subject system, potentially rogue processes may be identified. In addition to locating and documenting the potentially hostile executable programs, capture the individual process memory contents of the specific processes for later analysis, as described in Chapter 2.
Correlate Open Ports with Running Processes and Programs
![]() In addition to identifying the open ports and running processes on a subject system, determine the executable program that initiated a suspicious established connection or listening port, and determine where that program resides on the system.
In addition to identifying the open ports and running processes on a subject system, determine the executable program that initiated a suspicious established connection or listening port, and determine where that program resides on the system.
![]() Examining open ports apart from active network connections is often inextricably intertwined with discoveries made during inspection of running processes on a subject system.
Examining open ports apart from active network connections is often inextricably intertwined with discoveries made during inspection of running processes on a subject system.
• When examining active ports on a subject system, gather the following information, if available:
• Process-to-port correlation can be conducted by querying a subject system with any of the following commands. Further details regarding the tools referenced in this table can be found in the Tool Box section at the end of the chapter and on the companion Web site, http://www.malwarefieldguide.com/Chapter1.html. ![]()
| Tool | Command | Information Gathered |
| Netstat | netstat -ano netstat –anb [the “b” option requires escalation (i.e. Run As Administrator)] | Displays protocol, status of connection, foreign address in connection, PID of process initiating connection. When investigating Windows XP (SP2) and newer Windows operating systems, this command correlates open ports with associated processes and displays the executable program and related components sequentially involved in creating each connection or listening port, as shown in Figure 1.16, below. |
| Openports | -lines and -path | Provides a clear structured perspective of the active ports associated process and executable programs along with the system path where the respective programs reside. |
| Fport | /p /a /i /ap |
Sort by port Sort by process Sort by PID Sort by process path |
| CurrPorts | /stext | Provides a detailed snapshot of the process name, PID, local and remote port numbers and IP addresses, port state, protocol, executable program path, and other detailed identifying information. |

Figure 1.16 Results of the netstat –anb command on a subject system
Identifying Services and Drivers
![]() Many malware specimens will manifest on a subject system as a service or surreptitiously install driver files.
Many malware specimens will manifest on a subject system as a service or surreptitiously install driver files.
Examining Running Services
![]() Microsoft Windows services are long-running executable applications that run in their own Windows sessions; they do not require user initiation or interaction.34 Services can be configured to automatically start when a computer is booted up, paused, and restarted without showing up in any user interface. Malware can manifest on a victim system as a service, silently running in the background, unbeknownst to the user.
Microsoft Windows services are long-running executable applications that run in their own Windows sessions; they do not require user initiation or interaction.34 Services can be configured to automatically start when a computer is booted up, paused, and restarted without showing up in any user interface. Malware can manifest on a victim system as a service, silently running in the background, unbeknownst to the user.
• As with the examination of running processes and ports, explore running services by first gaining an overview and then applying tools to extract information about the services with more particularity.
• While investigating running services, gather the following information:
• Gain a good overview of the running services on a subject system by using a trusted version of tasklist with the /svc switch, which displays services in each process.
• The output from this command provides a concise listing of the executable program name, PID, and description of the service, if applicable.
• To gather greater detail about running services, refer to the Tool Box section at the end of this chapter and on the companion Web site, http://www.malwarefieldguide.com/Chapter1.html. ![]()
Examining Installed Drivers
![]() In addition to determining the running services on a subject system, consider examining the installed drivers on the system, including the nature and status of the drivers.35
In addition to determining the running services on a subject system, consider examining the installed drivers on the system, including the nature and status of the drivers.35
• To explore installed system drivers, query the subject system with a trusted version of List Loaded Driver (drivers.exe)36 and DriverView.37
![]()
• The output provided by List Loaded Drivers (drivers.exe) is verbose and granular. Compare a thorough examination of any suspicious files acquired from the subject system against the collected data to identify artifacts of value.
Determining Open Files
![]() Open files may identify the nature of the malicious code that has infected a system by revealing the services or resources that the specimen requires to effectively launch or operate.
Open files may identify the nature of the malicious code that has infected a system by revealing the services or resources that the specimen requires to effectively launch or operate.
• Open files may reveal other correlating or identifying information about suspicious processes identified during the course of live response.
• If malware has given the attacker access into the compromised system, the attacker, during the course of intrusion, may have opened certain files.
• Identifying open files may explain the purpose of the attack, whether probing financial databases, sensitive corporate information, or other unique resources on the system.
Identifying Files Opened Locally
• To examine files opened locally, query the subject system with OpenFilesView.38
![]()
• OpenedFilesView displays a list of all opened files on a subject system and additional information about the accessed files, such as:
Identifying Files Opened Remotely
• A remote connection from an anomalous system or share accessing files on the subject system are potentially indicia of compromise, so endeavor to identify files that are accessed remotely.
• Query the subject system with a trusted version of the native net file command or the psfile utility.39
Collecting Command History
![]() Keystrokes typed by an attacker (or nefarious insider) into a Windows command prompt that remains open can be retrieved during live response.
Keystrokes typed by an attacker (or nefarious insider) into a Windows command prompt that remains open can be retrieved during live response.
• Display all of the commands that are stored in memory by issuing the doskey/history40 command from the toolkit’s trusted command prompt.
• The doskey/history command can be configured to hold a maximum of approximately 61,900 bytes of data.
• Command prompt history can provide valuable contextual evidentiary information, such as:
Identifying Shares
![]() Although malicious code does not always exhibit the ability to propagate through network shares, some specimens identify and affect shares on an infected system.41
Although malicious code does not always exhibit the ability to propagate through network shares, some specimens identify and affect shares on an infected system.41
• To query a subject system to identify available shares, use a trusted version of the native Windows utility, net, as seen in Figure 1.17.
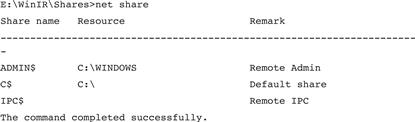
Figure 1.17 Identifying shares on a subject system
Determining Scheduled Tasks
![]() Some malicious code variants are “event-driven,” meaning that until a certain date or event triggers execution, the malware remains dormant.
Some malicious code variants are “event-driven,” meaning that until a certain date or event triggers execution, the malware remains dormant.
![]() Event-driven malware is typically referred to as a logic bomb. Typically, most logic bomb malware specimens are planted and secreted by a malicious insider, particularly by those users with administrative access to systems.42 However, some external malicious code threats have displayed logic bomb features.43 Thus, examine a subject system for scheduled tasks to ensure that a malicious program is not hidden away waiting to execute.
Event-driven malware is typically referred to as a logic bomb. Typically, most logic bomb malware specimens are planted and secreted by a malicious insider, particularly by those users with administrative access to systems.42 However, some external malicious code threats have displayed logic bomb features.43 Thus, examine a subject system for scheduled tasks to ensure that a malicious program is not hidden away waiting to execute.
Collecting Clipboard Contents
![]() In the instance of a potentially compromised system wherein the infection vector is unknown, the clipboard contents can potentially provide substantial clues into the nature of an attack, particularly if the attacker is an insider “threat” and has copied bits of text to paste into tools or attack strings.
In the instance of a potentially compromised system wherein the infection vector is unknown, the clipboard contents can potentially provide substantial clues into the nature of an attack, particularly if the attacker is an insider “threat” and has copied bits of text to paste into tools or attack strings.
• The clipboard contents may contain:
![]() Instant messenger chat or e-mail content excerpts
Instant messenger chat or e-mail content excerpts
![]() Other valuable artifacts identifying the means or purpose of the attack
Other valuable artifacts identifying the means or purpose of the attack
• Examine the contents of a subject system’s clipboard with pclip,46 which collects and displays the contents of the clipboard, seen here in Figure 1.18. ![]()
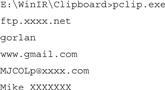
Figure 1.18 Exploring the clipboard contents with pclip.exe
Non-Volatile Data Collection from a Live Windows System
Traditionally, forensic examiners do not access files on the hard drive of a live system because of the potential risk of altering stored data. However, some situations require selective forensic preservation and examination of data in files and within the registry of live systems. In some cases, the quantity of non-volatile data on a computer’s system is so large that its preservation is not feasible.
Expending resources to create a forensic duplicate of a server that contains terabytes of documents and other data unrelated to the malware incident may not make sense. Instead, acquiring only the information that is generally the most relevant and useful may be the better approach. Similarly, in cases involving a large number of computers, forensic duplication of only critical systems coupled with information gathering from the remaining machines may best support the victim’s needs or ability to pursue legal or other remedies.
![]() Analysis Tip
Analysis Tip
Handle with Care
Whether to collect non-volatile data from a live system must be carefully considered. Operating a live system inevitably makes changes, like updating last accessed dates of files. Whether such changes will hinder the investigation or alternatively be deemed an acceptable loss of information for the benefit of acquiring usable digital evidence is a judgment call. In certain cases, the only option may be to collect non-volatile data from a live system. From a business interference standpoint, the system owner may be unable to accept actions that would disrupt the system (i.e., transaction server processing thousands of credit card transactions a minute). In such cases, obtain written confirmation of authorization to perform actions that could result in a reboot, temporary loss of service, or other perceived disruption. Once the decision is made to perform preservation processes on a live system, take great care to minimize changes and thoroughly document actions taken to both distinguish them from the effects of malware and defend them in court, if necessary.
Forensic Duplication of Storage Media on a Live Windows System
![]() When dealing with high availability servers and other systems that cannot be shut down, create a forensic duplicate of the entire system while the computer is still running.
When dealing with high availability servers and other systems that cannot be shut down, create a forensic duplicate of the entire system while the computer is still running.
![]() The same approaches to preserving physical memory on a live system can be used to acquire a forensic duplicate of any storage media connected to the system.
The same approaches to preserving physical memory on a live system can be used to acquire a forensic duplicate of any storage media connected to the system.
• The following command takes the contents of an internal hard drive and saves it to a file on removable media along with the MD5 hash (for integrity/validation purposes) and an audit log that documents the collection process (Figure 1.19).

Figure 1.19 Forensic duplication of a hard drive using dd
Investigative Considerations
• Saving a forensic duplicate of the hard drive in a live system onto another computer on the local area network is generally faster than saving to removable media, depending on the throughput.
• Save the forensic duplicate on a remote computer either via an SMB share on the remote system or using the netcat command. Remote forensic tools such as EnCase Enterprise, OnlineDFS, and ProDiscoverIR also have the capability of acquiring a forensic duplicate of the hard drive from a remote system. ![]()
Forensic Preservation of Select Data on a Live Windows System
![]() Certain areas of a live Windows computer commonly contain information about the installation and operation of malware.
Certain areas of a live Windows computer commonly contain information about the installation and operation of malware.
![]() Methodical approaches to extracting evidence from these areas are presented in the following list. These approaches are not intended to be comprehensive or exhaustive, but rather provide a solid foundation for the discovery of evidence relating to malware resident on a live Windows computer.
Methodical approaches to extracting evidence from these areas are presented in the following list. These approaches are not intended to be comprehensive or exhaustive, but rather provide a solid foundation for the discovery of evidence relating to malware resident on a live Windows computer.
• When more extensive forensic analysis is required, such as hash analysis and keyword searching, work should be performed on a forensic image, as discussed in Chapter 3. Although the tools covered in this section are designed to run on live Windows systems, some also are useful in post-mortem analysis.
• The following non-volatile data analysis can aid in understanding the malware:
Assess Security Configuration
![]() Determining whether a system was well secured can help assess the risk level of the host to misuse, vulnerabilities, and possible vectors of attack.
Determining whether a system was well secured can help assess the risk level of the host to misuse, vulnerabilities, and possible vectors of attack.
• Collect patch level and version information for a Windows system using the WinUpdatesList utility.47
• Logging level and access control lists can be extracted using auditpol48 and dumpsec.49
![]()
• If security logging is not enabled, there will most likely be no log entries in the Security Event Log.
• When a system is configured to record security events but the Security Event Log is empty, ascertain whether the logs are stored elsewhere or were intentionally cleared.
Assess Trusted Host Relationships
![]() Preserve the files in “%windir%system32driversetc” that contain information about trusted hosts and networks.
Preserve the files in “%windir%system32driversetc” that contain information about trusted hosts and networks.
![]() These files are used for localized name resolution, without relying on DNS.
These files are used for localized name resolution, without relying on DNS.
• The “hosts” file contains associations between IP addresses and hostnames.
• The “networks” file contains associations between ranges of IP addresses and network names, which are generally assigned by network administrators.
• The “lmhosts” file contains associations between the IP address and NetBIOS names.
As shown in Figure 1.20, the contents of these files can be displayed without modification and saved into individual log files using a trusted version of the Windows type command.

Figure 1.20 Collecting hosts, networks, and lmhosts from a subject system
Inspect Prefetch Files
![]() To improve efficiency when a program is executed, the Windows operating system creates a “prefetch” file that enables speedier subsequent access to the program.
To improve efficiency when a program is executed, the Windows operating system creates a “prefetch” file that enables speedier subsequent access to the program.
![]() Anomalous prefetch files are potential artifacts evidencing compromise of the subject system.
Anomalous prefetch files are potential artifacts evidencing compromise of the subject system.
• Prefetch files are located in “%systemroot%Prefetch” and, among other information, contain the name of the program when it was executed.
• The creation date of a particular prefetch file generally shows when the associated program was first executed on the system, and the last modified date indicates when it was most recently executed. ![]()
• To document the creation and last modified dates of files in the prefetch directory, use a trusted command shell (cmd.exe) to invoke the following commands (see Figure 1.21):

Figure 1.21 Listing prefetch files from a trusted command shell
Inspect Auto-starting Locations
![]() When a system is rebooted, the number of places where Windows automatically starts programs serve as persistence mechanisms for malware.
When a system is rebooted, the number of places where Windows automatically starts programs serve as persistence mechanisms for malware.
![]() These auto-starting locations exist in particular folders, registry keys, system files, and other areas of the operating system.
These auto-starting locations exist in particular folders, registry keys, system files, and other areas of the operating system.
• References to malware embed in these auto-starting locations to increase the malware’s longevity on a computer.
• One of the most effective tools for viewing auto-start locations is AutoRuns,50 which has both GUI and command-line versions (autorunsc).
• Query a subject system for all auto-starting entries using the autorunsc –a command. ![]()
• AutoRuns has a feature to ignore legitimate, signed Microsoft items, reducing the volume of output.
Investigative Considerations
• Be aware that there will generally be a large number of legitimate third-party programs in auto-start locations. Inspect most, or all, of these executables to best identify the extent of the malware on the system (see Figure 1.22).
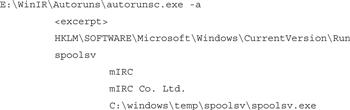
Figure 1.22 AutoRuns discovering a suspect program
Collect Event Logs
![]() Many activities related to a malware incident can generate entries in the Event Logs on a Windows system.
Many activities related to a malware incident can generate entries in the Event Logs on a Windows system.
![]() Look for failed logon attempts recorded in the Security Event Log and anti-virus warning messages recorded in the Application Event Log.
Look for failed logon attempts recorded in the Security Event Log and anti-virus warning messages recorded in the Application Event Log.
• These logs are stored in a proprietary Microsoft format; extract them in American Standard Code for Information Interchange (ASCII) text form for examination using log analysis tools that do not support the native Event Log format.
• Collecting these logs from the live system will extract the native message strings from that system.
• These logs can be collected using eldump, a utility specifically designed to process Event Logs from Windows systems. The same utility also can be used to read saved Event Log files.51
• As shown in Figure 1.23, to collect specific event logs from a subject system with eldump use the –l switch and the name of the log (security, system, or application). ![]()
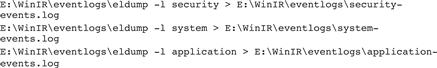
Figure 1.23 Collecting Event View Logs with eldump.exe
Logon and Logoff Events
![]() To obtain a list of logon and logoff events associated with associated users, use the NTlast utility.52
To obtain a list of logon and logoff events associated with associated users, use the NTlast utility.52
Review User Account and Group Policy Information
![]() A close inspection of user accounts local to the compromised system, or domain accounts used to log in, can reveal how malware was placed on the computer.
A close inspection of user accounts local to the compromised system, or domain accounts used to log in, can reveal how malware was placed on the computer.
![]() Look for the unauthorized creation of new accounts, accounts with no passwords, or existing accounts added to Administrator groups.
Look for the unauthorized creation of new accounts, accounts with no passwords, or existing accounts added to Administrator groups.
Examine the File System
![]() A quick review of certain types of files can reveal relevant information and provide additional context to collected volatile data.
A quick review of certain types of files can reveal relevant information and provide additional context to collected volatile data.
![]() Identify hidden files, alternate data streams, and files in the Recycle Bin.
Identify hidden files, alternate data streams, and files in the Recycle Bin.
• The HFind and SFind53 utilities in the Forensic Toolkit from Foundstone can be used to locate alternate data streams and files that are hidden from the general user by the operating system and can be listed using HFind. ![]()
• A list of files that have been placed in the Recycle Bin can be obtained by reading the INFO file using a tool like Foundstone’s rifiuti.54
Investigative Considerations
• Also consider acquiring file system metadata relating to file time stamps for additional temporal context.
![]() When the time frame of the malware incident is known, metadata for all files created, modified, or accessed during that period can be obtained using the macmatch.exe55 utility.
When the time frame of the malware incident is known, metadata for all files created, modified, or accessed during that period can be obtained using the macmatch.exe55 utility.
![]() For instance, the following command (Figure 1.24) lists all files created between March 26 and 28 in 2010.
For instance, the following command (Figure 1.24) lists all files created between March 26 and 28 in 2010.
![]()
Figure 1.24 Using macmatch.exe
Dumping and Parsing Registry Contents
![]() Although there are tools for examining Registry files in their native format, extracting the contents in ASCII text form can facilitate examination and searching.
Although there are tools for examining Registry files in their native format, extracting the contents in ASCII text form can facilitate examination and searching.
![]() There are several tools for extracting information from the Registry on a live system, such as the native Windows utilities reg.exe and, regdump.exe,56 and the Systemtools.com
dumpreg57 utility.
There are several tools for extracting information from the Registry on a live system, such as the native Windows utilities reg.exe and, regdump.exe,56 and the Systemtools.com
dumpreg57 utility. ![]()
• In addition to dumping the entire Registry contents to a text file, particular areas of interest can be processed individually.
• Details about the Universal Serial Bus (USB) devices that have been plugged into the system can be extracted from the Registry with USBView.58 This information may be particularly valuable in the instance of a malicious insider, wherein the infection vector was from a physical access to a system, such as a USB device. Alternately, a user may have inadvertently used a USB device infected with malware that exploits Windows autorun functionality.59
• Examination of the Registry is covered in more depth in Chapter 3 in the context of a full post-mortem forensic examination of a compromised system.
Remote Registry Analysis
![]() Registry contents can be acquired from a live subject system remotely with F-Response.
Registry contents can be acquired from a live subject system remotely with F-Response.
![]() As a discussed earlier in this chapter, F-Response provides read-only access to the full physical disk(s) of a networked computer, as well as the physical memory of most Microsoft Windows systems.
As a discussed earlier in this chapter, F-Response provides read-only access to the full physical disk(s) of a networked computer, as well as the physical memory of most Microsoft Windows systems.
• To access the Registry of a remote subject system with an F-Response Field Kit, initiate F-Response on the system, as shown in Figure 1.25.

Figure 1.25 Using F-Response to connect to a subject system
• On your examiner system, invoke the iSCSI initiator service and select the “Discovery” tab to add the subject system as a target, as shown Figure 1.26.
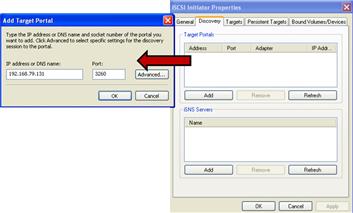
Figure 1.26 Adding the subject system as a target through the iSCSI initiator service
• Choose the “Advanced” option and provide the same username and password credentials used in the F-Response Remote Configuration (Figure 1.27).

Figure 1.27 Authenticating through the iSCSI initiator to acquire the target system
• After authenticating, the subject system will appear as a target. Select the subject system from the target list (requiring re-authentication) and connect to the subject system; the connection status will be displayed in the target list (Figure 1.28).

Figure 1.28 Connecting to the subject system
• Once connected to the subject system F-Response, the subject system’s hard drive can be accessed locally on your examiner system, as shown in Figure 1.29.

Figure 1.29 Remote subject system hard drive through F-Response
• On your local analysis system, invoke RegRipper,60 a Windows Registry data extraction and correlation tool created and maintained by Harlan Carvey. As F-Response has made the subject system drive accessible locally, RegRipper can be pointed at the target NTUSER.dat file of the subject system for data extraction (Figure 1.30).
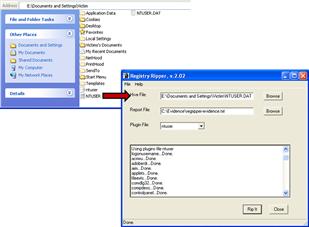
Figure 1.30 Selecting the target NTUSER.dat from the subject system using RegRipper
• RegRipper is a Windows Registry data extraction and correlation tool written in Perl. Unlike other Registry analysis tools, RegRipper is modular and uses plug-ins to access specific Registry hive files, and in turn, to access and extract specific keys, values, and data. RegRipper accomplishes this through bypassing the Win32API.
• RegRipper’s plug-in-based architecture allows users to develop custom plug-ins, many of which are shared with the digital forensic community on the RegRipper Web site.61
• Examination of the Registry is covered in more depth in Chapter 3, in the context of a full post-mortem forensic examination of a compromised system.
Examine Web Browsing Activities
![]() With the increasing number of vulnerabilities in Web browsers and the potential for unsafe browsing practices, an examination of Web browser artifacts may reveal how malware was placed on a system.
With the increasing number of vulnerabilities in Web browsers and the potential for unsafe browsing practices, an examination of Web browser artifacts may reveal how malware was placed on a system.
![]() Client-side exploits have become more and more prevalent, particularly through “drive-by-downloads.”
Client-side exploits have become more and more prevalent, particularly through “drive-by-downloads.”
• Drive-by-downloads often occur when a user with an insecure or improperly configured Web browser navigates to a compromised (or nefarious) Web site that is surreptitiously hosting malware, allowing the malware to silently be downloaded onto the victim system.
• As a result, it is always advisable to examine the subject system Web history to gain insight into whether a Web-based vector of attack caused the malicious code incident.
• Internet Explorer history files (index.dat) can be parsed with Pasco, a free multiplatform command-line utility offered by Foundstone. The results processed by Pasco are output into a field delimited text file, enabling the digital investigator to import into as spreadsheet to further analyze these data.
• In addition to Pasco, there are numerous utilities available to parse Web history artifacts associated with specific Web browsers, as described in detail in the Tool Box section of this chapter. ![]()
Examine Cookie Files
![]() Similar to the correlative clues that can be gained through reviewing the Web browsing history on a subject system, cookie files also can provide insight into how malware may have been placed on a victim system.
Similar to the correlative clues that can be gained through reviewing the Web browsing history on a subject system, cookie files also can provide insight into how malware may have been placed on a victim system.
Inspect Protected Storage
![]() If user accounts accessed from the subject system (such as e-mail accounts and password-protected Web site logins) were discovered to be compromised after a malicious code incident, it is possible that malware may have harvested the protected storage (also referred to as “pstore”) from the subject system (or a key logger was installed).
If user accounts accessed from the subject system (such as e-mail accounts and password-protected Web site logins) were discovered to be compromised after a malicious code incident, it is possible that malware may have harvested the protected storage (also referred to as “pstore”) from the subject system (or a key logger was installed).
• Protected storage may contain passwords stored by Internet Explorer and other programs, providing the attacker with stored user credentials on the system.
• This information can be gathered with NirSoft’s GUI and CLI utility Protected Storage PassView (pspv.exe).64
• Contents of the Firefox AutoComplete and Protected Storage areas can be extracted using the DumpAutocomplete65 utility.
Malware Artifact Discovery and Extraction from a Live Windows System
![]() After identifying suspicious files on a subject system, extract them for further analysis in your malicious code laboratory. Additionally, consider browsing the system in a forensically sound manner for additional artifacts of compromise.
After identifying suspicious files on a subject system, extract them for further analysis in your malicious code laboratory. Additionally, consider browsing the system in a forensically sound manner for additional artifacts of compromise.
![]() Extraction can be accomplished with a variety or tools, including Nigilant32, F-Response, HBGary’s FGET,66 and Helix3 Pro, among others.
Extraction can be accomplished with a variety or tools, including Nigilant32, F-Response, HBGary’s FGET,66 and Helix3 Pro, among others. ![]()
Extracting Suspicious Files
![]() As discussed previously in the Memory Acquisition section of this chapter, Agile Risk Management’s Nigilant3267 is a GUI-based incident response tool useful for extracting and analyzing suspicious files. Valuable information about these suspicious files can be obtained using the Nigilant32 File System Review functionality.
As discussed previously in the Memory Acquisition section of this chapter, Agile Risk Management’s Nigilant3267 is a GUI-based incident response tool useful for extracting and analyzing suspicious files. Valuable information about these suspicious files can be obtained using the Nigilant32 File System Review functionality.
• To use this function, select the “Preview Disk” function within Nigilant32, accessible from the user console.
• After selecting this option, select the partition of the subject hard drive to explore, as displayed in Figure 1.31.
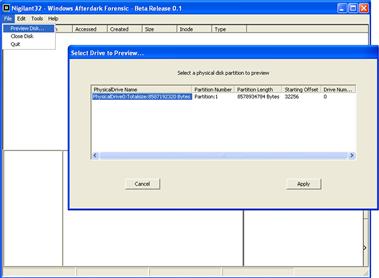
Figure 1.31 Previewing the hard drive of the subject system with Nigilant32
• The Preview Disk function uses code68 from Brian Carrier’s forensic analysis framework, the Sleuth Kit,69 to examine the active file system and minimize any potential modifications caused by the native Windows API.
• Use this feature on a subject computer to explore its file system, locate hidden files or folders or recently deleted content, or extract files for additional analysis.
• Double click on a folder of interest, double click on a file of interest, and review the populated file contents display panels located below the main display pane, as seen in Figure 1.32.
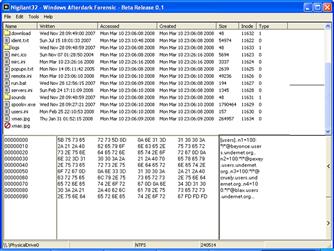
Figure 1.32 Examining file contents with Nigilant32
• Each display panel provides different information pertaining to the selected file.
![]() The first panel displays the hexadecimal offset for each line in the file.
The first panel displays the hexadecimal offset for each line in the file.
![]() The second panel shows the contents of the file in hexadecimal format.
The second panel shows the contents of the file in hexadecimal format.
![]() The third and final panel reveals the contents of the file in ASCII format, similar to using a utility to display embedded strings.
The third and final panel reveals the contents of the file in ASCII format, similar to using a utility to display embedded strings.
• After discovering files of interest, you can extract the files to an external source, such as a USB ThumbDrive or external hard drive, using the Nigitlant32 “Extract File” function shown in Figure 1.33. Using this function, you can select the location and name of the suspect file you want to extract, and in turn, the location where you want to save the extracted file specimen.

Figure 1.33 Extracting our suspect file using the Nigilant32 Extract File feature
Extracting Suspicious Files with F-Response
![]() Recall from the Memory Acquisition and Remote Registry Analysis sections of this chapter that, F-Response is an incident response framework that implements the Microsoft iSCSI initiator service to provide read-only access to the full physical disk(s) of a networked computer.
Recall from the Memory Acquisition and Remote Registry Analysis sections of this chapter that, F-Response is an incident response framework that implements the Microsoft iSCSI initiator service to provide read-only access to the full physical disk(s) of a networked computer.
• Leveraging this functionality, you can locate and extract suspicious files and associated artifacts from a suspect system drive that is mounted locally with F-Response.
• After initiating F-Response, the subject system drive can be “seen” locally on your examination system, as shown in Figure 1.34.
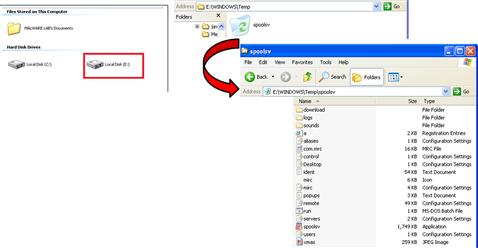
Figure 1.34 Extracting suspect files using F-Response
• You can navigate the suspect drive locally to locate and extract files of interest, just as you would your local hard drive.
Conclusions
• Live Windows systems contain a significant amount of volatile data that will be lost when the system is shut down. These volatile data can provide critical details about malicious code on the subject system, such as data that it has captured and network connections that it has established. There are a wide variety of tools for preserving such data, many of which were demonstrated in this chapter.
• Independent of the tools used and the operating system under examination, a preservation methodology must be established to ensure that available volatile data are captured in a manner that is as consistent and repeatable as possible. For forensic purposes, and to maintain the integrity of the data, keep detailed documentation of the steps taken on the live system.
• The methodology in this chapter provides a general robust foundation for the forensic preservation of volatile data on a live Windows system. It may need to be altered for certain situations. The approach is designed to capture volatile data as a source of evidence, enabling an objective observer to evaluate the reliability and accuracy of the preservation process and the acquired data.
• Collecting volatile data is a delicate process and great care must be taken to minimize the changes made to the subject system during the preservation process. Therefore, extensive examination and searching on a live system is strongly discouraged. If the system is that interesting, take the time to create a forensic duplicate of the disk for examination, as covered in Chapter 3.
• Do not trust the operating system of the subject system, because it may give incomplete or false information. To mitigate this risk, seek corroborating sources of evidence, such as port scans and network logs.
 Pitfalls to Avoid
Lacking familiarity with tools, techniques, and protocols prior to an incident
![]() Do not wait until an actual malicious code incident to become familiar with the forensic process, techniques, and tools you are going to use to investigate a subject system.
Do not wait until an actual malicious code incident to become familiar with the forensic process, techniques, and tools you are going to use to investigate a subject system.
![]() Practice live response techniques by using your tools in a test environment to become and remain proficient.
Practice live response techniques by using your tools in a test environment to become and remain proficient.
![]() Attend relevant training when possible. Budget constraints, time constraints, and other factors often make it difficult to attend formal training. If you cannot attend, improvise. Attend free webinars; watch Web-based tutorials; self-study texts, whitepapers, and blogs; and attend local information security group meetings.
Attend relevant training when possible. Budget constraints, time constraints, and other factors often make it difficult to attend formal training. If you cannot attend, improvise. Attend free webinars; watch Web-based tutorials; self-study texts, whitepapers, and blogs; and attend local information security group meetings.
![]() Stay current with tools and techniques. Live response is a burgeoning area of digital forensics; almost daily there are new tools or tool updates released, new research, and techniques discussed. Keeping tabs on what is current will likely enhance the scope of your live response knowledge base and skills.
Stay current with tools and techniques. Live response is a burgeoning area of digital forensics; almost daily there are new tools or tool updates released, new research, and techniques discussed. Keeping tabs on what is current will likely enhance the scope of your live response knowledge base and skills.
![]() Stay abreast of new threats. Similar to staying current with tools and techniques, the converse is just as important—staying current on malicious code trends, vulnerabilities, and vectors of attack.
Stay abreast of new threats. Similar to staying current with tools and techniques, the converse is just as important—staying current on malicious code trends, vulnerabilities, and vectors of attack.
![]() Utilize online resources such as social networks and listservs. It is often difficult to find time to attend training, read a book, or attend a local information security group meeting. A great resource to stay abreast of live response tools and techniques is with social network media such as Twitter and Facebook. Joining specific lists or groups on these media can provide real-time updates on topics of interest.
Utilize online resources such as social networks and listservs. It is often difficult to find time to attend training, read a book, or attend a local information security group meeting. A great resource to stay abreast of live response tools and techniques is with social network media such as Twitter and Facebook. Joining specific lists or groups on these media can provide real-time updates on topics of interest.
Failing to test and validate your tools
![]() Do not deploy tools on a subject system without first having a clear understanding of what your tools’ functionalities, limitations, and “footprint” on a system are.
Do not deploy tools on a subject system without first having a clear understanding of what your tools’ functionalities, limitations, and “footprint” on a system are.
![]() Research tools that you intend to incorporate into your live response toolkit. Are they generally accepted by the forensic community? Are there known “bugs” or limitations to be aware of? Have you read all documentation for the tools?
Research tools that you intend to incorporate into your live response toolkit. Are they generally accepted by the forensic community? Are there known “bugs” or limitations to be aware of? Have you read all documentation for the tools?
![]() Deploy the tools in a test environment to verify functionality and gain a clear understanding of how each tool works and how it impacts the target system it is deployed on.
Deploy the tools in a test environment to verify functionality and gain a clear understanding of how each tool works and how it impacts the target system it is deployed on.
![]() Document your findings—notes regarding your tools are not only a valuable reference, but can come in handy for report writing.
Document your findings—notes regarding your tools are not only a valuable reference, but can come in handy for report writing.
Using improperly licensed commercial tools
![]() Do not use “cracked” or “bootlegged” tools.
Do not use “cracked” or “bootlegged” tools.
![]() Remember that your investigation may end up in a legal proceeding, whether criminal, civil, or administrative. Having to explain that you used tools during the course of your investigation that were illegally or unethically obtained can damage your credibility—and potentially your investigation—despite how accurate and thorough your analysis and work product is.
Remember that your investigation may end up in a legal proceeding, whether criminal, civil, or administrative. Having to explain that you used tools during the course of your investigation that were illegally or unethically obtained can damage your credibility—and potentially your investigation—despite how accurate and thorough your analysis and work product is.
Not conducting interviews prior to conducting live response
![]() Failing to conduct interviews of relevant parties prior to conducting live response may cause you to miss important details.
Failing to conduct interviews of relevant parties prior to conducting live response may cause you to miss important details.
![]() Conducting interviews of relevant parties prior to conducting live response provides you with information about the subject system, including the circumstances surrounding the incident, the context of the subject system, and intricacies about the system or network that are salient to your investigation.
Conducting interviews of relevant parties prior to conducting live response provides you with information about the subject system, including the circumstances surrounding the incident, the context of the subject system, and intricacies about the system or network that are salient to your investigation.
Running non-trusted tools directly from the subject system
![]() Do not run Live Response tools directly from the subject system.
Do not run Live Response tools directly from the subject system.
![]() The subject system is an unknown and untrustworthy environment in which the collection of volatile data can be tainted as a result of the infected system. Running tools directly from a subject system relies on the system’s operating system, which may be compromised by malware, making the acquired data unreliable.
The subject system is an unknown and untrustworthy environment in which the collection of volatile data can be tainted as a result of the infected system. Running tools directly from a subject system relies on the system’s operating system, which may be compromised by malware, making the acquired data unreliable.
![]() Make sure to use a run trusted command shell/tools from an Incident Response toolkit.
Make sure to use a run trusted command shell/tools from an Incident Response toolkit.
Not using forensically sound/clean acquisition media
![]() Do not contaminate your data by acquiring them on “dirty” media.
Do not contaminate your data by acquiring them on “dirty” media.
![]() Always ensure that the media you are using to acquire live response data are pristine and do not contain unrelated case data, malicious code specimens, and other artifacts from previous investigations.
Always ensure that the media you are using to acquire live response data are pristine and do not contain unrelated case data, malicious code specimens, and other artifacts from previous investigations.
![]() Always inspect your toolkit and acquisition media prior to deployment.
Always inspect your toolkit and acquisition media prior to deployment.
![]() Be cognizant that USB devices are common malicious code vectors—the malware you are investigating can propagate and infect your live response media by virtue of connecting to the system.
Be cognizant that USB devices are common malicious code vectors—the malware you are investigating can propagate and infect your live response media by virtue of connecting to the system.
Not following the order of volatility
![]() Losing critical evidence.
Losing critical evidence.
![]() As discussed in the introduction to this book and Chapter 1, while powered on, a subject system contains critical ephemeral information that reveals the state of the system.
As discussed in the introduction to this book and Chapter 1, while powered on, a subject system contains critical ephemeral information that reveals the state of the system.
![]() The purpose of live response is to gather this volatile information in a forensically sound manner so that it is not lost. Failing to follow the Order of Volatility and gathering less volatile information impacts the state of volatile data on the system (e.g., memory contents) and increases the risk of losing the data altogether. Network connections, process states, and data caches can quickly change if not acquired in timely manner.
The purpose of live response is to gather this volatile information in a forensically sound manner so that it is not lost. Failing to follow the Order of Volatility and gathering less volatile information impacts the state of volatile data on the system (e.g., memory contents) and increases the risk of losing the data altogether. Network connections, process states, and data caches can quickly change if not acquired in timely manner.
Failing to document the system date and time
![]() Forgetting to document the system date and time and compare them to a reliable time source at the beginning of live response can prove problematic for your investigation.
Forgetting to document the system date and time and compare them to a reliable time source at the beginning of live response can prove problematic for your investigation.
![]() The system date and time are essential details about the suspect system that will serve as the baseline for temporal context in your investigation.
The system date and time are essential details about the suspect system that will serve as the baseline for temporal context in your investigation.
![]() Make sure to document the system date and time in your investigative notes in addition to acquiring the date and time through your live response toolkit.
Make sure to document the system date and time in your investigative notes in addition to acquiring the date and time through your live response toolkit.
Not acquiring the contents of physical memory at the beginning of the live response process
![]() Contaminating/impacting the evidence by leaving a “deep footprint” in it.
Contaminating/impacting the evidence by leaving a “deep footprint” in it.
Gathering incomplete system details
![]() Incomplete system details can potentially affect the context surrounding your subject system.
Incomplete system details can potentially affect the context surrounding your subject system.
![]() Make sure to gather as many details about the subject system as possible, giving you deep context about and surrounding the system. For instance, vital details such as system date/time and system uptime are foundational in establishing a time line surrounding the malicious code incident.
Make sure to gather as many details about the subject system as possible, giving you deep context about and surrounding the system. For instance, vital details such as system date/time and system uptime are foundational in establishing a time line surrounding the malicious code incident.
![]() Gathering the subject system’s hostname, IP address, and other network-based identifiers is critical in examining the relational context with other systems on the network.
Gathering the subject system’s hostname, IP address, and other network-based identifiers is critical in examining the relational context with other systems on the network.
Failing to determine if the attacker is still logged into the subject system
![]() Do not let the attacker know you are investigating them.
Do not let the attacker know you are investigating them.
![]() Conducting live response while an attacker is on the subject system will most likely alert the attacker to your investigation.
Conducting live response while an attacker is on the subject system will most likely alert the attacker to your investigation.
![]() Alerting the attacker can potentially have devastating consequences to your investigation and to the subject system (and other systems on the network), such as destruction of evidence, escalation of attacks, or additional compromises to maintain inconspicuous, undiscoverable, and continual access to the system.
Alerting the attacker can potentially have devastating consequences to your investigation and to the subject system (and other systems on the network), such as destruction of evidence, escalation of attacks, or additional compromises to maintain inconspicuous, undiscoverable, and continual access to the system.
Failing to conduct a holistic investigation
![]() Failing to obtain complete context about the suspect system and the malicious code event.
Failing to obtain complete context about the suspect system and the malicious code event.
![]() Conducting a “flat” or incomplete investigation into a subject system will limit your understanding about the malicious code incident, the impact on the subject system, and the nature and purpose of the attack.
Conducting a “flat” or incomplete investigation into a subject system will limit your understanding about the malicious code incident, the impact on the subject system, and the nature and purpose of the attack.
![]() Conduct a complete and thorough investigation, gathering multiple perspectives on the data so that a complete analysis can be conducted. For example, in collecting information about running processes from a subject system, simply gathering a list of running processes without more provides the digital investigator with insufficient information about the processes and their relational context to other evidence.
Conduct a complete and thorough investigation, gathering multiple perspectives on the data so that a complete analysis can be conducted. For example, in collecting information about running processes from a subject system, simply gathering a list of running processes without more provides the digital investigator with insufficient information about the processes and their relational context to other evidence.
Incomplete or sloppy documentation
![]() Do not jeopardize your investigation by poorly documenting it.
Do not jeopardize your investigation by poorly documenting it.
![]() As discussed in the introduction to this book, one of the keys to forensic soundness is documentation.
As discussed in the introduction to this book, one of the keys to forensic soundness is documentation.
![]() A solid case is built on supporting documentation that reports where the evidence originated and how it was handled.
A solid case is built on supporting documentation that reports where the evidence originated and how it was handled.
![]() From a forensic standpoint, the acquisition process should change the original evidence as little as possible, and any changes should be documented and assessed in the context of the final analytical results.
From a forensic standpoint, the acquisition process should change the original evidence as little as possible, and any changes should be documented and assessed in the context of the final analytical results.
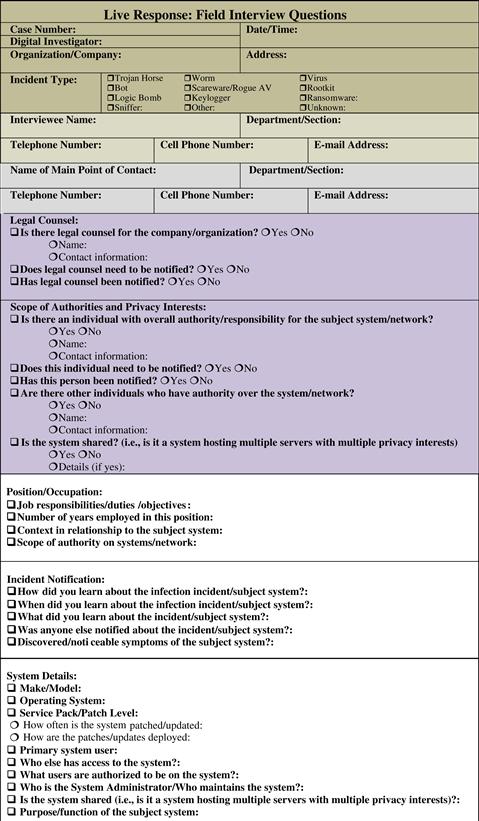

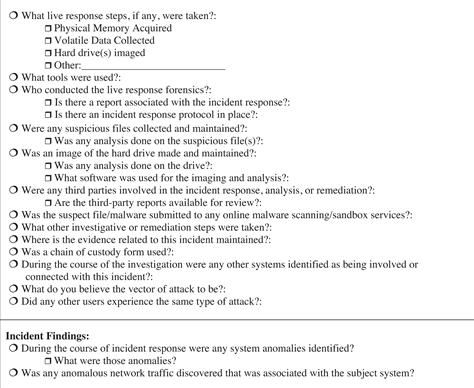
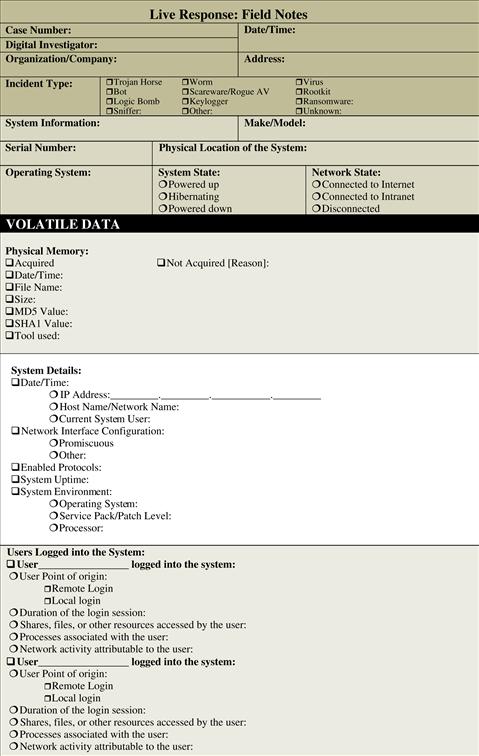
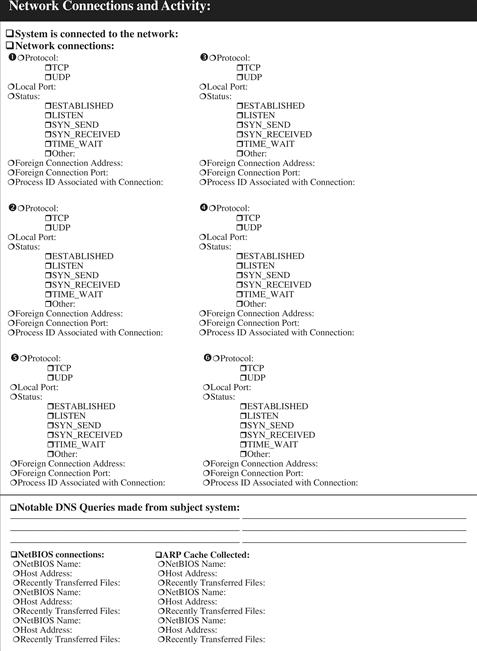
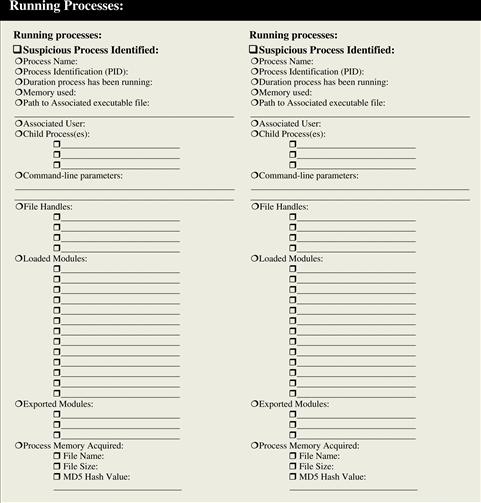

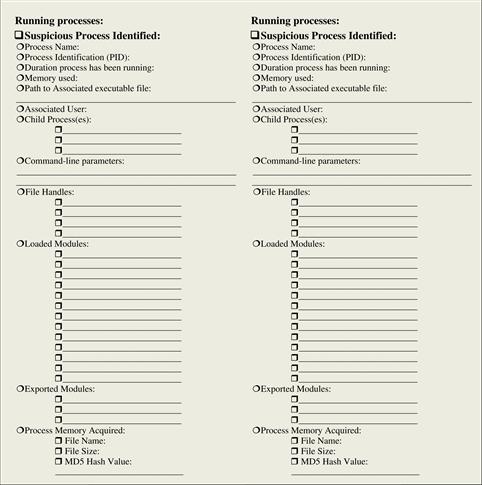


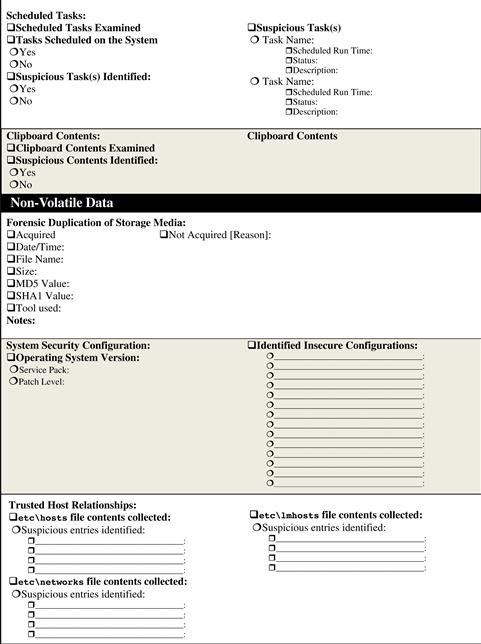


![]() Malware Forensic Tool Box
Malware Forensic Tool Box
Live Response Tools for Investigating Windows Systems
In this chapter we discussesd a myriad of tools that can be used during the course of live response investigation. Throughout the chapter, we deployed many tools to demonstrate their functionality and output when used on an infected system; however, there are a number of tool alternatives that you should be aware of and familiar with. In this section, we explore these tool alternatives. This section can also simply be used as a “tool quick reference” or “cheat sheet,” as there will inevitably be times during an investigation where having an additional tool that is useful for a particular function would be beneficial, since you may have little time to conduct research for or regarding the tool(s) while responding in the field. As the digital forensic tool landscape is constanly evolving, the companion Web site for this Field Guide, www.malwarefieldguide.com, will strive to maintain a comprehensive, dynamic, and up-to-date listing of tools. We welcome tool suggestions via the Web site http://www.malwarefieldguide.com/Contact_Us.html.
The tools in this section (and on the companion Web site) are identified by overall “tool type”—deliniating the scope of how the respective tools can be incorporated in your malware forensic live response toolkit. Further, each tool description includes a cross-reference to the page number in Chapter 1 in which the relevant substantive discussion is provided, along with details about the tool author/distributor, associated URL, description of the tool, and helpful command switches, when applicable.
Incident Response Tool Suites
In Chapter 1 we examined the incident response process step by step, using certain tools to acquire different aspects of stateful data from a subject system. There are a number of tool suites specifically designed to collect digital evidence in an automated fashion from Windows systems during incident response and generate supporting documentation of the preservation process.
• Some of these local incident response tool suites execute commands on the compromised computer and rely on system libraries on the compromised system.
• Other programs, commonly known as “remote forensics tools,” address some of the limitations of local incident response suites and use a servlet that enables remote evidence gathering while trying to rely on the compromised operating system as little as possible (with varying degrees of success).
• Using remote forensic tools, digital investigators can access many machines from a central console, making your expertise more effective.
• Furthermore, using a remote forensics tool is more subtle than running various commands on the system, and it is less likely to alert the subject of investigation.
• These tool options, including the strengths and weakness of these tools, are covered in this section.


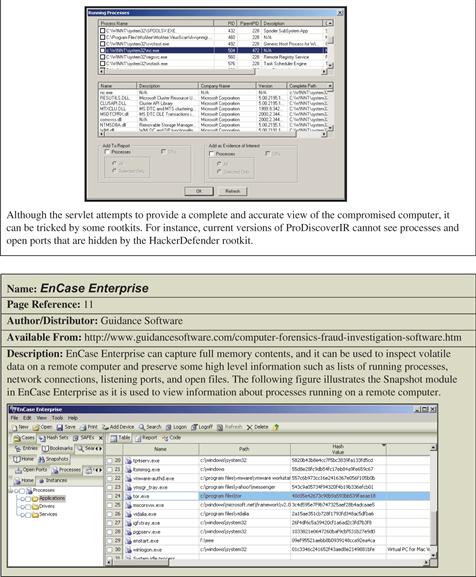

Remote Collection Tools
Recall that in some instances, to reduce system interaction, it is preferable to deploy live response tools from your trusted toolkit locally on a subject system but collect the acquired data remotely. This process requires establishing a network connection, typically with a netcat or cryptcat listener, and transferring the acquired system data over the network to a collection server. Remember, although this method reduces system interaction, it relies on the ability to traverse the subject network through the ports established by the netcat listener.
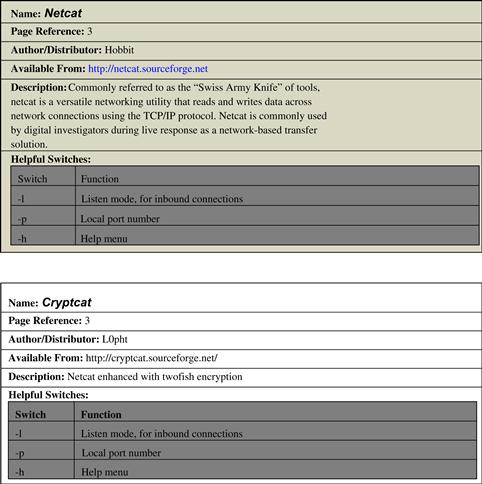


Volatile Data Collection and Analysis Tools
Physical Memory Acquisition
Chapter 1 emphasized the importance of first acquiring a full memory dump from the subject system prior to gathering data using the various tools in your live response toolkit. This is important, particularly due to the fact that running incident response on the subject system will alter the contents of memory. To get the most digital evidence out of physical memory, it is advisable to perform a full memory capture prior to running any other incident response processes. There are a variety of tools to accomplish this task, as described next.

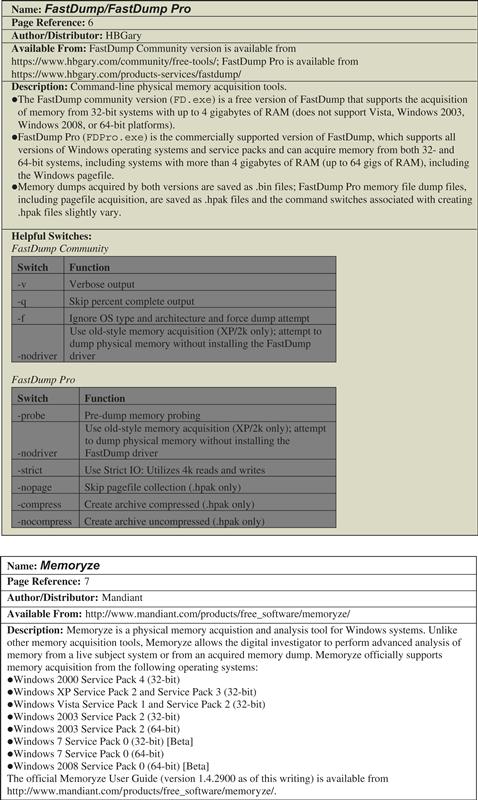


Collecting Subject System Details
System details are a fundamental aspect of understanding a malicious code crime scene. In particular, system details inevitably will be crucial in establishing an investigative time line and identifying the subject system in logs and other forensic artifacts. In addition to the tools mentioned earlier in the chapter, others tools to consider include the following.

Identifying Users Logged into the System
Remember, identifying users logged into the subject system serves a number of investigative purposes: (1) to help discover any potential intruders logged into the compromised system; (2) to identify additional compromised systems; and (3) to provide insight into a malicious insider malware incident, and provide additional investigative context by being correlated with other artifacts. Some other tools to consider for this task include the following.

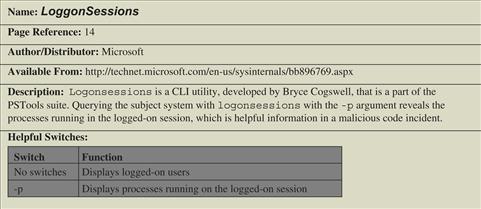
Network Connections and Activity
Malware network connectivity is a critical factor for identifying a document; connectivity from a subject system may be to communicate with an attacker’s command and control structure, to download additional malicious files, or to exfiltrate data from the system, among other things. Trusted versions of netstat, arp, and nbtstat are essential in the digital investigator’s toolkit for probing internal and external network connections. In addition to these tools and others mentioned in this chapter, tcpvcoan, described next, is another to consider. Further, for utilities specifically geared for providing insight into port-to-process mapping, see the section of this chapter called Correlate Open Ports with Running Processes and Programs appearing on page 22.


Process Analysis
As many malware specimens (such as worms, viruses, bots, key loggers, and Trojans) will often manifest on the subject system as a process, collecting information relating to processes running on a subject system is essential in malicious code live response forensics. Process analysis should be approached holistically—examine all relevant aspects of a suspicious process, as outlined in the chapter. Listed next are additional tools to consider for your live response toolkit.
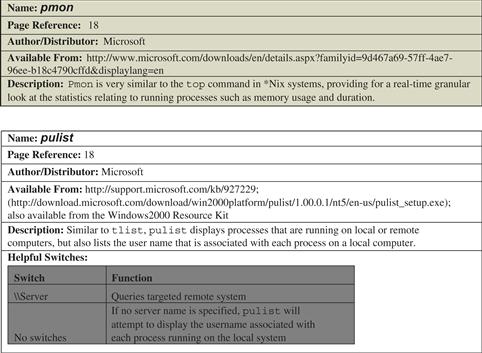
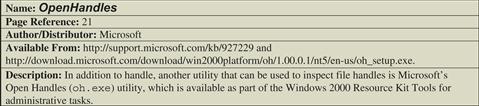

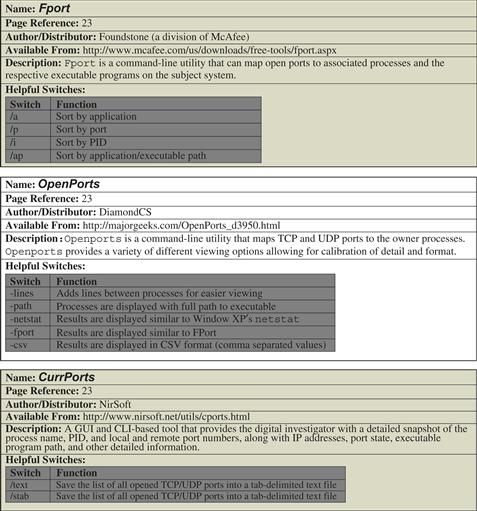
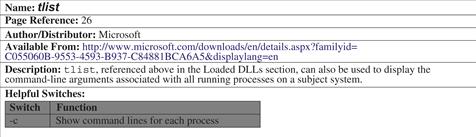
Services
Malware can manifest on a victim system as a service, silently running in the background, unbeknownst to the user. As with the examination of running processes and open ports, explore running services by first gaining an overview, and then apply tools to extract information about the services with more particularity. Some other service analysis tools include:

Drivers
In addition to determining the running services on a subject system, consider examining the installed drivers on the system, including the nature and status ofthe drivers. A reminder of the importance of this step is the recent sophisticated malware variant, Stuxnet, which installs drivers used to inject code into system processes and to conceal the malware. In addition to the tools discussed in Chapter 1, another tool to consider is ListDrivers.

Opened Files
Open files on a subject system may provide clues about the nature and purpose of the malware involved in an incident, as well as correlative artifacts for your investigation. In Chapter 1 we examined the tool OpenFilesView; another tool to consider is openfiles.

Determining Scheduled Tasks
Recall that some malicious code variants are “event-driven,” meaning that until a certain date or event triggers execution, the malware will remain dormant. In Chapter 1, we referenced the Microsoft utility schtasks, which is described in further detail below.
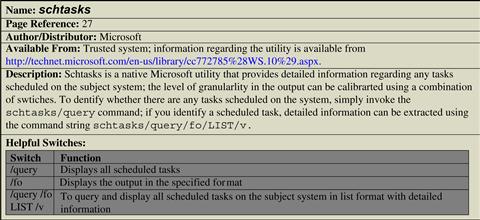
Clipboard Contents
Remember that an attacker, whether remotely logged into a system or a nefarious insider, may cut and paste information while on a subject system. This information may provide valuable investigative leads and correlate other artifacts found on the system, in network traffic, or in the malicious code itself.

Non-Volatile Data Collection and Analysis Tools


Auto-Start Locations
As was discussed in this chapter, malware often has a persistence mechanism to ensure longevity on a computer. A frequent method used for this purpose is the creation of an auto-start location (also referred to as an “autorun”) in the registry. In addition to the Microsoft Autoruns tool, another option for discovering and analyzing autorun locations is StartupRun.

Event Logs
On Windows systems, many activities related to a malware incident can generate entries in the Event Logs. Some other Event Log dumping tools to consider for your live response toolkit include:


Group Policies
Remember to closely inspect user accounts that are local to the subject system or domain accounts that were used to log in—these can reveal how malware was placed on the computer. Below are additional tools that assist in examining user and group policy details.
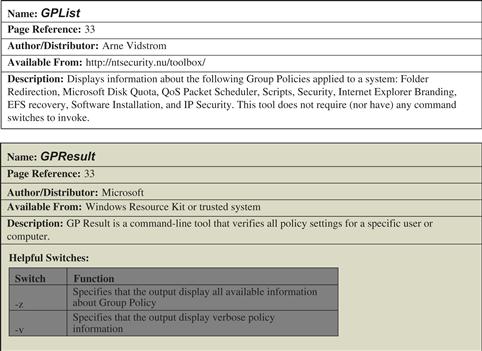
File System: Hidden Files and Alternate Data Streams
Malware and associated artifacts often manifest as hidden files. Similarly, certain malware specimens abuse the NTFS Alternate Data Stream feature—which allows you to hide data in an existing file name with the use of a stream name—to hide the malware or associated files. Consider adding tools to your live response toolkit to discover these files.


Web History
Client-side exploits are becoming more and more prevalent, particularly through “drive-by-downloads.” Drive-by-downloads often occur when a user with an insecure or improperly configured Web browser navigates to a compromised (or nefarious) Web site that is surreptitiously hosting malware, allowing the malware to silently be downloaded onto the victim system. As a result, it is always advisable to examine the subject system Web history to gain insight into whether a Web-based vector of attack caused the malicious code incident.
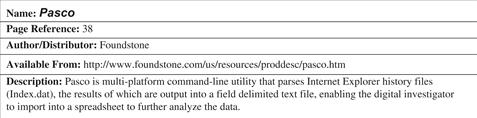
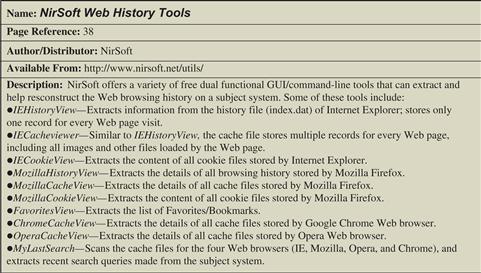
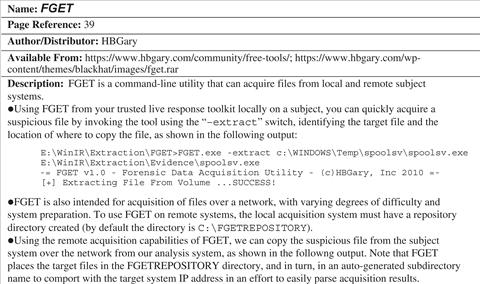
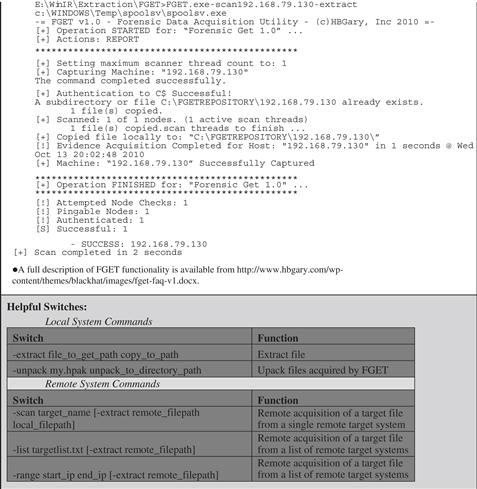
Selected Readings
Books
1. Carvey H. Windows Forensic Analysis DVD Toolkit Second edition. Burlington, MA: Syngress; 2009.
2. Jones, K., Bejtlich, R., and Rose, C.W. (2005). Real Digital Forensics. Reading, MA: Addison-Wesley. Prosise, C., Mandia, K., and Pepe, M. (2003). Incident Response and Computer Forensics, Second edition. New York: McGraw-Hill/Osborne.
Papers
1. Kent K, et al. Guide to Integrating Forensic Techniques into Incident Response National Institute of Standards and Technology, Special Publication 800–86 2006.
2. Mancini, S. (2006). RAPIER: A 1st Responders Information Acquisition Framework. First Conference 2006.
3. Pär Österberg Medina, S. (2008). Detecting Intrusions: The Latest Forensics Tools and Techniques to Identify Windows Malware Infections. First Conference 2008.
4. Waits C, et al. Computer Forensics: Results of Live Response Inquiry vs Memory Image Analysis Carnegie Melon Software Engineering Institute 2008.
Jurisprudence/RFCS/Technical Specifications
1. Columbia Pictures Indus. v. Bunnell, 2007 U.S. Dist. LEXIS 46364 (C.D. Cal. June 19, 2007). RFC 3227—Guidelines for Evidence Collection and Archiving.
1 For more information about FastDump, go to https://www.hbgary.com/products-services/fastdump/.
2 For more information about FastDump Community version, go to https://www.hbgary.com/community/free-tools/#fastdump.
3 For more information about FastDumpPro, go to http://www.hbgary.com/wp-content/themes/blackhat/images/fastdumppro-faq.pdf.
4 For more information about Nigilant32, go to http://www.agileriskmanagement.com/publications_4.html.
5 For more information about the iSCSI initiator, go to http://www.microsoft.com/downloads/en/details.aspx?familyid=12cb3c1a-15d6-4585-b385-befd1319f825&displaylang=en.
6 For more information about F-Response, go to http://www.f-response.com/.
7 Helix3 Pro is a digital forensic tool suite CD that offers both a “live” and bootable forensic environment. For more information about Helix3 Pro, go to http://www.e-fense.com/helix3pro.php.
8 For more information about whoami, go to http://www.microsoft.com/downloads/en/details.aspx?familyid=3E89879D-6C0B-4F92-96C4-1016C187D429&displaylang=en.
9 For more information about ver, go to http://technet.microsoft.com/en-us/library/bb491028.aspx.
10 For more information about promisdetect, go to http://www.ntsecurity.nu/toolbox/promiscdetect/.
11 For more information about promqry, go to http://www.microsoft.com/downloads/en/details.aspx?familyid=4df8eb90-83be-45aa-bb7d-1327d06fe6f5&displaylang=en.
12 For more information about URLProtocolView, go to http://www.nirsoft.net/utils/url_protocol_view.html.
13 For more information about uptime.exe, go to http://support.microsoft.com/kb/232243.
14 For more information about psinfo, go to http://technet.microsoft.com/en-us/sysinternals/bb897550.aspx.
15 For more information about PsLoggedOn, go to http://technet.microsoft.com/en-us/sysinternals/bb897545.aspx.
16 For more information about quser, go to http://technet.microsoft.com/en-us/library/cc754583%28WS.10%29.aspx.
17 For more information about netusers, go to http://www.systemtools.com/cgi-bin/download.pl?NetUsers.
18 For more information about loggonsessions, go to http://technet.microsoft.com/en-us/sysinternals/bb896769.aspx.
19 For more information about netstat, go to http://technet.microsoft.com/en-us/library/cc940097.aspx.
20 For more information about NetBIOS names, go to http://msdn.microsoft.com/en-us/library/ms817948.aspx.
21 For more information about nbtstat, go to http://technet.microsoft.com/en-us/library/cc940106.aspx.
22 For more information about ARP, go to http://technet.microsoft.com/en-us/library/bb490864.aspx.
23 For more information about the arp command, go to http://www.microsoft.com/resources/documentation/windows/xp/all/proddocs/en-us/arp.mspx?mfr=true.
24 For more information about tlist.exe, go to http://www.microsoft.com/downloads/en/details.aspx?familyid=C055060B-9553-4593-B937-C84881BCA6A5&displaylang=en.
25 For more information about tasklist, go to http://technet.microsoft.com/en-us/library/bb491010.aspx.
26 For more information about PRCView, go to http://www.teamcti.com/pview/prcview.htm.
27 For more information about handle.exe, go to http://www.microsoft.com/technet/sysinternals/ProcessesAndThreads/Handle.mspx.
28 An example of malware that implements this technique is the Vanquish Rootkit, a DLL-injection-based rootkit that hides files, folders, and registry entries and logs passwords. For more information about Vanquish Rootkit, go to https://www.rootkit.com/vault/xshadow/ReadMe.txt.
29 For more information about listdlls.exe, go to http://technet.microsoft.com/en-us/sysinternals/bb896656.aspx.
30 For more information about Procinterrogate, go to http://sourceforge.net/project/shownotes.php?release_id=122552&group_id=15870.
31 For more information about PRCView, go to http://www.teamcti.com/pview/prcview.htm.
32 For more information about ListModules, go to http://ntsecurity.nu/toolbox/listmodules/.
33 For more information about DLLExportViewer, go to http://www.nirsoft.net/utils/dll_export_viewer.html.
34 For more information about Microsoft Windows services, go to http://msdn.microsoft.com/en-us/library/ms685141.aspx.
35 In 2006, a printer driver distributed by Hewlett Packard was found to be infected with the Funlove virus. Another piece of malicious code emerged in August 2007 named Trojan.Peacomm.C infects a Windows device driver named “kbdclass.sys” to force the system to load the virus each time the system is rebooted. Unfortunately, this Trojan also employs rootkit techniques to hide its presence on the infected system, becoming invisible to the operating system. In such cases, memory forensics can be employed to extract more information about the malicious code. For more information, go to http://www.symantec.com/enterprise/security_response/weblog/2007/08/the_new_peacomm_infection_tech.html.
36 For more information about List Loaded Drivers, go to http://support.microsoft.com/kb/927229 (available from the Windows 2000 Resource Kit Tools) and http://download.microsoft.com/download/win2000platform/drivers/1.0/NT5/EN-US/drivers.exe.
37 For more information about DriverView, go to http://www.nirsoft.net/utils/driverview.html.
38 For more information about OpenFilesView, go to http://www.nirsoft.net/utils/opened_files_view.html.
39 For more information about psfile, go to http://technet.microsoft.com/en-us/sysinternals/bb897552.aspx.
40 For more information about doskey, go to http://technet.microsoft.com/en-us/library/bb490894.aspx?wt.slv=3D=.
41 For example, the polymorphic file infector named W32/Bacalid, http://vil.nai.com/vil/Content/v_140566.htm.
42 For example, in early 2008, a system administrator was sentenced to 30 months in prison for embedding malicious code designed to wipe out critical data stored on more than 70 servers (http://newark.fbi.gov/dojpressrel/2007/nk091907.htm).
43 An example of such a specimen is WORM_SOHANAD.FM, which once downloaded by an unsuspecting user from a malicious Web site, installs three additional malicious code files, and uses the Windows Task Scheduler to create a scheduled task to execute the files at a later time. For more information about WORM_SOHANAD.FM, go to http://www.trendmicro.com/vinfo/virusencyclo/default5.asp?VName=WORM%5FSOHANAD%2EFM&VSect=P.
44 For more information about the at command, go to http://support.microsoft.com/kb/313565.
45 For more information about schtasks.exe, go to http://technet2.microsoft.com/windowsserver/en/library/1d284efa-9d11-46c2-a8ef-87b297c68d171033.mspx?mfr=true.
46 For more information about pclip.exe, go to http://unxutils.sourceforge.net.
47 For information about WinUpdatesList, go to http://www.nirsoft.net/utils/wul.html.
48 For more information about auditpol, go to http://technet.microsoft.com/en-us/library/cc731451%28WS.10%29.aspx.
49 For more information about dumpsec, go to http://www.systemtools.com/download/dumpacl.zip.
50 For more information about AutoRuns, go to, http://technet.microsoft.com/en-us/sysinternals/bb963902.aspx.
51 For more information about eldump, go to www.ibt.ku.dk/jesper/ELDump/default.htm.
52 For more information about NTlast, go to http://www.foundstone.com/us/resources/proddesc/ntlast.htm.
53 For more information about SFind, go to http://www.foundstone.com/us/resources/proddesc/forensictoolkit.htm.
54 For more information about rifiuti, go to http://www.foundstone.com/us/resources/proddesc/rifiuti.htm.
55 For more information about macmatch.exe, go to http://www.ntsecurity.nu/toolbox/macmatch/.
56 For more information about regdump, go to http://social.msdn.microsoft.com/Forums/en-US/windowscompatibility/thread/c14b5017-40ec-4978-a82c-b3758f0808c1/.
57 For more information about dumpreg, go to http://www.systemtools.com/download/dumpreg.zip.
58 For more information about USBView, go to http://www.nirsoft.net/utils/usb_devices_view.html.
59 For instance, in 2008, some USB digital picture frames were infected with various pieces of malware, and a number of Maxtor Basics Personal Storage 3200 hard drives produced by Seagate in late 2007 contained the Win32.AutoRun.ah virus. A Windows system that was configured to launch executables referenced in the “autorun.ini” configuration file stored on the digital picture frame would have installed the virus that stole passwords and sent them to a server on the Internet.
60 For more information about RegRipper, go to http://regripper.wordpress.com/.
61 For more information about RegRipper, go to http://regripper.wordpress.com/.
62 For more information about Galleta, go to http://www.foundstone.com/us/resources/proddesc/galleta.htm.
63 For more information about MozillaCookiesView, go to http://www.nirsoft.net/utils/mzcv.html.
64 For more information about Protected Storage PassView, go to http://www.nirsoft.net/utils/pspv.html.
65 For more information about DumpAutoComplete, go to http://www.foundstone.com/us/resources/proddesc/DumpAutoComplete.htm.
66 For more information about FGET, go to http://www.hbgary.com/free-tools.
67 For more information about Nigilant32, go to http://www.agileriskmanagement.com/publications_4.html.
68 For more information about the code from the Sleuth Kit, go to http://www.sleuthkit.org/sleuthkit/docs/api-docs/index.html.
69 For more information about the Sleuth Kit, go to http://www.sleuthkit.org/index.php.