
Summarize Columns
The Tables > Summary command calculates various summary statistics, including the mean and median, standard deviation, minimum and maximum value, and so on.
In a summary table:
• A single row exists for each level of a grouping variable that you specify. If no grouping variable is specified, a single row exists for the full data table.
• When there are several grouping variables, the table contains rows for each combination of levels of all the grouping variables.
• In addition to one column for each grouping variable, the table contains frequency counts in a column named N Rows with counts for each grouping level.
• The summary table can be linked to its source table. When you select rows in the summary table, the corresponding rows are highlighted in its source table.
• If the source table’s column(s) contain value labels, the value labels are displayed in the new table.
• A summary table is not saved when you close it unless you select File > Save As to give it a name and location.
Create a Summary Table
To create a summary table:
1. Open a data table.
2. Select Tables > Summary. The window in Figure 8.2 appears.
3. Highlight the columns that you want to summarize.
Note: For details about the options in the red triangle menu, see “Columns Filter Menu” in the “JMP Platforms” chapter.
Figure 8.2 The Summary Window
4. Add summary statistics, groups, subgroups, and select any options needed:
5. Name the summary table by typing a name in the box beside Output table name.
6. Click OK.
Add Summary Statistics
You can add columns that display summary statistics (such as mean, standard deviation, median, and so on) for any numeric column in the source table.
1. In the Summary window, highlight the column that you want to use in calculating the statistics.
2. Click the Statistics button.
3. Select one of the standard univariate descriptive statistics from the Statistics drop-down menu. The statistics are described in “Explanation of Statistics”.
Use One or More Grouping Columns
If you want the statistics summarized by group, highlight the column(s) that you want to be your grouping variables and click Group to move the variable into the grouping variables list. See “Example of Creating a Summary Table”, for an example. If you add only grouping variables, the summary table shows a count for each group.
To change the order of the grouping variables:
To change the order of the grouping variables (ascending or descending order), select a variable in the grouping variable list and click the ascending or descending button ( ). The icon beside the variable changes to indicate the sorting order.
You can also change the order of the grouping variables using the Value Ordering column property. See “Value Ordering” in the “Set Column Properties” chapter.
To include marginal statistics:
To add marginal statistics (for the grouping variables) to the output columns, click the box beside Include marginal statistics. In addition to adding marginal statistics for each grouping variable, JMP adds rows at the end of the table that summarize each level of the first grouping variable. For example, proceed as follows:
1. Open the Companies.jmp sample data table.
2. Select Tables > Summary.
3. Select Profits ($M) and click Statistics.
4. Select Mean.
5. Select Type and Size Co and click Group.
6. Select Include marginal statistics.
7. Click OK (or Create). See Figure 8.3 at left.
Figure 8.3 Summary Table with and without Marginal Statistics
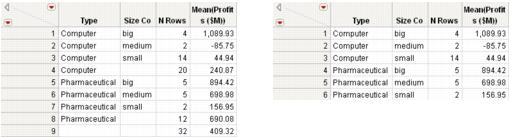
Compare the summary table with marginal statistics (at left) to the summary table without marginal statistics (at right). You can see that the marginal statistics are added, and a row showing that there are 32 total Computer and Pharmaceutical companies.
Use Quantile Statistics
To add specific quantile statistics, follow these steps:
1. In the box under For quantile statistics, enter value (%) type the desired quantile value (%) for the first quantile (for example, 25).
2. Select the applicable column and click Statistics.
3. Select Quantiles.
4. (Optional) Repeat this process for any additional quantiles.
Change the Format of the Statistics Column Name
To change the format of the statistics column name in the summary table, select from one of the formats in the statistics column name format menu. Table 8.1 illustrates the available options. Assume that you are creating a summary table of the mean profits for a company. Your original column name is Profits ($M).
|
Option
|
Example
|
|
stat (column)
|
Mean (Profits ($M))
|
|
column
|
Profits ($M)
|
|
stat of column
|
Mean of Profits ($M)
|
|
column stat
|
Profits ($M) Mean
|
Link to the Original Data Table
You can select whether to link the summary table to the original data table. By default, the Link to original data table option is selected. If you want to edit the data in the summary table, deselect the Link to original data table option. When the summary table is linked to the original data table, you cannot edit the data in the summary table, since that would modify and compromise the original data.
Within linked tables, if you drag columns from the summary table into the column heading of a new column in the original data table, the values are expanded as if they were matched by grouping columns.
Keep the Summary Window Open
If you select the Keep dialog open option, the Summary window remains open after you click Create. Notice that once you select this option, the OK button is replaced by a Create button.
Create a Two-Way Table of Summary Statistics by Adding a Subgroup Variable
1. Highlight the column(s) that you want to be the nested variable(s). These are your “subgroup variable(s).”
2. Click Subgroup to move the variable(s) into the subgroup list.
3. Highlight the column for which you want statistics summarized by subgroup.
4. In the Statistics list, select the specific statistic that you want.
5. Click OK.
For details about the types of statistics, see “Explanation of Statistics”.
Add a Statistics Column to an Existing Summary Table
After you have created a summary table, you can add columns of descriptive summary statistics for any numeric column in the source table. To do so, from an existing summary table, click on the upper red triangle in the data grid and select Add Statistics Column.
Example of Adding a Statistics Column to an Existing Table
Suppose that you have already created a summary table, and you want to add more statistics to the existing summary table.
1. Open the Companies.jmp sample data table.
2. Select Tables > Summary.
3. Select Type and Size Co and click Group.
4. Click OK.
5. From the red triangle menu in the upper left corner of the data table grid, select Add Statistics Column.
Figure 8.4 Creating a Summary Statistics Column from Within a Data Table

A modified version of the Summary window appears.
6. Select the column that you want, click Statistics, and select the specific statistic that you want. For this example, select profit/emp and click Statistics, and then select Mean.
7. Click OK.
Figure 8.5 Example of a Summary Table with a Summary Statistics Column

The Mean(profit/emp) column is added to the existing summary table.
Explanation of Statistics
You can add columns of descriptive summary statistics for any numeric column in the source table by clicking the Statistics button (Figure 8.6) and making a selection from the menu.
Figure 8.6 Adding Summary Statistics

The Statistics menu gives these summary statistics for numeric columns:
• N Is the number of nonmissing values.
• Mean Is the arithmetic mean of a column’s values. It is the sum of nonmissing values (and if defined, multiplied by the weight variable) divided by the Sum Wgt.
• Std Dev Is the sample standard deviation, computed for the nonmissing values. It is the square root of the sample variance.
• Min Is the smallest nonmissing value in a column.
• Max Is the largest nonmissing value in a column.
• Range Is the difference between Max and Min.
• % of Total Is the percent of the total count for each group. Or, if you have so specified, the percent of nonmissing values of the column to the total count for each group.
• N Missing Is the number of missing values.
• N Categories Is the number of distinct categories.
• Sum Is the sum of all values in a column.
• Sum Wgt Is the sum of all weight values in a column. (See “Assign Column Properties” in the “Set Column Properties” chapter.) Or, if no column is assigned the weight role, Sum Wgt is the total number of nonmissing values.
• Variance Is the sample variance, computed for the nonmissing values. It is the sum of squared deviations from the mean, divided by the number of nonmissing values minus one.
• Std Err Is the standard error of the mean. It is the standard deviation divided by the square root of N. If a column is assigned the role of weight, then the denominator is the square root of the sum of the weights.
• CV (Coefficient of Variation) Is the measure of dispersion, which is the standard deviation divided by the mean multiplied by one hundred.
• Median Is the 50th percentile, which is the value where half the data are below and half are above or equal to the 50th quantile (median).
• Interquartile Range Is the difference between the third and first quartiles.
• Quantiles Gives the value at which the specific percentage of the argument is less than or equal to. For example, 75% of the data is less than the 75th quantile. The summary window has an edit box for entering the quantile percentage that you want.
Example of Creating a Summary Table
Suppose a researcher is working with Companies.jmp, which groups companies by Type and Size. Follow along with this next example by opening Companies.jmp from the sample data folder that was installed when you installed JMP.
Suppose the researcher wants to:
• Create a table that shows the average profit per employee for small, medium, and big computer and pharmaceutical companies. In other words, create a table that contains a row for each size company and a column for the mean profit per employee of each type of company.
• Create it so the cells hold the mean for the subgroup (defined by the intersection of the row and column).
1. Open the Companies.jmp sample data table.
2. Select Tables > Summary.
3. Select Size Co and click Group.
The researcher selects Size Co as the grouping variable because he wants the values in that column to become rows in the new table.
4. Select profit/emp and click Statistics.
5. Select Mean.
6. Select Type and click Subgroup.
This tells JMP to create a column for the average profit per employee (Mean(profit/emp)) for each level (computer, pharmaceutical) of subgroup variable (type).
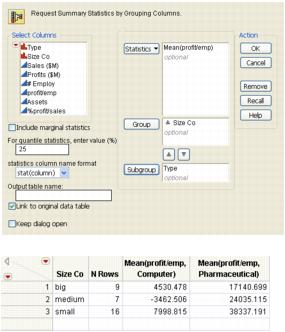
Figure 8.7 shows the completed Summary window and the resulting summary table.
Figure 8.7 Summary Statistics for a Subgroup
..................Content has been hidden....................
You can't read the all page of ebook, please click here login for view all page.