
In our first chapter, we developed our skills in order to use the PowerCenter Designer screen; you also learned how to create mappings using sources, targets, and transformations.
Before you read this chapter, make sure that you have a complete understanding of the various components of the PowerCenter Designer screen that we discussed in Chapter 1, Starting the Development Phase – Using the Designer Screen Basics. You should be clear on how to use sources and targets and how to create mappings.
In this chapter, we will talk about the high-level aspects of the PowerCenter Designer screen. Once we are clear with the basics of the designer screen, we are all set to work on the advanced concepts of PowerCenter Designer.
Apart from the basic functionalities of creating mappings, the designer screen offers multiple utilities that assist you in smoother execution of the ETL processing. Some of these functionalities will be regularly used, and some will be rare for you. It is always good to have an understanding of these functionalities in order to have an upper hand while using the tool.
The topics that will be covered in this chapter are as follows:
- Debugger
- Reusable transformations
- Mapplets
- Target load plans
- Parameters and variables
- Comparing objects
Informatica PowerCenter provides a utility called debugger that debugs the mapping so that you can easily find issues with the mapping that you created. Using the debugger, you can see the flow of every record across the transformations.
As you are aware, Informatica PowerCenter is not a data storage tool, it is a data manipulation tool that helps you manipulate the data. This point is important to the debugger, as once you finish the process, you only have either the source or the target to check the result and compare it in order to verify the data. Debugger jumps in with a functionality that provides you with the option to actually see the data flow from each and every transformation in your mapping.
When you execute the mapping through the session task, the data automatically starts flowing from the source to the target through transformations. You manually execute the same process using the debugger.
Take a look at the upcoming example to understand the debugger functionality.
You created a mapping with 100 transformations, and you have 1,000 records present in your source. You executed the mapping and got the results. When you started analyzing the output in your target table, you found that the data in few columns was incorrect. Now, the problem is that you are not sure where out of the 100 transformations the issue actually started— debugger is your solution. It will allow you to see the movement of each record from every transformation so that you can catch the origin of the error and rectify it accordingly.
To set up and execute the debugger, perform the following steps:
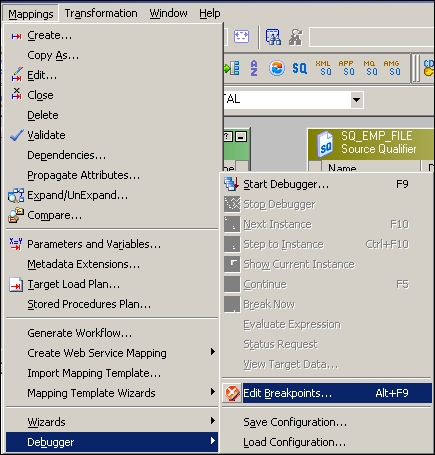
- In the designer, navigate to Tools | Mapping Designer | Mapping | Debugger | Start Debugger, as shown in the following screenshot:

- A new window will pop up mentioning the prechecks for the debugger as follows:

Read the points clearly before you proceed and click on Next.
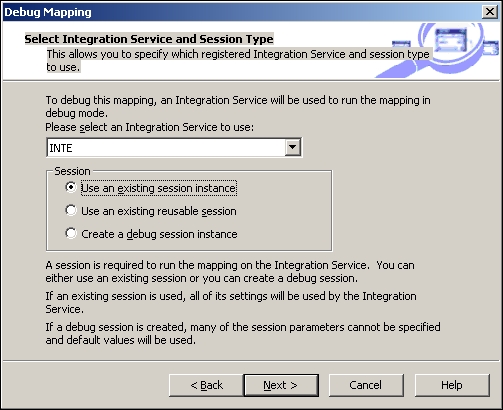
- The next screen will ask you to select the session task for the mapping you wish to debug. Select the session task you created in order to execute the mapping.
Even though running a debugger is a manual process, you still need a session task because Integration Service needs to get the path to extract and load the data that is provided in the session task.
Note that you can use an existing session or create a new debug session to run the debugger. If you use an existing session, the debugger will use the properties mentioned in the session. You need to mention all the details if you create a new debug session.
After selecting the session, click on Next.
- Select the appropriate session in the next window and click on Next.

- In the next screen, you will see the option to discard the target data. This option indicates what you wish to do with the data you loaded in the target using the debugger. As you run the debugger for testing purposes, you basically wish to discard the target data.
Checking this option will discard the data in the target. Now, click on Finish.

The output panel of your screen will get divided into three sections, as shown in the following screenshot:
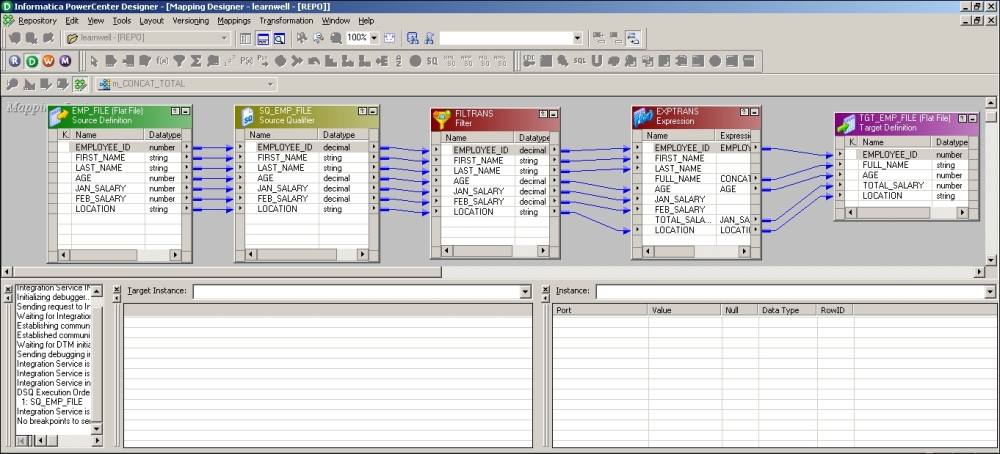
The output panel gets divided into the following sections:
- Notification: This section will show you general information about the debugger execution.
- Target instance: This section will show you the data as it reaches the target of your mapping. If your mapping contains multiple targets, all the targets will be displayed in this section in the drop-down list, as shown in the preceding screenshot. You can select the target for which you wish to see the data from the dropdown.
- Instance: This section will show you the data when it reaches different transformations of your mapping. If your mapping contains multiple transformations, all the transformations will be displayed in this section in the dropdown, as shown in the preceding screenshot. You can select the transformation for which you wish to see the data from the dropdown. The debugger shows you the data in each transformation as per the logic you coded in the mapping.
We have completed the setup for the debugger; now click on Next Instance to start the debugger.

The debugger will start showing you the movement of the data from each transformation under the instance, and then in the target under the target instance at the end.
Keep pressing Next Instance (F10) to move the data toward the next instance in your mapping flow.
Once all the data reaches the target, the debugger will automatically shut down.
If you have very big mapping, and traversing through every transformation is a tough task, you can actually select particular transformations at a particular interval to understand and narrow the issue down. This can be achieved using breakpoints.
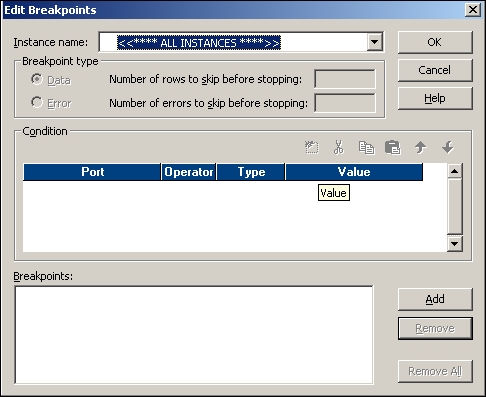
To set a breakpoint, click on Edit Breakpoint, as shown in the following screenshot:
A new window will let you add breakpoints. Click on Add to add a new breakpoint to the debugger. You can set few more properties in this window.
As you must have noticed, the debugger is the best way to find the issues in the data movement across the mapping. So, whenever you face some issues related to data loading in the target or mismatches in the targets, start a debugger and solve your issue.