
Why are we wrapping up with R? When you are proudly showing off your data, your audience may include a statistician or a data scientist who wants to take your data away and conduct further analysis. When you are showing off dashboards, it is important to be mindful that you are showing data to an audience with a variety of skills and perspectives. This may include people who need detailed data as well as the business user or strategy decision maker who needs the headline first.
This topic has been included to acknowledge the data scientists and the statisticians in your organization. These individuals may be self-taught or have strong academic backgrounds in this topic. Your dashboards in Tableau can also reach these people, and they can further deepen their investigation by using R.
After all, the dashboard is like a tool for the data scientist as well as the business decision maker. How is your dashboard like a tool? Tableau is fantastic as a prototyping tool, because it can help you create dashboards quickly without well-defined user specifications. This means that your dashboard can grow very organically. Including R allows you to conduct advanced analytics based on your organic dashboards, thereby offering further insights.
Fortunately, Tableau allows you to use R, a functional programming language, plus an environment to study statistics and data science. R has over 5,000 packages in existence, and the range is growing continuously.
This exciting development means that you can use R packages and functions in Tableau's calculated fields, thereby unlocking all of the features of R when creating Tableau charts. For instance, you will be able to use results of R functions to annotate points on a chart, thereby adding context to the data. You can also use the result of R's statistical functions as a source for Tableau charts.
For example, you can color points by cluster using the k-means clustering function that is available in R. Since the output of R can be used, business analysts will see the results directly in Tableau without the need to know the R language themselves. This truly unleashes the power of R!
In this recipe, we will look at connecting Tableau to R.
Note that R integration is not supported by Tableau Reader or Tableau Online.
For the exercises in this recipe, we will build on the existing Chapter Eight dashboard in order to access R.
You will also need to have Internet access in order to install R and Rserve. You will also install RStudio, which is a user-friendly way to use R.
Note that this functionality is only available in Version 8.1 or above.
- Confirm whether you are using a 32-bit or 64-bit system.
- Your filesystem must allow long file names. To test this, simply create a text file with a long filename.
- Download R from the R project website at http://www.r-project.org/, making sure you have the correct bitness registry key.
- The downloaded installation file is called
R-3.0.3-win.exe. Double-click on the file, and follow the wizard. - When installing on a 64-bit version of Windows, you will be asked whether you want to install the 32- or 64-bit versions of R (the default is to install both).
- Note that you will be asked to choose a language for installation, and that choice applies to both installation and uninstallation, but not to running R itself.
- Once R is installed, install RStudio. To do this, go to http://www.rstudio.com/ and click on the Download now button.
- On the next page, you will be given a choice whether to install RStudio Desktop or RStudio Server. Choose RStudio Desktop.
- Look for the heading Recommended for Your System and select the link under it. It will be the best RStudio version for your environment.
- You will get a dialog box asking you whether you want to run or save the
.exefile. Click on Run. - RStudio will now unzip the files and install the program. Success!
- Once you have installed R, you will need to install Rserve, which is an R package that uses TCP/IP to serve the connection between R and other programs. To do this, open RStudio.
- In RStudio, click on the Install Packages button, as shown in the following screenshot:
- After you have clicked on Install Packages, you will get the following dialog box. In the Packages textbox, type in
Rserve, as shown in the following screenshot: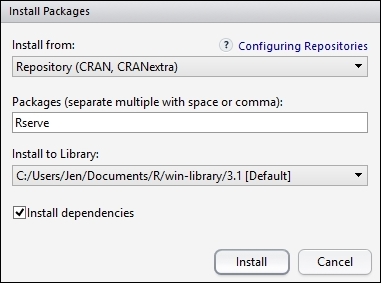
- Click on Install.
- When Rserve is successfully installed, the RStudio console will write a message to output its success. The screen will look as follows:

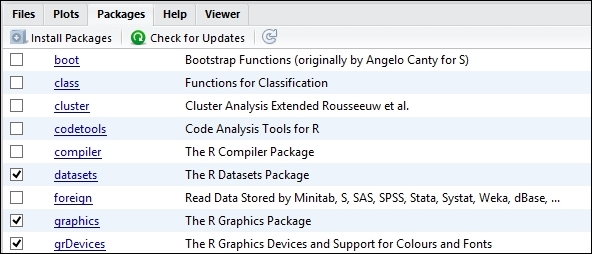
- When you look at the Packages window in RStudio, you will see that Rserve is installed and ticked. Here is a screenshot of the Packages window:

- Start Rserve by typing
Rserve()in the console. - Now, open Tableau if it is not already open.
- Establish a connection to Rserve from Tableau. This is done in Tableau via the Help menu item. Then, choose Settings and Performance.
- From this point, select Manage R Connections..., as in the following screenshot:

- You will be asked for connection details, which you can see in the following screenshot:

- Click on OK.
- You have now installed R! For those of you who are new to R, it is worth downloading a sample from the Tableau website, http://www.tableausoftware.com/about/blog/2013/10/tableau-81-and-r-25327. This will walk you through the R language.
The process starts an R package called Rserve, which uses TCP/IP to serve the connection that allows other programs to use the facilities of R. Rserve has a number of advantages; it is quick because it does not initialize R as part of its startup. It is also cleverly programmed so that each connection has its own working directory, and consequently, each connection does not have an impact on the other connections.
In this recipe, we used RStudio to install Rserve. Tableau offers another way of installing Rserve on their knowledge base, and you can find more information on this at http://kb.tableausoftware.com/articles/knowledgebase/r-implementation-notes.
This easy connection brings all of R's data analysis capabilities to Tableau. You can view Tableau as the shop window that makes data visible and accessible to users. R does the hard data analysis behind the scenes.
This means that users can bring the power of R's amazing statistical capabilities to data visualizations in Tableau. Very powerful indeed! Oh, and fun!
If you want to know more about R, please visit the R website at http://www.r-project.org/. Oh, and be warned; prepare to lose a lot of time totally engrossed in R, Tableau, and data. Data will change your life! Have fun with it, and embrace your inner data love.
- If you want to know more about R, then please look at Bora Beran's blog at http://boraberan.wordpress.com/ for examples and R's capabilities.
- You could also find some examples on Tableau's solution page at http://www.tableausoftware.com/solutions/capabilities.