
Importing data from Excel is the easiest way to start with Express. There are plenty of good examples and free data sources on the Web, you can pick your favorite or just upload an Excel file of yours.
Excel files may contain more than one sheet of data, but only one sheet can be imported at a time, and they must comply with a few rules:
- Only one table per worksheet is allowed
- The first worksheet cannot be empty
- Worksheets must contain data in the first 20 rows
I prepared a worksheet for these recipes from the World Bank data; it contains some indicators from years 2000 through 2010 for every country of the world. You can download the data from http://xls.apphb.com/Ch13X1.xlsx to have a look at it before going on.
The Excel file can be on the local computer or stored on the Web and accessible via HTTP, HTTPS, or FTP. Please review this document for guidelines and tips about preparing your own Excel data at http://at5.us/Ch13U4.
We will now import a file from the Web:
- Close MicroStrategy Express welcome page by clicking on the round red X icon.
- Click on New Dashboard…, the application loads the Select Data page.
- From the left list, choose the radio button labeled Use File from URL and enter the
http://xls.apphb.com/Ch13X1.xlsxaddress in the Enter a URL for Excel/CSV File text area. - Click on Continue, Express loads the first 50 rows of data and displays the Review Data page. From here, we can decide which columns are attributes and which are metrics.
- Move the cursor over the first column header (Country Name), a small down arrow icon appears, click on it to open the context menu.
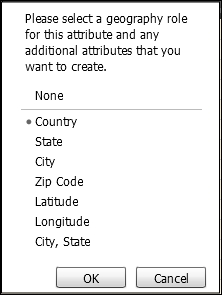
- This column has already been detected as an attribute; we only need to specify that is a country. In the context menu, select Attribute; in the list that pops up, click on Country and then on OK, like in this image:
- Moving to the second column (Date), open the context menu and select Attribute and uncheck everything but Year and click on OK, see image:

- Third and fourth columns were detected as metrics, very well. Move to fifth column (Business: Mobile Phone Subscribers), this was detected as an attribute but it is really a metric, so open its context menu and click on Metric.
- From here onwards, the columns should all be metrics, so scroll right and change all the columns that were identified as attributes (blue) to metrics (orange).
- When you're done, click on Continue. Express saves the definition and starts importing all the data. This phase can take a while. At the end of the import, you'll be presented with a Select a Visualization dialog.
- Click on the first thumbnail in the top left (tool tip: Grid), a new dashboard is created with some data. This interface looks very familiar…
- Click on Save & Close, in the Save As dialog, type
World Bank Indicatorsin the Name text field and click on OK.
You will be redirected to the main page and your new dashboard will appear in the list.
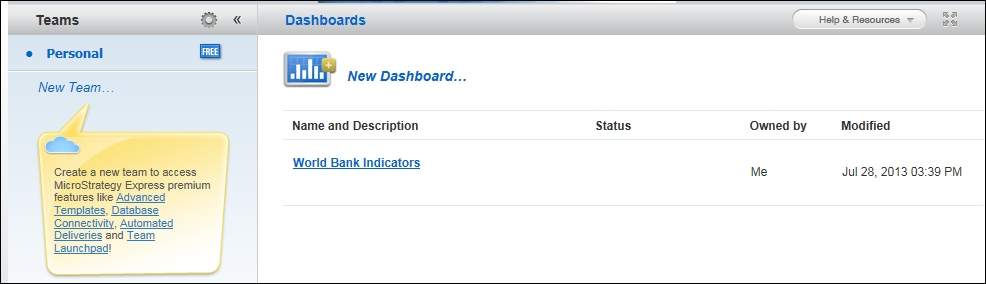
Behind the scenes MicroStrategy Express has loaded the Excel file, created attributes and metrics, and populated the dataset that serves as a source for the dashboard.
When the data changes, we can refresh the dataset:
- From the main Express window, move the cursor on the name of the dashboard (World Bank Indicators) and click on the Refresh data hyperlink.
- Click on the Review data checkbox on the right, and hit Continue.
- You can inspect the data for correctness and click on Finish.
- When a message appears that Data refresh was successful, click on Exit to be redirected back to the main page.