From this recipe on, we are exploring the subscription-based version of Express. You can use the free 30 days trial to test drive the premium features described henceforth. As of writing, I have no pricing information regarding the subscription; a quick Google search pointed me to this FAQ document: http://at5.us/Ch13U6, which simply says you need to contact the company for details.
The list of different databases that can be accessed from Express includes DB2, Oracle, SQL Server, MySQL, Informix, and more; both on-premise and cloud hosted.
When accessing a database in your company network, you need to have a public facing IP address to connect to (remember that while Express runs as a Flash application in your browser, you're actually using an Intelligence Server on the cloud); there may be network restrictions in your company and firewall rules that prevent this, therefore please refer to your network administrator and discuss the implications of opening an external access to the RDBMS: Express will disclose you the fixed IP address used to enter your LAN.
When accessing a database hosted in the cloud, you should configure the access to it, and depending on the provider you may have different degrees of control over the external accessibility. During this recipe, anyway, you can use a small SQL Server that I set up just for training purposes: it contains a single table with data about vehicles and consumption (source: http://www.fueleconomy.gov).
You need to enable the premium features trial in Express:
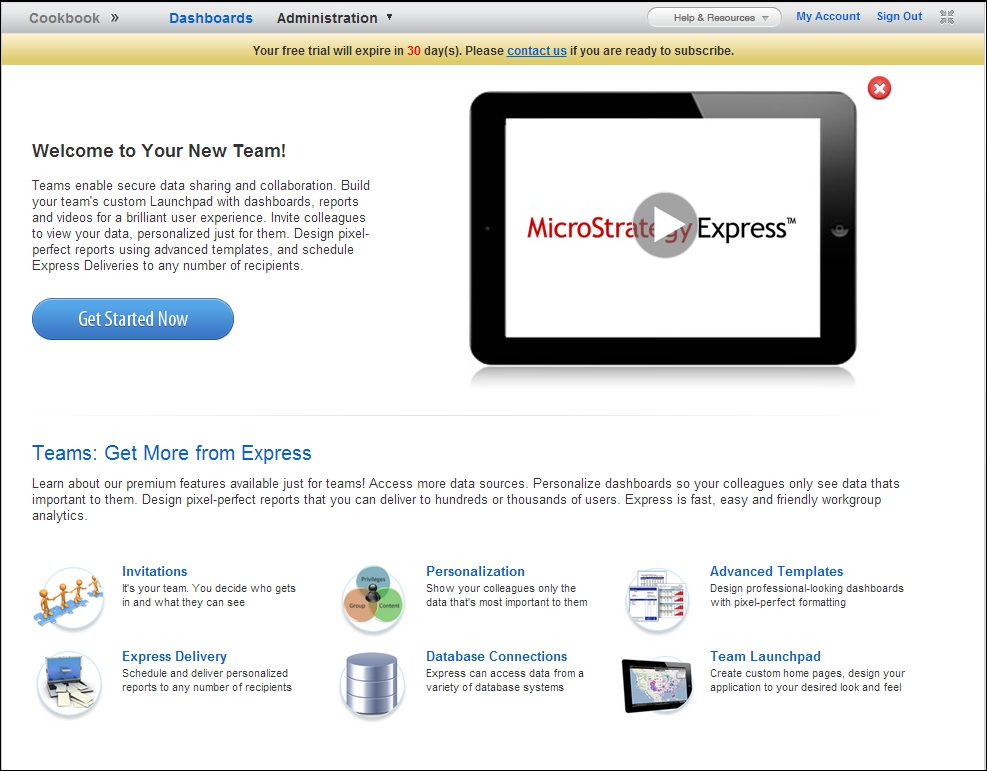
- Log in to Express and from the main page click on New Team….
- On the welcome page, click on the button labeled Start Free Trial.
- In the Create New Team dialog, type
Cookbookas Name and click on OK. - Your team is being created. After few seconds, you'll be redirected to the welcome page for your team.
You can increase the available space by hiding the Teams pane on the left and clicking on the full screen icon on the top right.
We are now creating a new connection and a new dashboard:
- Close the welcome page by clicking on the red X button. Click on New Dashboard…, the Select Your Data Source page appears.
- Select Database, read the instructions on the right, and note down the IP address in case you need to open firewall access. Click on Continue.
- You will see a Quick Tips page; hit Close to continue.
- In the following page, there are three areas: Database connections, Available tables, and an empty area on the right (query designer). Move to the title bar of Database connections and click on the green plus icon to create a new one.
- In the Database connection dialog, open the first dropdown labeled Select and choose SQL Server. The rest of the controls change accordingly.
- In the second dropdown labeled DBMS, pick Microsoft SQL Server 2008; fill the four following textboxes with these values (I know they look weird but they're real, you can copy and paste them from the companion code file):
- Server, Port:
a8dcbfcc-ff1a-43e0-8955-a20b014d110c.sqlserver.sequelizer.com - Database Name:
dba8dcbfccff1a43e08955a20b014d110c - User:
ifgyjwiiswzigybz - Password:
jcyTY35ZeufL8LzCMx4mZCFgi3UB4KAmpo6VQCgypx3bXPugAzPXeYcPDrK5hB6A

- Server, Port:
- Name the connection
SQL Server Cookbookand press OK. - Now in the Database connections group, select SQL Server Cookbook to see a list of available tables. There is only one, named Vehicles. Click on the plus sign on the left of the name to see its columns.
- Click on the table name (Vehicles) and drag it to the right empty pane, the table will appear on the query design canvas.
- In the query designer, scroll down the table until you find the field named fuelType1.
- Placing the cursor on the fuelType1 field activates two buttons, click on the first one with a green plus icon. This adds the column [Vehicles. fuelType1] to the result pane in the lower part of the screen.
- Scroll down and repeat step 11 to add the columns named make and model. Then scroll back up to find the field named co2TailpipeGpm. Add this one also.
- Click on the green right arrow on the top of the designer to execute the query. The result pane now shows the first few lines of the dataset.
- Move to the header of the Co2tailpipegpm column on the result pane and open its context menu. Select Metric; the result pane should look like this screen capture:

- Click on Continue.
- Click on Select a Visualization, pick the second icon (tool tip: Heat Map). A new dashboard with a Heat Map will be created.
- Open the Show menu and choose Page-by.
- From My Data pane, drag the Fueltype1 attribute to the Page-by row.
- Click on the Make attribute in My Data and drag it to the Heat Map | Grouping area. Place it right over the existing Fueltype1 attribute; when the two overlap, you will see the cursor changing to a black arrow with a small blue icon: this means the Make attribute will substitute Fueltype1.
- From the Heat Map | Color By area, drag the Row Count metric to the Heat Map | Size By area and substitute the existing Co2tailpipegpm metric.
- Now move to My Data pane and open the context menu of the Co2tailpipegpm metric. Select New Metric | Average. This will create a new average (Co2tailpipegpm) metric.
- Drag the new metric to the Heat Map | Color By area and substitute the existing Row Count. Try to click on the Page-by button and you'll see the Heat Map changing accordingly.
- Now move the cursor to the Heat Map | Color By area. Click on the square with four colors next to the header (tool tip: Thresholds…).
- In the Thresholds dialog, open the first dropdown and select Red-Orange-Green.
- Open the second dropdown labeled Based On and pick Highest %. Press OK.
- Rename this visualization as
tailpipe CO2 in grams/mile for fuelType1, and change the Layout 1 title toHeat Map. - Click on Save & Close and name this as
Vehicles CO2 emissions.
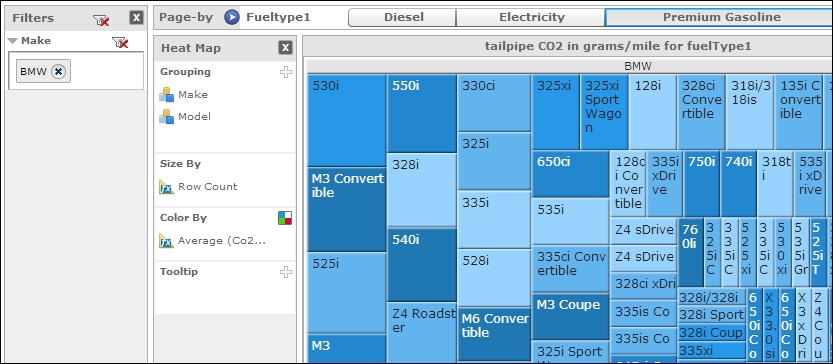
Looking at the following image:

We can see that high averages of CO2 emissions are shown in red (Ferrari, not surprisingly) and low values in green (MINI). The size of the boxes represents the number of rows in the dataset per each car brand. With the Page-by buttons, the Heat Map switches from a fuel type to another.
In this particular recipe, the connection to the RDBMS is performed from the Intelligence Server hosted on MicroStrategy data centers to a test SQL Server hosted by a cloud provider. Your case may be different.
It is important to have a clear view of your network architecture and how to access it from outside. Different database vendors can have different settings (port, server name, user, and so on); have all the relevant information at hand before connecting from Express. MicroStrategy support (<[email protected]>) can help you configure the access or set up a VPN tunnel if needed.
Filters can be applied to Heat Maps just like other visualization: show the Filters pane and drag an object to it.
Adding more attributes to the Heat Map | Grouping area creates more boxes.