
One of my favorite features of reports in MicroStrategy is called dynamic aggregation. As per the product manual, this feature allows you to change the level of report aggregation without having to re-execute the SQL query against the data warehouse. It is part of the product component called OLAP Services for which you need an additional license. Thankfully, in the free reporting suite, it comes at no charge.
In this recipe, we will move objects in and out of a very long report grid and see the results. Before going on, we need to modify a default MicroStrategy rule that limits the result set to 32,000 rows.
Follow these steps:
- Right-click on the name of the project (it should be COOKBOOK if you've followed all the chapters) and select Project Configuration from the context menu.
- In the left Categories tree list open Governing Rules | Default | Result sets and find on the right pane a textbox named All other reports, which is usually set to 32000.
- Modify this number to
64000and click on OK. - Now create a new report with the following objects:
- The Sum SalesAmount from FactInternetSales metric
- The Country attribute
- The City attribute
- The Customer attribute
- The Product Category attribute
- The Product Subcategory attribute
- Go to View | Grid View to run the report, after a while the result will show 44,734 rows.
- Hover on the Customer header and, when the cursor changes to a cross-arrow, click-and-drag the Customer attribute to the left part of the screen into the area named Report objects.
- The grid will update immediately and display 4,343 rows. Notice that the metric values are recalculated in accordance to the new grouping, but no SQL is executed.
- Now click on the Product Subcategory header and drag this attribute onto the Report objects area, only 947 rows are shown.
- Similarly, drag to remove the Product Category attribute.
- On the Report objects pane, right-click on the Product Category and select Add to Columns from the context menu; the attribute is added to the grid and the metric is recalculated.
- In the same way, add the Product Subcategory to the columns and drag the City attribute to remove it from the grid.
- Save the report as
18 Dynamic Aggregation by Country and Product.
OLAP Services is a component of the Intelligence Server and performs calculations in memory rather than on the RDBMS; hence saving time and network bandwidth. The part responsible for this is called Analytical Engine. The results are displayed quickly on the client machine, and—as long as all the needed attributes are present in the Report objects list—there is no need to perform any further SELECT statements.
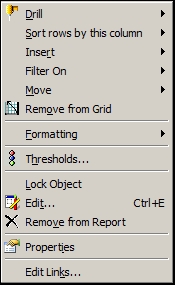
When you right-click on an attribute header on the grid, you have two similar options: Remove from Grid and Remove from Report. See the following screen capture:
Try it yourself: with the Remove from Grid option, the effect is the same as dragging it to the Report objects list—you're not really removing the attribute and the results are recalculated on the fly. With the second option, Remove from Report, you are actually creating a new SQL sentence and running a new query on the data warehouse.