
In our "Hello World" document we used a string constant to greet our users. While some of them may find this polite, it is bluntly useless; now it is time to give some more information, and we will add a report to the document to display real numbers.
When creating documents we speak about datasets; a report is a dataset, a graph is also a dataset, and we said that a document can be based on more than one dataset.
Before going further, I would like to clarify a point and give my own point of view: the document datasets do not have to be pre-existing reports. We can build them specifically for the sole purpose of document creation. And it is perfectly acceptable: let me explain.
There is something that happens every now and then in MicroStrategy projects. First, we create reports (many of them, with different levels of aggregation and filters); then we try to fit as much information as possible into a document. In the case of small sets of data this is usually not a problem, but with millions of rows, the result can be suboptimal performance. By suboptimal I mean that your users would not receive data in a "Go grab a cup of coffee" timeframe.
Putting many datasets into the same document causes extra work to the Intelligence Server, because it has to join every single one using common attributes and produce a resulting ultimate mega dataset (called virtual dataset). If there are no attributes in common between two or more reports, the ultimate mega dataset would contain a Cartesian product, which we want to avoid.
Speaking about the Cartesian product, I always remember a scene from the 1984 movie Ghostbusters:
Dr. Spengler: "There's something very important I forgot to tell you."
Dr. Venkman: "What?"
Dr. Spengler: "Don't cross the streams."
Dr. Venkman: "Why?"
Dr. Spengler: "It would be bad. […] Try to imagine all life as you know it stopping instantaneously and every molecule in your body exploding at the speed of light."
Dr. Stantz: "Total protonic reversal."
Dr. Venkman: "Right. That's bad. Okay. All right. Important safety tip."
So, in order to avoid the total protonic reversal in our document, we may consider creating a single dataset with only the columns that we will effectively use, not more not less, Dr. Spengler docuit.
We start by creating an ad hoc report for the next document. This report has Product Category, Product Subcategory, and Sum SalesAmount from FactInternetSales. Save the report as 26 InternetSales by Product and Subcategory.
Once you have the report created (no totals needed) you can follow these steps:
- If you're still on the Hello World document, click on the red star MicroStrategy logo on the top-left corner of your browser. See the following icon:

- From the menu that appears select Home to return to the main project page.
- Now click on Create Document and next, choose the Blank Document template.
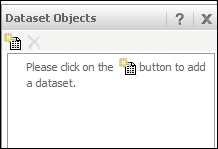
- We have a blank layout with an empty dataset. In the empty area on the left, click on the Please click on the button to add a dataset icon, see the following screen capture:
- When the Select Dataset window appears, open the first combobox that shows Shared Reports and select My Reports. The Available list below shows all the reports in the directory. Scroll down and pick the number 26.
- Click on OK and the Dataset Objects pane is populated with the attributes and metrics present in the report.
- Drag the Sum SalesAmount from FactInternetSales metric from Dataset Objects to the Detail Header section; notice that the edge of the section is highlighted in yellow when you hover onto it. Drop the metric close to the right border of the layout.
- Now that the textbox containing the metric is selected (there are six small squares around its border), click on the word Format in the menu, so that the formatting toolbar displays the buttons to modify the font and the size of the text. Click on the Bold button.
- Click on the small arrow icon next to the Insert menu and select Text, the cursor changes to a cross. Click-and-drag to draw a rectangular textbox on the left of the metric you just added and type
Total. Make it Bold too. - We created two textboxes in the Detail Header; now go to the Dataset Objects pane and drag the Sum SalesAmount from FactInternetSales metric, this time drop it into the Detail section right under its header counterpart close to the right edge.
- Click on the Interactive Mode button to run the document. See the result and save it as
27 InternetSales by Product and Subcategory, then click on Run newly saved document.
If you scroll through the results, you'll see that there are 17 rows plus the total. The report granularity is at subcategory level, this means that the Detail section is repeated for each row of the dataset and the Detail Header only appears once. Just as expected.
Another behavior is worth noting: the row in the Detail Header shows a grand total. This is how metrics work: if placed in the detail section, they show a single row value; put them in a header and you'll get an aggregate. This is very important to remember.
You can edit documents in both the Web and the Desktop application. I am used to doing it in Web because I can see immediately how it looks like; but if you feel more comfortable you can create and modify the documents just as well with the Windows client. Try it yourself:
- Open MicroStrategy Desktop, go to My Reports and right-click on 27 InternetSales by Product and Subcategory.
- Click on Edit. See that the Document Editor is very similar to the Web Interface.
- Now click on View | HTML to run the document. The result is identical.
- Close without saving.