
The binomial distribution models the number of successes in an integer number of independent trials of an experiment, where the probability of success in each experiment is a fixed number (see https://www.khanacademy.org/math/probability/random-variables-topic/binomial_distribution).
Imagine a 17th century gambling house where you can bet on flipping pieces of eight. Nine coins are flipped. If less than five are heads, then you lose one piece of eight, otherwise you win one. Let's simulate this, starting with 1,000 coins in our possession. Use the binomial() function from the random module for that purpose.
To understand the binomial() function, look at the following section:
- Initialize an array, which represents the cash balance, to zeros. Call the
binomial()function with a size of 10000. This represents 10,000 coin flips in our casino:cash = np.zeros(10000) cash[0] = 1000 outcome = np.random.binomial(9, 0.5, size=len(cash))
- Go through the outcomes of the coin flips and update the cash array. Print the minimum and maximum of the outcome, just to make sure we don't have any strange outliers:
for i in range(1, len(cash)):
   if outcome[i] < 5:
      cash[i] = cash[i - 1] - 1
   elif outcome[i] < 10:
      cash[i] = cash[i - 1] + 1
   else:
      raise AssertionError("Unexpected outcome " + outcome)

print(outcome.min(), outcome.max())
As expected, the values are between
0and9. In the following diagram, you can see the cash balance performing a random walk: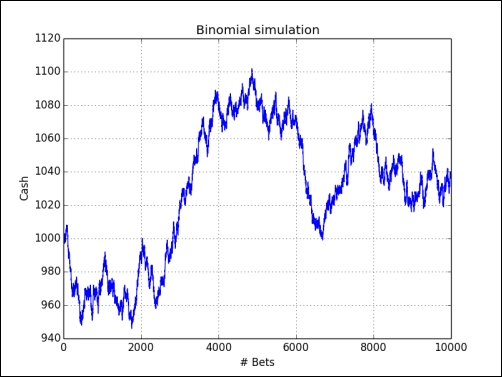
We did a random walk experiment using the binomial() function from the NumPy random module (see headortail.py):
from __future__ import print_function
import numpy as np
import matplotlib.pyplot as plt


cash = np.zeros(10000)
cash[0] = 1000
np.random.seed(73)
outcome = np.random.binomial(9, 0.5, size=len(cash))

for i in range(1, len(cash)):
   if outcome[i] < 5:
      cash[i] = cash[i - 1] - 1
   elif outcome[i] < 10:
      cash[i] = cash[i - 1] + 1
   else:
      raise AssertionError("Unexpected outcome " + outcome)

print(outcome.min(), outcome.max())

plt.plot(np.arange(len(cash)), cash)
plt.title('Binomial simulation')
plt.xlabel('# Bets')
plt.ylabel('Cash')
plt.grid()
plt.show()