
We will download the stock quotes for the last year of two trackers using matplotlib. As mentioned in the previous Chapter 9, Plotting with matplotlib, we can retrieve quotes from Yahoo Finance. We will compare the log returns of the close price of DIA and SPY (DIA tracks the Dow Jones index; SPY tracks the S & P 500 index). We will also perform the Jarque–Bera test on the difference of the log returns.
- Write a function that can return the close price for a specified stock:
def get_close(symbol):
   today = date.today()
   start = (today.year - 1, today.month, today.day)

   quotes = quotes_historical_yahoo(symbol, start, today)
   quotes = np.array(quotes)

   return quotes.T[4]
- Calculate the log returns for DIA and SPY. Compute the log returns by taking the natural logarithm of the close price and then taking the difference of consecutive values:
spy = np.diff(np.log(get_close("SPY"))) dia = np.diff(np.log(get_close("DIA"))) - The means comparison test checks whether two different samples could have the same mean value. Two values are returned, of which the second is the p-value from
0to1:print("Means comparison", stats.ttest_ind(spy, dia))The result of the means comparison test appears as follows:
Means comparison (-0.017995865641886155, 0.98564930169871368)So, there is about a 98 percent chance that the two samples have the same mean log return. Actually, the documentation has the following to say:
- The Kolmogorov–Smirnov two samples test tells us how likely it is that two samples are drawn from the same distribution:
print("Kolmogorov smirnov test", stats.ks_2samp(spy, dia))Again, two values are returned, of which the second value is the p-value:
Kolmogorov smirnov test (0.063492063492063516, 0.67615647616238039) - Unleash the Jarque–Bera normality test on the difference of the log returns:
print("Jarque Bera test", jarque_bera(spy – dia)[1])The p-value of the Jarque–Bera normality test appears as follows:
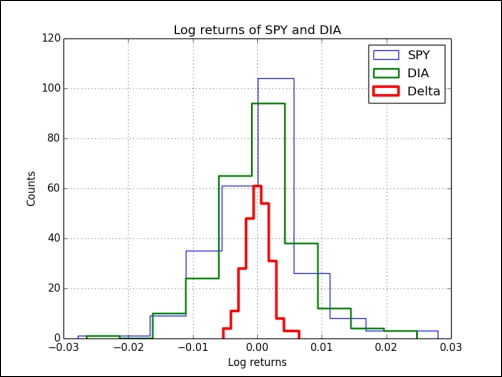
Jarque Bera test 0.596125711042 - Plot the histograms of the log returns and the difference thereof with
matplotlib:plt.hist(spy, histtype="step", lw=1, label="SPY") plt.hist(dia, histtype="step", lw=2, label="DIA") plt.hist(spy - dia, histtype="step", lw=3, label="Delta") plt.legend() plt.show()
The histograms of the log returns and difference are shown as follows:
We compared samples of log returns for DIA and SPY. Also, we performed the Jarque-Bera test on the difference of the log returns (see pair.py):
from __future__ import print_function
from matplotlib.finance import quotes_historical_yahoo
from datetime import date
import numpy as np
from scipy import stats
from statsmodels.stats.stattools import jarque_bera
import matplotlib.pyplot as plt


def get_close(symbol):
   today = date.today()
   start = (today.year - 1, today.month, today.day)
   quotes = quotes_historical_yahoo(symbol, start, today)
   quotes = np.array(quotes)
   return quotes.T[4]

spy =  np.diff(np.log(get_close("SPY")))
dia =  np.diff(np.log(get_close("DIA")))

print("Means comparison", stats.ttest_ind(spy, dia))
print("Kolmogorov smirnov test", stats.ks_2samp(spy, dia))

print("Jarque Bera test", jarque_bera(spy - dia)[1])

plt.title('Log returns of SPY and DIA')
plt.hist(spy, histtype="step", lw=1, label="SPY")
plt.hist(dia, histtype="step", lw=2, label="DIA")
plt.hist(spy - dia, histtype="step", lw=3, label="Delta")
plt.xlabel('Log returns')
plt.ylabel('Counts')
plt.grid()
plt.legend(loc='best')
plt.show()