A Kibana interface consists of four main tabs:
- Discover: The Discover page enables free text searches, field-based searches, range-based searches, and so on.
- Visualize: The Visualize page enables building many visualizations, such as pie charts, bar charts, line charts, and so on, which can be saved and used in dashboards later.
- Dashboard: The Dashboard represents collections of multiple visualizations and searches, which can be used to easily apply filters based on click interaction, and draw conclusions based on multiple data aggregations.
- Settings: Settings enables the configuration of index patterns, scripted fields, the data types of fields, and so on.
Let's take a look at the Discover page in more detail.
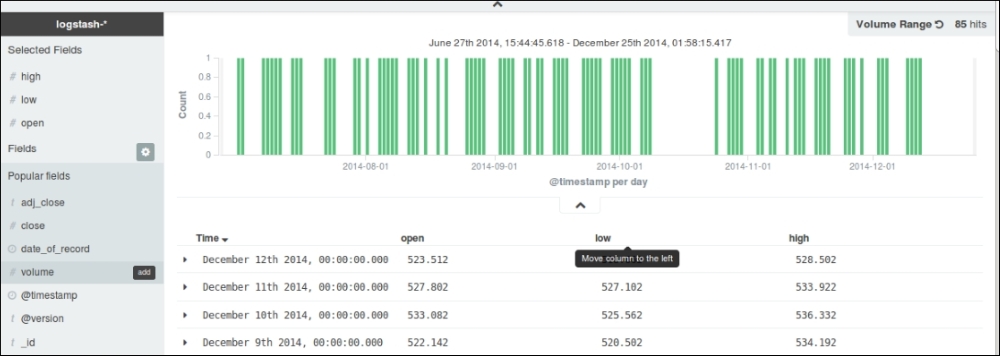
The Discover page is used to perform interactive searches on your indexed data. It allows you to perform ad hoc searches based on fields, the filtering of data, and allows you to view indexed documents as well.
A typical Kibana home page, which defaults to the Discover page, looks as follows:

Kibana Discover page
The Discover page shows all the indexed fields in the Index Pattern on the left, a Time Filter at the top, and a Search Box to enter your search queries. Also, it shows a default Histogram based on the @timestamp field in the documents and displays No. of Hits in the document corresponding to your search. It shows 500 documents by default with the latest based on the timestamp at the top.
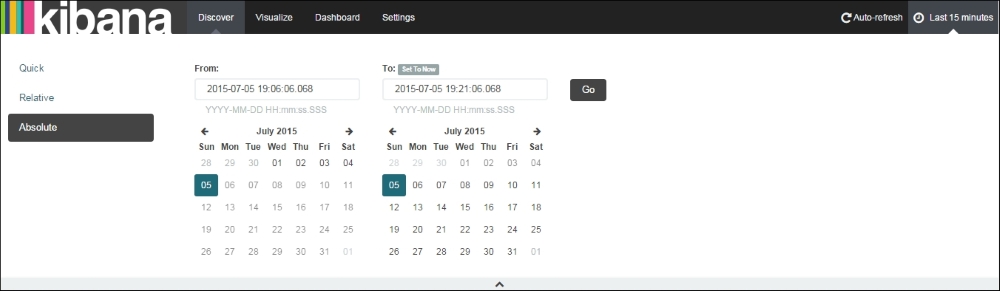
Remember the time when your boss asked to find some statistics from your data for a specific time? The time filter is the answer for these kinds of searches. You can filter data on any specific time period selected from the calendar, called Absolute, or make it Relative based on current time. There are also some quick time filters available for use.
A quick time filter helps filter quickly based on some already available time ranges:

Kibana Time Filter – Quick
A relative time filter helps filter based on relative time from the current time. By default, the time filter is set to Relative with 15 Minutes ago from Now:

Kibana Time Filter - Relative


Kibana uses Lucene query syntax to search among indices stored in index patterns. You can also specify an Elasticsearch query DSL, like we explained in Chapter 5, Why Do We Need Elasticsearch in ELK? The field list, index documents lists, and the histogram are automatically refreshed based on the search and time filter settings.
Note
Analyzed and Not Analyzed Fields
As mentioned in the Logstash index template for Elasticsearch (https://github.com/logstash-plugins/logstash-output-elasticsearch/blob/master/lib/logstash/outputs/elasticsearch/elasticsearch-template.json), when we index string fields, both analyzed (tokenized) and non-analyzed versions are saved in indexes. All non-analyzed fields appear with the .raw extension in the Discover or Visualize pages.
Let's look at some examples of searches.
The freetext search is aimed at filtering documents containing the search term. It searches in all the documents for all the fields containing the searched term.
Let's take the following instance as an example:
You want to search for all the ELK books from an index pattern consisting of PacktPub books collections. You can write 'ELK' in the search box, and it filters all documents containing the term ELK.
Boolean searches can be performed on the following terms:
"Learning" AND "ELK"
The preceding query will search for all documents that contain both terms: "Learning" and "ELK".
"Logstash" OR "ELK
The preceding query will search for all documents that contain the terms "Logstash" or "ELK".
"Logstash" NOT "ELK"
The preceding query will search for documents that contain the term Logstash but not "ELK".
Field searches aim to search for specific values or ranges of values for fields in your indexed document that displays on the left-hand side of the Discover page.
Field searches can be performed using the field name and the : character, followed by a value for the field we want to filter on.
<field_name>: <field_value>
Let's take a look at some examples of field searches:
title : "Learning ELK"
title : "Learning ELK" AND  category : "technology"
Range searches are used to search for a range of values for a field.
For example, to search for a specific date range:
date_of_record : [20140701 TO 20141231]
To search for a range of values for the volume field:
volume : [ 100000 TO 200000]
Range and field searches can be combined using boolean operators like this:
publish_date : [20150701 TO 20151231] AND title : "Learning ELK"
The following is the list of special characters, which if we want to search for, need to be escaped using the operator:
+ - && || ! ( ) { } [ ] ^ " ~ * ? :
For example, to search for 1:2 it needs to be escaped as 1:2.
You can start a new search by clicking on the New Search button on the Discover toolbar:

Kibana New Search option
Searches can be saved and used in visualizations later using the Save Search option on the Discover toolbar. Saved searches can also be added to a dashboard in order to show the information in a traditional table format. This is very important for real-world applications in identifying issues:

Kibana Save Search option
Previously saved searches can be loaded using the Load Saved Search option on the Discover toolbar:

Loading a Saved Search
Field searches can also be performed by clicking on the positive or negative filter icon on certain values on the field.

Positive and negative filter on fields using field list
In the preceding figure, if you click on the positive filter icon, it will filter all documents having the http.code value as 200, and if you click on negative filter, it will show all documents having the http.code value other than 200.
You can also add certain fields on the right-hand side panel by clicking on the add button on the field name in the field list. This enables an easy view of fields as tables based on your searches.
Field Searches in Kibana
In this way, fields can be quickly added and documents can be sorted in fields, and fields can be arranged in any order. This is especially helpful to build a table for a quick search.