
In this section, you will see how Query Store collects information about queries and query plans and how it can identify and fix regressed queries. It will be demonstrated how Query Store supports and facilitates an upgrade to SQL Server 2016.
First, you will create a new database with a single table and populate it with two million rows. This database will simulate a database that is created and used in SQL Server 2012 and that you restored in SQL Server 2016 but left in the old compatibility mode. Use the following code to accomplish this task:
IF DB_ID('Mila') IS NULL CREATE DATABASE Mila;
GO
USE Mila;
GO
--help function GetNums created by Itzik Ben-Gan (http://tsql.solidq.com)
CREATE OR ALTER FUNCTION dbo.GetNums(@n AS BIGINT) RETURNS TABLE
AS
RETURN
  WITH
  L0   AS(SELECT 1 AS c UNION ALL SELECT 1),
  L1   AS(SELECT 1 AS c FROM L0 AS A CROSS JOIN L0 AS B),
  L2   AS(SELECT 1 AS c FROM L1 AS A CROSS JOIN L1 AS B),
  L3   AS(SELECT 1 AS c FROM L2 AS A CROSS JOIN L2 AS B),
  L4   AS(SELECT 1 AS c FROM L3 AS A CROSS JOIN L3 AS B),
  L5   AS(SELECT 1 AS c FROM L4 AS A CROSS JOIN L4 AS B),
  Nums AS(SELECT ROW_NUMBER() OVER(ORDER BY (SELECT NULL)) AS n FROM L5)
  SELECT n FROM Nums WHERE n <= @n;
GO

--Create sample table
DROP TABLE IF EXISTS dbo.Order;
CREATE TABLE dbo.Order(
id INT IDENTITY(1,1) NOT NULL,
custid INT NOT NULL,
details NVARCHAR(200) NOT NULL,
status TINYINT NOT NULL DEFAULT (1) INDEX ix1 NONCLUSTERED,
CONSTRAINT PK_Order PRIMARY KEY CLUSTERED (id ASC)
);
GO

-- Populate the table with 2M rows
INSERT INTO dbo. Ord (custid, details)
SELECT 1 + ABS(CHECKSUM(NEWID())) % 1111100 AS custid, REPLICATE(N'X', 200) AS details
FROM dbo.GetNums(2000000);
To simulate a database created with SQL Server 2012, set the compatibility level to 110:
ALTER DATABASE Mila SET COMPATIBILITY_LEVEL = 110;
Now, you will enable and configure Query Store for the database. It will accompany you in your migration adventure. The following statement enables and configures Query Store for the sample database:
ALTER DATABASE Mila
SET QUERY_STORE = ON
    (
      OPERATION_MODE = READ_WRITE,
      INTERVAL_LENGTH_MINUTES = 1
    );
You can check the status and configured parameters of your query store by using the following view:
SELECT * FROM sys.database_query_store_options;
The following screenshots shows Query Store configuration, done by the previous command.
Figure 9.4: Check Query Store Configuration
As you noticed, in this example you have used minimal value (one minute) for the parameter INTERVAL_LENGTH_MINUTES. This is done for demonstration purposes; you want to see collected data immediately. On the production system, this action can generate a lot of runtime statistics rows and could mean, for instance, that data is available for the last few hours only.
After you have enabled and configured Query Store, it immediately starts to collect information about executed queries. You can now simulate a workload by executing a sample query against the table you have created at the beginning of this section.
To simulate a database workload, you will execute one simple query. Ensure that the database is in the compatibility mode 110, and that the Query Store is clean in order to track your queries easily:
ALTER DATABASE Mila SET COMPATIBILITY_LEVEL = 110;
ALTER DATABASE Mila SET QUERY_STORE CLEAR;
Run this code to execute one statement 100 times, as shown in the following command:
SET NOCOUNT ON;
SELECT id, custid, details, status FROM dbo.Orders WHERE status IN (0, 2);
GO 100
The above query returns no rows; all rows in your table have 1 as value in the status column. After executing this single query 100 times, you can check what has been captured by Query Store by using the following query:
SELECT * FROM sys.query_store_query;
The query repository contains a single row for each compiled query. You can see in the following screenshot one row representing the query you have executed in the previous step.
Figure 9.5: Check captured queries in Query Store
You have cleared the Query Store before executing the above query, and since you have executed a single query only, Query Store captured only one query. However, you could still get more rows from this catalog view if you run this code when you try code examples from this chapter, because some system queries such as updated statistics could also run at this time. Use the following query to return the query_text beside the query_id for all captured queries in the Query Store so that you can identify your query:
SELECT q.query_id, qt.query_sql_text FROM sys.query_store_query q
INNER JOIN sys.query_store_query_text AS qt ON q.query_text_id = qt.query_text_id;
The preceding query produces the following output:
query_id      query_sql_text
--------      -----------------------------------------------------
1             SELECT id, custid, details, status FROM dbo.Orders
              WHERE status IN (0, 2)
2             SELECT * FROM sys.query_store_query
The catalog view sys.query_store_query contains information about query hash, query compilation details, binding and optimizing, and also parametrization. The full list and description of all attributes of the catalog view you can find in the Books Online at https://msdn.microsoft.com/en-us/library/dn818156.aspx.
The catalog view sys.query_store_query_text contains query text and statement SQL handle for all queries captured in the Query Store. It has only five attributes and is linked to the sys.query_store_query catalog view via the attribute query_id. The full list and description of all attributes of the catalog view you can find in the Books Online at https://msdn.microsoft.com/en-us/library/dn818159.aspx.
For each query, you can have at least one execution plan. Therefore, in the plan repository, at least one entry exists for each query from the query repository. The following query returns rows from the plan repository:
SELECT * FROM sys.query_store_plan;
You can see four plans for four executed queries in the database Mila. The first query is your initial query; the rest are queries against the catalog views as shown in the following screenshot. As mentioned earlier in this section, you can see more entries if you execute the code examples from this chapter.

Figure 9.6: Check captured query plans in Query Store
The catalog view sys.query_store_plan contains information about query plan generation, including the plan in XML format. The full list and description of all attributes of the catalog view can be found in the Books Online at https://msdn.microsoft.com/en-us/library/dn818155.aspx.
Retuning query text beside IDs is always a good idea. Run the following code to show query text info, too:
SELECT qs.query_id, q.query_sql_text, p.query_plan
FROM sys.query_store_query AS qs
INNER JOIN sys.query_store_plan AS p ON p.query_id = qs.query_id
INNER JOIN sys.query_store_query_text AS q ON qs.query_text_id = q.query_text_id;
The output is more user friendly as the following screenshot clearly shows:

Figure 9-7. Check captured queries and query plans in Query Store
As you can see, queries against catalog views are also there, but you are interested in user queries only. For the initial query, you can see that all its executions were done with the same execution plan.
Already here, you can see the first great thing about Query Store. You can identify all queries that are executed with more than one execution plan. Use the following query to identify query_id for queries that have at least two different plans:
SELECT query_id, COUNT(*) AS cnt
FROM sys.query_store_plan p
GROUP BY query_id
HAVING COUNT(*) > 1 ORDER BY cnt DESC;
The query returns no rows in this case, you have simply executed only one query, but this is very useful information: you can instantly identify unstable queries in your system.
In the previous two subsections, you saw two kinds of information: query details and execution plan. Now, it is time for execution statistics parameters. You will query a new catalog view:
SELECT * FROM sys.query_store_runtime_stats;
The output is shown in the following screenshot:

Figure 9.8: Check collected runtime statistics in Query Store
Again, the output generated when you execute the above query can differ from the one shown in Figure 9.8. The catalog view sys.query_store_runtime_stats contains information about the runtime execution statistics information for the query. The full list and description of all attributes of the catalog view can be found in the Books Online at https://msdn.microsoft.com/en-us/library/dn818158.aspx.
Every minute (you have so configured Query Store), one entry per query plan will be entered in this store.
Note
Actually, for each execution plan, you can have more than one entry in the runtime statistics store per unit defined with Statistics Collection Interval option. If all queries were successfully executed, one row will be added to the store. However, if some executions with the same plan were aborted by the client or ended with an exception, you can have more rows representing each execution type. Three execution types are supported:Regular, Aborted, and Exception which means that for each execution plan you can have up to three rows in the runtime statistics store per unit defined with Statistics Collection Interval option.
If you execute the initial query again, say, 200 times:
SET NOCOUNT ON;
SELECT id, custid, details, status FROM dbo.Orders WHERE status IN (0, 2);
GO 200
When you check the runtime statistics, you can see two entries for the same execution plan. In this example, it is plan_id = 1, because it is identified as the plan for the initial query. If you run this code later, your plan_id can be different.
SELECT * FROM sys.query_store_runtime_stats WHERE plan_id = 1;
The following screenshot shows these three entries:

Figure 9-9. Check multiple runtime statistics entries for an execution plan in Query Store
You can see two additional entries with 200 executions and their aggregated statistic relevant execution parameters. You can use this query to see how execution parameters are changing over time.
In previous sections, you saw how Query Store captures and stores data about queries and their execution plans. It is now time to see how Query Store can help you with migration.
To simulate migration to SQL Server 2016, you will now change the compatibility level to 130.
ALTER DATABASE Mila SET COMPATIBILITY_LEVEL = 130;
And execute the initial query:
SET NOCOUNT ON;
SELECT id, custid, details, status FROM dbo.Orders WHERE status IN (0, 2);
GO 100
This time, it will take much longer than the execution under the old compatibility mode; you will see why later. It is clear that a new plan has been created for the query and it is also clear that the old one was better. After the execution is done, you can check query and plan repositories. Since you already know the query_id for the query, you can check the plan repository to confirm that the plan has been changed under the new compatibility mode.
SELECT * FROM sys.query_store_plan WHERE query_id = 1;
The following screenshot shows two entries in the plan repository. You can also see that two plans have been generated with different compatibility modes: 110 and 130 respectively.

Figure 9.10: Check multiple plans for a single query in Query Store
Setting the compatibility mode for the sample database to 130 triggers the generation of new execution plans for queries against this database. Most of them will probably be the same as they were before, but some of them will change. You can expect small or big improvements for most of them, but the upgrade to the latest compatibility mode will introduce significant regression for some queries, as in the sample query in this section. In the next section, you will see how Query Store can help you to solve these issues.
To see how Query Store represents regression, you will use new Query Store node within SQL Server management studio. From four integrated reports, you will choose Tracked Queries as shown in the following screenshot:

Figure 9.11: Tracked Queries report in Query Store section of SQL Server Management Studio
When you click to Tracked Queries, a new window will be opened in SSMS. In the text field Tracking query, enter 1 and click on the button with the small play icon. As mentioned earlier, assume that the ID of your initial query is 1. You will see a screen similar to the one displayed in the following screenshot:

Figure 9.12: Tracked Queries report showing the new execution plan (compatibility level 130)
You can see two different colors for bullets, representing two execution plans used for the execution of the query with the ID 1. The vertical axis shows the average execution time for the plans in milliseconds. It is clear that the yellow plan performs better and that average execution time for the blue plan is significantly increased. In the bottom pane, you can see the execution plan for the selected circle (in this case, this is a plan with the ID 14, which represents the execution plan under the compatibility level 130). The plan uses clustered index scan operator and performs the full scan of the sample table.
When you click on the pink circle in the screen, you get the window shown in the following screenshot:

Figure 9.13: Tracked Queries report showing the old execution plan (compatibility level 110)
You can see the old execution plan that uses nested loop join operator, while the new one has clustered index scan as the main operator, which explains why the old execution plan is better for this high selective query (no rows are returned).
Note
Changes in the cardinality estimator introduced in SQL Server 2014 are responsible for new execution plans in this example. The old CE estimates only one row, while the new CE expects all rows to be returned, which of course, leads to an execution plan with a scan operator. Since the query returns no rows, the estimation done by the old CE is more suitable in this case. The same plan (clustered index scan) would be generated under the compatibility level 120.
Of course, you can get this info by querying catalog views, too. The following query returns rows from the collected runtime statistics for two plans in the Query Store:
SELECT plan_id, CAST(avg_duration AS INT) AS avg_duration, avg_logical_io_reads FROM sys.query_store_runtime_stats WHERE plan_id = 1
UNION ALL
SELECT plan_id, CAST(avg_duration AS INT) AS avg_duration, avg_logical_io_reads FROM sys.query_store_runtime_stats WHERE plan_id = 14;
The output is shown in the following screenshot. You can see that all execution parameters are significantly increased for the second plan:

Figure 9-14. Comparing multiple runtime statistics for two different execution plans
Of course, after migration, you need to fix the regression as soon as possible. It is obvious in this case that the old plan is better: both average execution time and number of logical reads are significantly increased. What can you do with this information? All you want is to have the same or similar execution parameters as you had before the migration. How can you get them back? Here are the steps you usually need to perform prior to SQL Server 2016 when an important query suddenly starts to run slow:
- You need to understand why SQL Server decided to change the plan
- You can try to rewrite the query and hope that the optimizer will choose a better plan or the old plan
- You can apply a query hint to enforce a better plan or the old execution plan
- If you have saved the old plan, you can try to enforce it by using plan guides
All these tasks require time and knowledge for the implementation, and since they include code changes, there is risk that the change will break the application functionality. Therefore, it introduced testing efforts, which means additional time, resources, and money. You usually don't have a lot of time, and company management is not happy when an action requires more money.
As you can guess, Query Store will save you time and money. It allows you to instruct the optimizer to use the old plan. All you have to do is to choose the plan you want to be applied and to click the button Force Plan, and then confirm the decision by clicking on Yes in the Confirmation dialog box as shown in the following screenshot:
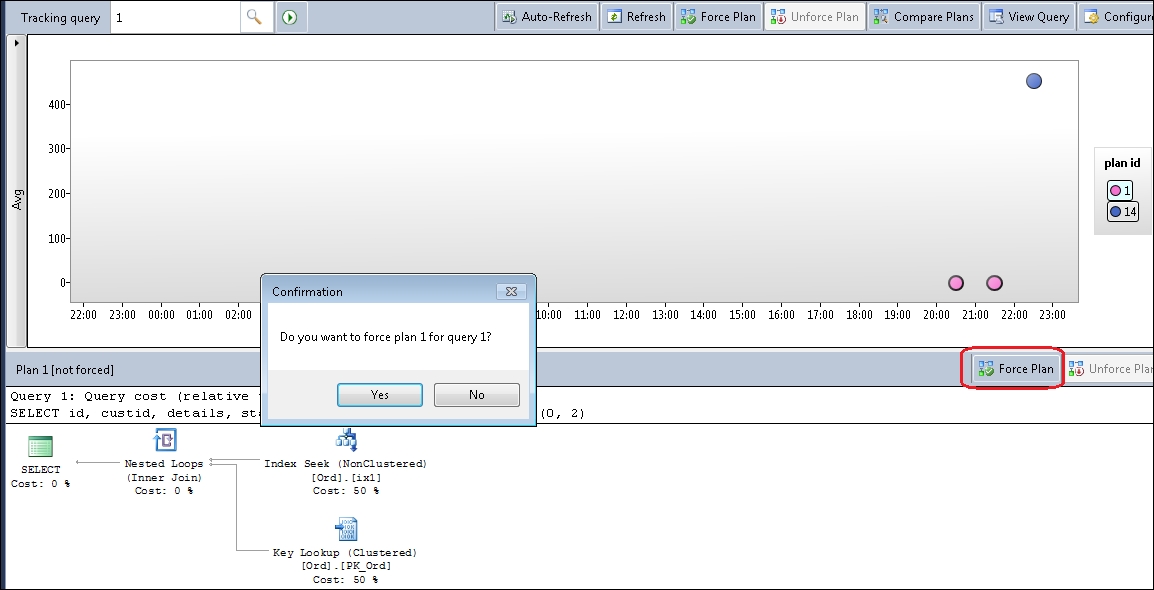
Figure 9.15: Query Store plan forcing
Now, when you execute the query again, you will see the third color with the circle representing the third execution plan as shown in the following screenshot:
SET NOCOUNT ON;
SELECT id, custid, details, status FROM dbo.Orders WHERE status IN (0, 2);

Figure 9-16. Plan forcing in action
The execution is faster, you get the old plan again and there is no risk of a breaking change. And also, you did not spend much time fixing the issue!
You can also force and unforce a plan by using Query Store stored procedures. The following command unforces the execution plan that you forced in the previous step:
EXEC sp_query_store_unforce_plan @query_id = 1, @plan_id = 1;
When you execute the query again, you will see that the plan is not forced anymore and that the execution is slow again as shown in the following screenshot.
SET NOCOUNT ON;
SELECT id, custid, details, status FROM dbo.Orders WHERE status IN (0, 2);

Figure 9-17. Query Store plan un-forcing
Now you can use Transact-SQL to force the old plan again:
EXEC sp_query_store_force_plan @query_id = 1, @plan_id = 1;
When you execute the query again, you will see that the plan is forced again and another circle came to the main pane as you can see in the following screenshot:
SET NOCOUNT ON;
SELECT id, custid, details, status FROM dbo.Orders WHERE status IN (0, 2);

Figure 9-18. Query Store plan forcing
In this section, you saw that Query Store can not only help you to identify performance regressions, but also to solve them quickly, elegantly, and with almost no effort. However, bear in mind that forcing an old plan is a "forever decision"; the plan will always be applied whenever the query is executed. You have to be absolutely sure that you want this when you force the plan.
Note
Forcing a plan will instruct SQL Server to use one plan whenever the query is executed regardless of its costs or improvement in the database engine. However, if the execution plan requires database objects that don't exist anymore (for instance, an index used in the plan is dropped), the query execution will not fail, but a new plan will be generated. The forced plan will be saved and set in the "hold on" mode and will be applied again when the missing object is available.
You should also notice that forcing an old, good looking execution plan in a Query Store report does not guarantee that the execution with it will be better. A typical example would be issues with parameter sniffing, where different parameter combinations require different plans. Forcing an old plan in that case can be good for some parameter combinations only, but for others, it could be even worse than the actual, bad execution plan. Generally, Query Store helps you to solve problems with queries whose execution plans have changed over time but that have stable input parameters. You should not force the old plan for all queries when you see that the old execution parameters look better!
I am using Query Store intensively, and it is an excellent tool and great help for me during query troubleshooting. I have forced an old execution plan several times in the production system to solve or mitigate a significant performance degradation. In my company, the massive workload and peaks happen on a weekend, and if you have an issue on a weekend, you usually want to solve it or find a workaround as quickly as possible. Query Store allows me to force a well-known and good plan and solve the issue temporarily. I review and evaluate it later, during regular working time, without pressure and risk of breaking some applications. Sometimes, I rewrite the code and unforce the plan, sometimes, when I am completely sure that I want exactly the plan that I have forced, I leave it in the production database. When you know what are you doing, you can use all Query Store features. Query Store can save time and money.