
In the previous section, we knew how to select the best hyperparameters for our model. This set of best hyperparameters was chosen based on the measure of minimizing the cross validated error. Now, we need to see how the model will perform over the unseen data, or the so-called out-of-sample data, which refers to new data samples that haven't been seen during the model training phase.
Consider the following example: we have a data sample of size 10,000, and we are going to train the same model with different train set sizes and plot the test error at each step. For example, we are going to take out 1,000 as a test set and use the other 9,000 for training. So for the first training round, we will randomly select a train set of size 100 out of those 9,000 items. We'll train the model based on the best selected set of hyperparameters, test the model with the test set, and finally plot the train (in-sample) error and the test (out-of-sample) error. We repeat this training, testing, and plotting operation for different train sizes (for example, repeat with 500 out of the 9,000, then 1,000 out of the 9,000, and so on).
After doing all this training, testing, and plotting, we will get a graph of two curves, representing the train and test errors with the same model but across different train set sizes. From this graph, we will get to know how good our model is.
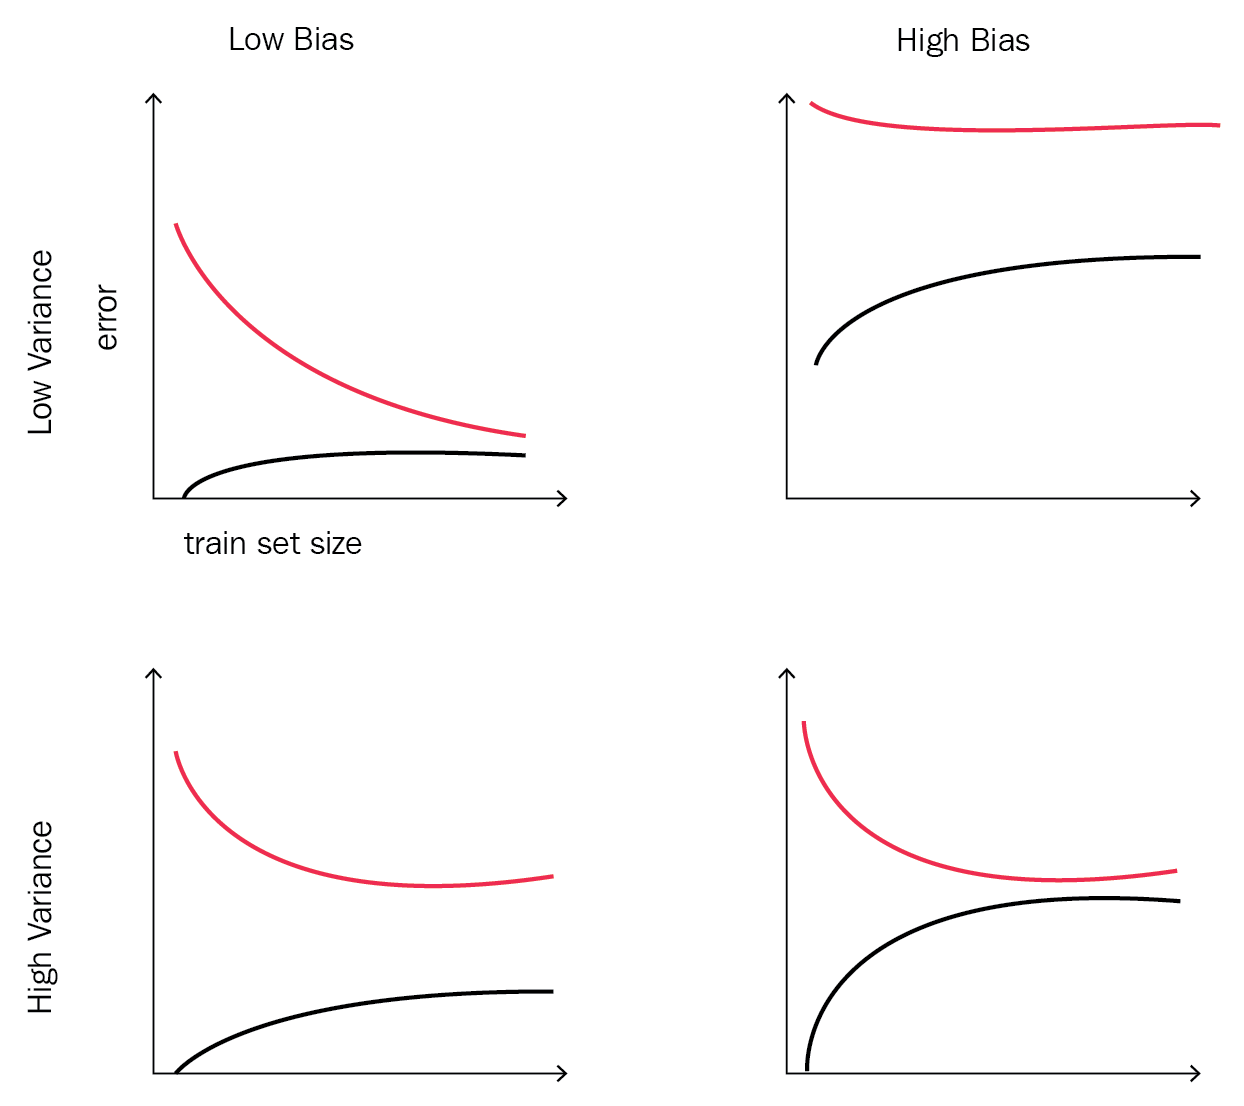
The output graph, which will contain two curves representing the training and testing error, will be one of the four possible shapes shown in Figure 2. The source of this different shapes is Andrew Ng's Machine Learning course on Coursera (https://www.coursera.org/learn/machine-learning). It's a great course with lots of insights and best practices for machine learning newbies:
So, when should we accept our model and put it into production? And when do we know that our model is not performing well over the test set and hence won't have a bad generalization error? The answer to these questions depends on the shape that you get from plotting the train error versus the test error on different training set sizes:
- If your shape looks like the top left one, it represents a low training error and generalizes well over the test set. This shape is a winner and you should go ahead and use this model in production.
- If your shape is similar to the top right one, it represents a high training error (the model didn't manage to learn from the training samples) and even has worse generalization performance over the test set. This shape is a complete failure and you need to go back and see what's wrong with your data, chosen learning algorithm, and/or selected hyperparameters.
- If your shape is similar to the bottom left one, it represents a bad training error as the model didn't manage to capture the underlying structure of the data, which also fits the new test data.
- If your shape is similar to the bottom right one, it represents high bias and variance. This means that your model hasn't figured out the training data very well and hence didn't generalize well over the testing set.
Bias and variance are the components that we can use to figure out how good our model is. In supervised learning, there are two opposing sources of errors, and using the learning curves in Figure 2, we can figure out due to which component(s) our model is suffering. The problem of having high variance and low bias is called overfitting, which means that the model performed well over the training samples but didn't generalize well on the test set. On the other hand, the problem of having high bias and low variance is called underfitting, which means that the model didn't make use of the data and didn't manage to estimate the output/target from the input features. There are different approaches one can use to avoid getting into one of these problems. But usually, enhancing one of them will come at the expense of the second one.
We can solve the situation of high variance by adding more features from which the model can learn. This solution will most likely increase the bias, so you need to make some sort of trade-off between them.