
In Chapter 9, Networking Foundations, we talked about networking fundamentals. If you think of chapter 9 as to how applications talk to each other, in this chapter, we will talk about how applications operate both on servers and as groups in the cloud.
Many people are coming to SRE without much operational experience. In a world with tools like Heroku and Serverless, many developers have not had much experience running servers or even in using Linux or common cloud software. The hope is that after this chapter, any fear of Linux or the cloud will be dissipated or you will at least have a base lexicon to do more research.
Many of the pieces introduced in this chapter will help you with an SRE interview where you need to troubleshoot issues on a Linux machine or design architecture for a larger application. After we close out Linux and cloud fundamentals, we will walk through an example architecture question and how you could possibly answer it.
Linux is a group of operating systems. Originally released in 1991 by Linus Torvalds, Linux has grown to be the de facto operating system of servers. The Linux foundation claims that Linux servers were almost 80% of all servers running in 2014 (https://www.zdnet.com/article/linux-foundation-finds-enterprise-linux-growing-at-windows-expense/). Linux also goes by the name GNU/Linux, because the GNU project created a lot of the utilities bundled with the Linux kernel in most Linux operating system distributions. This is all just dogma though. The key is that the Linux kernel has a few basic tenants and is pretty consistent between distributions. Whether you use Fedora, Centos, Debian, Ubuntu, Arch, or something else, the following section should introduce you to the basics of your operating system.

Figure 1: A kernel is the core part of an operating system. It tends to provide the base interface to all hardware of a computer, especially in terms of managing CPU time and memory allocation. The user space is the place where all applications and non-kernel code runs. The kernel provides boundaries between user space applications, as well as common interfaces for those applications to talk to each other.
Note
The Free Software Foundation (FSF) is a non-profit organization focused on maintaining and promoting open-source software. The FSF is the maintainer of a popular open source license, the GNU General Public License (GPL). It also holds the copyrights on a lot of GNU and organizes contributions to parts of the GNU project. GNU stands for GNU is not Unix.
One of the greatest parts of Linux is that everything is a file. It is one of the core philosophies of the kernel and makes for a lot of interesting uses, as you can write to things such as devices, settings, sockets, and other things as if they were a normal file. An example of this was shown in Chapter 9, Networking Foundations, where we wrote output to /dev/null, which is a device that acts as a black hole. In the following section we will give examples of different parts of Linux that act like files and how you can manipulate them.
The first thing that is a file, is a file! A basic file in Linux is just a selection of bytes. How Linux actually makes files usable is using what are called inodes. Inodes are a data structure that store all of the metadata about a file (https://www.tldp.org/LDP/tlk/ds/ds.html and http://pubs.opengroup.org/onlinepubs/009695399/basedefs/sys/stat.h.html):
- Two device identifiers: One is the filesystem on which this inode is located, while the other only exists if this is a special device and points to the physical hardware identifier.
- A unique file serial number.
- File mode defining access permissions.
- A count of how many hard links point to the inode (if zero, the file is ready to be deleted).
- The user and group identifiers of the file's owner.
- Timestamps:
- ctime, inode change time
- mtime, file modification time
- atime, file last access time
- The size of the file in bytes
Each file on a disk has an inode and to see a file's inode, you can run the command stat. The stat command lets you read all inodes. When you run ls to output all files in a directory, you are reading an inode table, which is all that a directory is. Each inode table has two special files, . and ... The . file is the inode for the current directory and .. is the inode for the parent directory.
The entire Linux filesystem is a tree, where every node in the tree is an inode. Multiple entries in an inode table can link to a single file, which is why an inode includes a link count. When the link count reaches 0, the file is deleted.
As mentioned in the preceding section, each file has permission bits. Two fields are the owner and group, which are specified by an integer ID. They can be changed with the chown command. Three bytes (also known as octal numbers) specify who can read, write, and execute a file. The first byte is for the user who owns the file, the second byte is for the group that owns the file, and the third byte is for others. Each byte is a number of 0 to 7:
- The read permission adds 4
- The write permission adds 2
- The execute permission adds 1
So, a file that everyone can read, write, and execute has the permissions of 0777. This is often also displayed as -rwxrwxrwx. Another common permission is 0640. This is -rw-r-----, which means the user can read and write, the group can read, and others cannot access it at all.
On most Linux operating systems, the front bit is for the sticky bit, which lets executables and directories control who can change their links in the inode table and if a file can change the permissions of the user running the file. You'll notice the zero at the front of these three numbers. This is the setuid bit. This octal is used for files that when executed will run as if they are the owner of the file instead of the user running them. If the octal equals four, the process gets the permissions of the user. If two, the process gets the group permissions. If six, the process gets both. This is useful but incredibly dangerous. If a file has the setuid octal set, and is owned by root, no matter who executes it, the process is run as if root was running it. You can also set the bit to one on directories, which prevents people from moving or removing files in the directory that they do not own. This is called the sticky bit.
Sockets are also files. Sockets are network connections that you can read from and write to as if they are a normal file. When created, they specify a network protocol and a destination. Sockets are given socket numbers, but that number can only be referenced on the same machine. On most systems, that number is randomly generated by the kernel.
A socket is often viewed in a similar way to a pipe in a shell. In your Terminal, you can, for instance, write cat file.txt | sort. This will take the contents of file.txt and write them to standard out. The pipe (|) will then connect the standard out of the first program (cat) to the second program's standard in (sort). The content finally written to the Terminal, from standard out, will be the standard out from sort. In the networking world, a socket is just that: it receives input, deals with the network connections, and then on the other side of the connection, the receiver can read out of a different socket to get the data.
For the simplest of examples, you can read from a socket in your command line. If you use Bash, it will automatically dynamically create sockets on the following path: /dev/{protocol}/{host}/{port}. If you use any other shell, you will need to use nc (which we discussed in Chapter 9, Networking Foundations) to open a socket. The United States Government operates the simplest server to show this: the National Institute of Standards and Technology (NIST) Internet Time Service. This service, when a connection is made to it on port 13 at time.nist.gov, will return the current time:
$ cat < /dev/tcp/time.nist.gov/13
58298 18-06-29 04:09:39 50 0 0 689.3 UTC(NIST) *

$ echo "" | nc -4 time.nist.gov 13
58350 18-08-20 00:55:38 50 0 0 643.1 UTC(NIST) *
You can also send an HTTP request by opening a socket with an HTTP server on port 80:
#!/bin/bash
exec 100<>/dev/tcp/hello.natwelch.com/80
echo -e "GET / HTTP/1.1
Host: hello.natwelch.com
Connection: close

" >&100
cat <&100
In the preceding script, exec 100<>/dev/tcp/hello.natwelch.com/80 is assigning file descriptor 100 as a read and write socket to port 80 on hello.natwelch.com. >&100, is taking the output from the echo command and writing it to file descriptor 100, instead of standard out (file descriptor 1). Then the cat command is reading the content off file descriptor 100 with <&100. When we run this script, we get a response from the server printed to standard out:
$ ./hello.sh
HTTP/1.1 200 OK
Content-Security-Policy: default-src 'self'
Content-Type: application/json
Referrer-Policy: same-origin
X-Content-Type-Options: nosniff
X-Frame-Options: DENY
X-Xss-Protection: 1; mode=block
Date: Fri, 29 Jun 2018 04:20:52 GMT
Content-Length: 35
Via: 1.1 google
Connection: close

{"status":"ok","msg":"Hello World"}
If we wanted to implement something similar to the NIST time server, we could do so in Go. We could write this in any language, but Go makes it pretty easy to read.
package main

import (
    "log"
    "net"
    "time"
)

func main() {
    // We could run on any port. Here we are running on 13 to match the DAYTIME
    // standard as described in RFC 867.
    port := ":13"
    tcpAddr, err := net.ResolveTCPAddr("tcp", port)
    if err != nil {
        log.Fatalf("resolve addr: %+v", err)
    }

    listener, err := net.ListenTCP("tcp", tcpAddr)
    if err != nil {
        log.Fatalf("listen: %+v", err)
    }

    for {
        conn, err := listener.Accept()
        if err != nil {
            log.Printf("connection open: %+v", err)
            continue
        }

        go Handle(conn)
    }
}

// Handle does two things, log when it receives a connection, and writes the
// current time to the connection and closes it.
func Handle(conn net.Conn) {
    now, err := time.Now().MarshalText()
    if err != nil {
        log.Printf("get time: %+v", err)
    }

    conn.Write(now)
    conn.Close()
}
The preceding code is broken into two functions. The main() function is the beginning of the program and it opens a listener on port 13. It then starts an infinite loop waiting for connections on port 13. For every connection, it creates a new thread (with go) and runs the function Handle(conn net.Conn) in it. Handle doesn't bother to read the connection: it just writes the current time to the connection and closes the connection.
If in one Terminal you run $ sudo go run timeServer.go with the preceding code, and then access it as we did the NIST server, you get the current time. We have to run the code with sudo because only the super user (also known as root) can create services on ports 1 to 1024. An example of querying our server, first with Bash and then with nc:
$ cat < /dev/tcp/127.0.0.1/13
2018-06-29T04:47:00.398289971Z
$ nc 127.0.0.1 13
2018-06-29T04:48.357276832Z
As we've mentioned a few times, /dev is a directory on most Linux systems, with files for each device connected to the machine. Each hard drive and hard drive partition has a file. All sorts of things exist in here and each one is special and unique.
Devices are often dependent on the Linux distribution (which can name things differently) and also on what physical devices are attached.
Kernel modules are pieces of software that can be added to a kernel both when it is compiled as well as during runtime with the modprobe command. Modules are like Window's device drivers and change how the operating system interacts with physical hardware or creates virtual devices for the operating system to use.
When you enable a module, it may add support for a new webcam, add a new filesystem, or add a new backdoor into your operating system. Now, because all modules are part of the kernel, they can often do dangerous things. A classic experiment is writing a module that creates a device where if you write a process id into it, the module will change what user is running that process. This could be incredibly dangerous because it would let a user turn their shell into a root shell, which would have permissions to do just about everything. So, because of this danger, many files in /dev are only writable or readable by the root user.
The proc filesystem (procfs) is a virtual filesystem that presents itself as a series of files that live in the /proc folder. Each process running in the operating system has a directory. For example, earlier when I was running the time server, I ran ps aux | grep go to find the running process (I could have also run pgrep go) and get its process ID. That ID was 9170. There is a folder at /proc/9170/ which contains all the information the operating system knows about the process.
Proc also contains things like /proc/cpuinfo, which provides information about every CPU core in a machine. /proc/uptime, /proc/diskstats and many others exist to provide system-level information to users and applications. Some even let you write settings into them. /proc/sys has all sorts of settings you can change. An old Thinkpad laptop I had even let you control the fans by writing integers into /proc/acpi/ibm/fan.
Not all systems have a procfs. OS X infamously does not have /proc. It also isn't Linux, but rather based on BSD, another Unix. Most Linux systems do, as they are based on versions of Unix that had them.
Okay, this is going to be really quick, but this is the classic Linux filesystem layout:
/binholds the executables everyone can use/bootholds files related to starting the computer/devholds all of the devices/etcholds global configuration files/homeholds the user directories that often include a user's personal files/libholds libraries/mntis a common place for mounting file systems/procis system information fromprocfs/rootis the home directory for the root user/sbincontains executables for the root user/sysis also system information but usingsysfs/tmpis temporary files, usually mounted on a ram disk/usris user libraries and binaries/varis runtime files, including logs, caches and other things
Other folders may be in the root of your filesystem (/), but the preceding are the common ones. There is a common standard, the Filesystem Hierarchy Standard, but it's not always followed closely.
A process is a human inside of the Matrix. Jokes aside, a process is a running program on a computer. Put another way, it is an instance of a running program loaded in memory. Every process has an ID greater than one because in Linux, every process knows what process started it. The first process that starts when the computer boots is init. Then init spawns children processes, which can then also create children, creating a gigantic tree of processes. To create a child, a process must first run fork(), a system call that creates an identical process belonging to the caller (note that fork() is actually a wrapper around clone() in Linux, but it serves the same purpose). Processes then often call exec() (or one of its many variants) to run a separate process in place of themselves.
Every Linux process has information about who started it, its file descriptors, its current state, its current working directory, and other metadata.
A zombie process is a process in Linux that is common but rarely seen. It is a process which is no longer running, but its state information has not been cleaned up. This is usually because the parent process did not wait for the process to collect its state information. Its state is halted or dead, and yet it still shows up as existing in the operating system. It is rare that you will see one of these processes exist for a long time because they will often be cleaned up (or reaped) by init or the parent process.
As all processes have parents, when a parent process dies, and does not stop its children processes, its children processes become orphans. Orphans are automatically reparented to init. Even though after this reparenting happens all processes have a parent of ID one, they are still called orphans because they had to be reparented.
nice is a command and piece of metadata that tells the Linux scheduler how important a task is. Note this only applies to tasks and processes in user space. Nice values will not affect kernel space. All programs by default have a nice value of zero and everything at the zero level is treated equally. The higher the nice value, the less important the process. Nice values range from -20 to 19.
When two equal priority CPU-bound processes are running at the same time on a single-core Linux machine, the ratio of each one's share of the CPU time will be (20 − niceA) / (20 - niceB). So, a process run with nice value of 15 will receive 25% of the CPU time compared to a process with nice value of 0: (20 − 15) / (20 − 0) = 0.25.
There are a lot of system calls on an operating system and you can view a list of all of them by running man 2 syscalls:
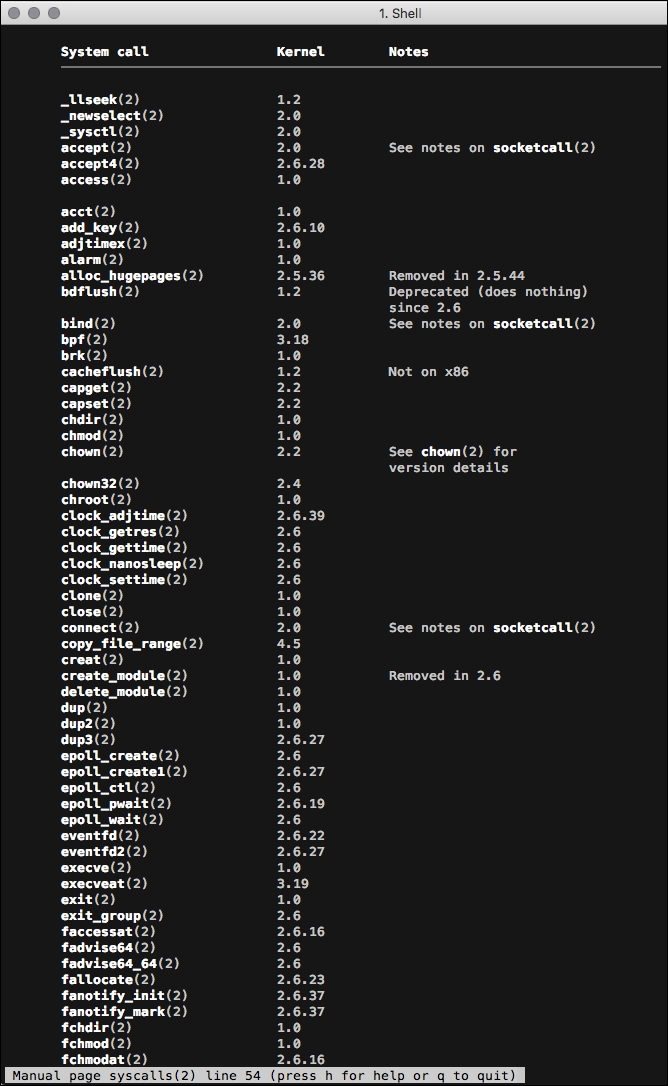
Figure 2: A snapshot of the syscalls man page. Each row specifies a syscall, what man section it is documented in, and what Linux kernel version it was introduced in.
A system call is a low-level function in the kernel which you can call to signal the kernel to modify the system in some way. The classic ones are fork, read, write, exec, open, and exit.
As I mentioned, the man command can give you access to the manual pages. Section 2 of the man pages provides documentation for syscalls. Not only does it provide a list of syscalls, it also describes how to call each one from the programming language C, which the Linux kernel is written in.
strace is a tool that lets you see all of the syscalls being made when you run software. There is also dtrace, which is more powerful, but not as common on Linux. You can do lots with strace to see how things are operating. The most basic action is to just run strace ls, which will run ls to list all of the current files in a directory. I won't paste the output because ls actually does a lot of system calls, but with the -e flag you can limit the output to only a subset of syscalls. For example, fstat is how programs find out about files on a filesystem. With this, we can just show the fstat calls ls makes.
$ strace -e fstat ls -l /tmp
fstat(3, {st_mode=S_IFREG|0644, st_size=58176, ...}) = 0
fstat(3, {st_mode=S_IFREG|0644, st_size=154832, ...}) = 0
fstat(3, {st_mode=S_IFREG|0755, st_size=2030544, ...}) = 0
fstat(3, {st_mode=S_IFREG|0644, st_size=464824, ...}) = 0
fstat(3, {st_mode=S_IFREG|0644, st_size=14560, ...}) = 0
fstat(3, {st_mode=S_IFREG|0755, st_size=144976, ...}) = 0
fstat(3, {st_mode=S_IFREG|0444, st_size=0, ...}) = 0
fstat(3, {st_mode=S_IFREG|0644, st_size=3004224, ...}) = 0
fstat(3, {st_mode=S_IFREG|0644, st_size=2995, ...}) = 0
fstat(3, {st_mode=S_IFREG|0644, st_size=26376, ...}) = 0
fstat(3, {st_mode=S_IFDIR|S_ISVTX|0777, st_size=4096, ...}) = 0
fstat(4, {st_mode=S_IFREG|0644, st_size=545, ...}) = 0
fstat(4, {st_mode=S_IFREG|0644, st_size=58176, ...}) = 0
fstat(4, {st_mode=S_IFREG|0644, st_size=39744, ...}) = 0
fstat(4, {st_mode=S_IFREG|0644, st_size=58176, ...}) = 0
fstat(4, {st_mode=S_IFREG|0644, st_size=47576, ...}) = 0
fstat(4, {st_mode=S_IFREG|0644, st_size=97176, ...}) = 0
fstat(4, {st_mode=S_IFREG|0644, st_size=47568, ...}) = 0
fstat(4, {st_mode=S_IFREG|0644, st_size=1964, ...}) = 0
fstat(4, {st_mode=S_IFREG|0644, st_size=925, ...}) = 0
fstat(3, {st_mode=S_IFREG|0644, st_size=578, ...}) = 0
fstat(1, {st_mode=S_IFCHR|0620, st_rdev=makedev(136, 2), ...}) = 0
total 12
fstat(3, {st_mode=S_IFREG|0644, st_size=3545, ...}) = 0
fstat(3, {st_mode=S_IFREG|0644, st_size=3545, ...}) = 0
drwx------ 3 root root 4096 Jun 25 15:48 systemd-private-49929b2b26cc4098a09b442d3eb837be-redis-server.service-7r6jlE
drwx------ 3 root root 4096 Jun 25 15:48 systemd-private-49929b2b26cc4098a09b442d3eb837be-systemd-resolved.service-UzIJL3
drwx------ 3 root root 4096 Jun 25 15:48 systemd-private-49929b2b26cc4098a09b442d3eb837be-systemd-timesyncd.service-eBayRt
+++ exited with 0 +++
Here we can see ls calling fstat for every folder in /tmp, and all of the links they have.
Next, we can have strace record all syscalls made by a running process. In the following example, -c tells strace to summarize all syscalls it saw. -p 5765 tells strace to attach to the process and record syscalls made. When we run this command, strace runs with no output until we hit Ctrl + C, which is the classic terminate keyboard command. strace then prints the output. In this case, process ID (pid) 5765 is rsync downloading some files from another server, so most of the calls are to write.
$ sudo strace -c -p 5765
strace: Process 5765 attached
^Cstrace: Process 5765 detached
% time     seconds  usecs/call     calls    errors syscall
------ ----------- ----------- --------- --------- ----------------
 34.58    0.004667         203        23           write
 33.80    0.004562          15       300           select
 31.41    0.004240          14       300           read
  0.21    0.000028           7         4           ioctl
------ ----------- ----------- --------- --------- ----------------
100.00    0.013497                   627           total
Two common tools for seeing what is running on your computer are top and ps. top is a real-time dashboard of everything running on the processor right now. ps is a snapshot of all currently running processes.

Figure 3: A screenshot of top running on a Linux server
top has a lot of information in it, including uptime, load averages, user counts, process CPU usage, memory usage, process nice values, and lots of other things.
I often run ps with the argument aux. Interestingly, I've always just viewed those flags as what's needed to see every running process. I recently found out (from reading the man pages), that arguments without a flag on ps are from the older BSD version of the command. BSD is another Unix-based operating system (similar to Linux but often very different).
According to the man page, a and x show all processes. a shows all processes with a TTY attached and x shows all processes that do not have a TTY attached. u changes the output format to be easier to read. To get a similar output, you can also run ps -ef which is the new format of arguments for Linux.
I mentioned load averages in the preceding section. You can see these in top or just run the uptime command.
$ uptime
 23:16:07 up 5 days,  7:27,  1 user,  load average: 0.04, 0.09, 0.07
From left to right, we have the following:
- The current time
- An uptime of five days, seven hours and 27 minutes
- One user currently connected
- Three load averages: 1 minute, 5 minutes, and 15 minutes
These three load averages are the Linux system load averages. They are the average system load over a given period of time. You can also see these in /proc/loadavg:
$ cat /proc/loadavg
0.10 0.11 0.09 1/230 23457
The number is how many processes were using how many CPU cores during that time period. This is actually an over simplification (http://www.brendangregg.com/blog/2017-08-08/linux-load-averages.html). Instead, on Linux, the system load average is a five second sliding window over a time period of running tasks and uninterruptable tasks. These uninterruptable tasks could be writing to disk, memory modification, changing swap, scheduler calls, and all sorts of other system calls.
Running tasks are just normal running processes, but, for the sake of simplifying how we think of it, if the one-minute load average is 1.0 on a single core CPU, we can roughly assume no programs were waiting for CPU resources. If there were two cores, 1.0 would mean that one core was sitting idle for the minute. You can find out how many cores there are available by running nproc, lscpu, or cat /proc/cpuinfo.
So, if you have a load average output of 1.00, 10.09, 100.00 on a four-core machine, it would mean you are just coming off a massive spike of load. Over the last minute, three cores were sitting idle on average. Over the last five minutes, though, the system was overloaded by 609%. Six cores of work were waiting to be done on average. Over the last fifteen minutes, things were really bad: the system was 9600% overloaded or there was, on average, 96 cores worth of work waiting.
There is a lot more we could talk about with Linux fundamentals, but there are many books you could read and also lots of experimentation you could do. I suggest you check out the following programs by reading their man pages and exploring how they work:
dfgrepsortandshufdumounttail & headsursyncstattimedate
All of these tools, plus the ones we mentioned earlier throughout the chapter, are simple. They do one or two things and do them well. This is part of the Unix philosophy. The Unix philosophy, as defined by Doug McIlroy (an early engineer at Bell Labs) in 1978 [3] is as follows:
- Make each program do one thing well. To do a new job, build afresh rather than complicate old programs by adding new features.
- Expect the output of every program to become the input to another, as yet unknown, program. Don't clutter output with extraneous information. Avoid stringently columnar or binary input formats. Don't insist on interactive input.
- Design and build software, even operating systems, to be tried early, ideally within weeks. Don't hesitate to throw away the clumsy parts and rebuild them.
- Use tools in preference to unskilled help to lighten a programming task, even if you have to detour to build the tools and expect to throw some of them out after you've finished using them.
With these four mentalities, you can think about how to possibly write software. With the base knowledge so far in this chapter, plus other research, I recommend that you try reimplementing some of this software in the language of your choice. One of the best ways, in my experience, to learn something, is to try to imitate it. Some example things you might try are as follows:
- Try building a very simple shell that can just take in commands and execute them. Then try adding pipes to send output from one command to another.
- Try building a load average calculator.
- Try building a very simple replica of
psthat just displays your users currently running commands. - Write your own version of ping.
- Write your own version of
du.
All of these tasks are doable by one person. It may take time to figure out the right system calls and get the edge cases correct, but you'll learn a lot in the process. Linux was originally created by someone who just wanted to try building an operating system and you can totally carve off a task, and try to replicate a piece.