
Chapter 8: Observability with NATS in a Microservices Architecture
Observability is a characteristic of a platform that defines how well the internal states of a system can be inferred from the knowledge of its external outputs. A platform without proper observability is hard to recover and troubleshoot when things do not go as expected. In a world of distributed systems, failure is inevitable, and systems need to be designed in such a way that they can withstand failures. It is the responsibility of each microservices team to have proper observability in their implementations and share a common set of tools to monitor the applications.
Given that a microservices architecture encourages building more services, it becomes a challenge to build correlations among messages when communicating across multiple services. With the usage of NATS for interservice communication, it becomes important that the NATS server has proper mechanisms to monitor the message interactions. Since all the messages are transferring through the NATS server, having proper observability is crucial in recovering quickly and reducing business impact in failure scenarios.
In this chapter, we are going to discuss the following main topics:
- Observability in the microservices context
- Observability features of NATS
- How to use NATS observability in a microservices architecture
By the end of this chapter, you will understand the concept of observability in a microservices context and how to build an observable microservices architecture with the help of the NATS platform.
Technical requirements
In this chapter, we will be configuring the NATS server to enable observability of the interservice communication and improve our sample microservices to include observability features. The following software components need to be installed to try out the examples mentioned in this chapter:
- The Go programming language
- The NATS server
- Prometheus
- Grafana
- Loki and Promtail
The source code of the examples used in this chapter can be found at https://github.com/PacktPublishing/Designing-Microservices-Platforms-with-NATS/tree/main/chapter8.
Observability in a microservices context
In the first few chapters of this book, we discussed the advantages of a microservices architecture and how it allows applications to be developed as a set of independent components that work cohesively. However, we have overlooked one thing, which is the complexity it adds to the process of monitoring and recovery from failure. One thing that we want to make clear at the beginning of this chapter is that monitoring is not the same as observability. While observability is a feature of the overall system, monitoring is a process that we execute to capture the details (external outputs). Having said that, both observability and monitoring are interconnected.
In a monolithic application, it is not that difficult to identify the root causes of a failure since there is only one place to look. From that place, we can dig into the details and identify the root cause. In the real world, this may not be as easy as it sounds. But comparatively, it is much easier than with microservices where you have tens, hundreds, or even thousands of services that can cause the issue and you have no idea where to begin. In both scenarios, having proper observability in the service (monolith) or services (microservices) is critical in identifying the root cause of a failure.
Let's first identify what aspects we need to monitor in a microservices (or any distributed application) architecture that would help us to keep the system available and avoid any business impact, or to minimize downtime. Here is a list of things that we should monitor:
- Server (host) monitoring: This is about monitoring the status of the server so that it is performing at a good level without underutilization or overutilization. We can monitor the CPU usage, memory usage, and load average on the server against a certain threshold value. Typically, we consider a server as overutilized if the CPU usage goes over 60–70%.
- Application (microservices) monitoring: This is where we monitor the application-level statistics (metrics), such as latency, error rates, and request rates, so that we can make decisions on when to scale out the services based on the demand from the consumers.
- Log monitoring: This is where most of the observability-related information is monitored and accessed. Microservices will utilize logging to output the details of the system state via different log entries using different categories, such as INFO, ERROR, and DEBUG, which will then be used to infer the state of the system and identify the root causes of failures.
- Health monitoring: This is where the application's health is monitored continuously through heartbeats, alerts, and notifications. The heartbeat check is the monitoring endpoint used by front-facing components such as load balancers to verify the availability of the server or the service itself. In most cases, this is a separate endpoint per server and/or per service that responds immediately with a simple response so that the client (for example, a load balancer) can verify the status. These health checks are run periodically at the load balancer level so that it routes the requests only to the available services. In addition to the heartbeat check, there are mechanisms used by applications to monitor abnormal activities such as high CPU usage, high memory usage, and frequent error logs. They then generate alerts and notifications so that the operations teams can take action on those notifications to rectify the system and avoid future failures.
If we think about building a distributed application with a couple of microservices running on a couple of servers, monitoring the overall system may not be that hard. But in the real world, we need to design applications that span across tens or hundreds of servers. Microservices architecture is designed to support that level of scalability based on consumer demand.
In such a scenario, let's discuss how observability and monitoring can be implemented so that we have a better chance of recovering quickly from failures. The following figure depicts a typical microservices-based deployment with the monitoring aspects that we discussed in the previous section:

Figure 8.1 – Monitoring a microservices-based platform
The preceding figure depicts a use case where a microservices-based application is deployed in a typical virtual machine (VM) or physical hardware-based environment. In this scenario, multiple copies of the same microservice are deployed in different servers to fulfill the availability and scalability demands.
The load balancer is used to distribute the load among different instances of the microservices, and it contains a health monitor task that verifies the health of the servers as well as the health of the individual microservices by calling the health check APIs. Typically, this API is implemented by each microservice in a different context, such as /healthz, so that the load balancer can periodically check the status of the service.
The server monitoring needs to be done at a central place so that the operations teams can identify the status of the overall deployment and take actions on individual servers accordingly based on the overall demand of the consumers. Here the details are monitored per server, such as CPU, memory, and load average.
To reduce the complexity of Figure 8.1, we have kept the application or microservices monitoring and centralized logging components in the same box. These two components can live as separate components in real-world applications if required. Centralized logging allows us to manage the observability information in a central place and perform common operations that are typically required for troubleshooting.
Instead of using different tools for different microservices, all the teams can agree on a single logging technology and a standard logging format so that correlating the logs is easier when things start to fail at the application level. These logs need not be written to the same log files by different microservices. But all the microservices can use a common correlation ID when printing log entries and pass it through the message body or as a header to the next microservice, so that each microservice is aware of this common ID.
This correlation ID can come in a request or a header from the client. If it is not available, then each microservice can check the availability of the ID and generate it, and pass it to the subsequent services down the line so that they can reuse that ID. In addition to that, each microservice instance can have its own unique ID so that debugging and troubleshooting becomes much easier. The following figure depicts a scenario where the CorrelationID identifier sent by the client is used to enable observability for microservices:
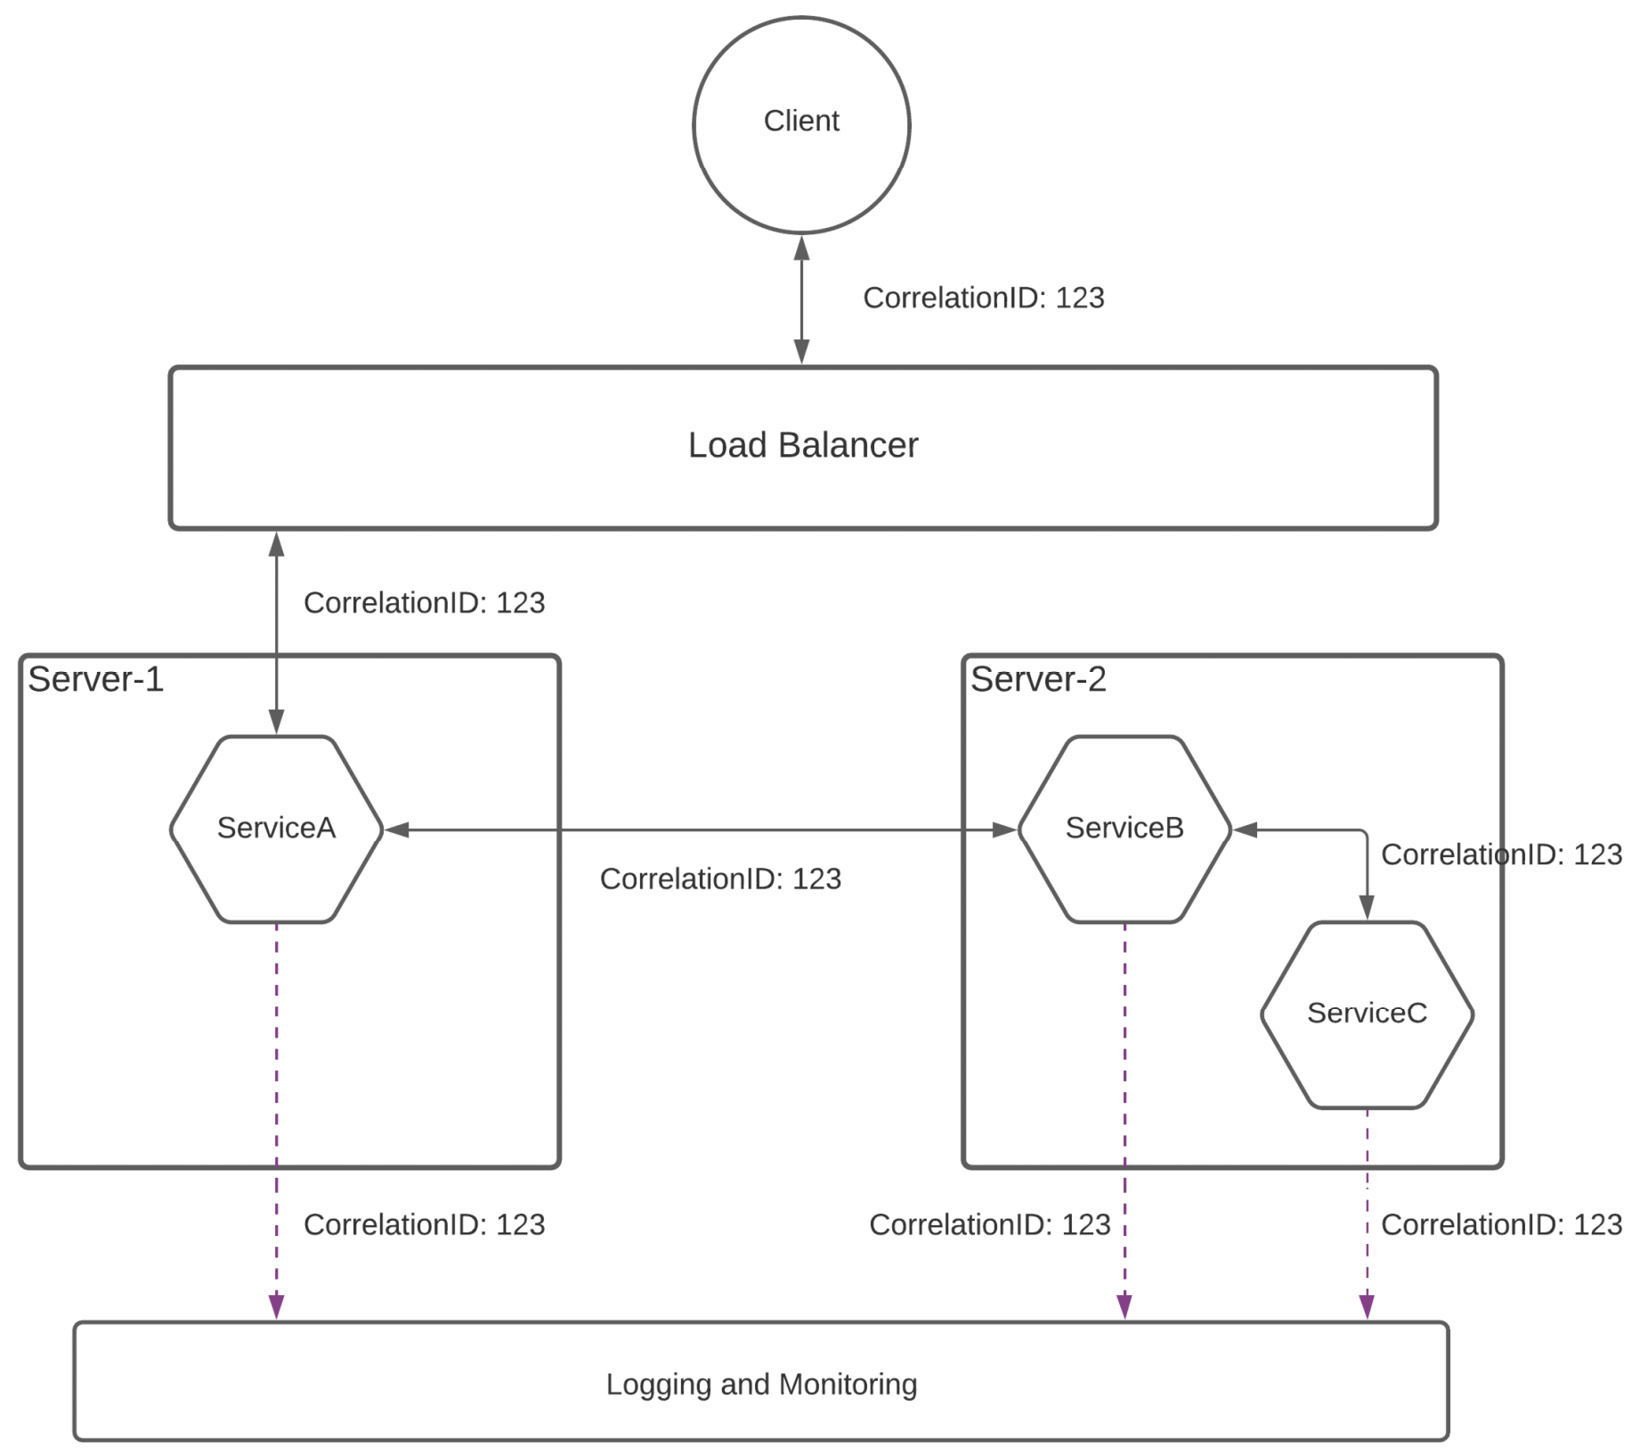
Figure 8.2 – Microservices observability with CorrelationID
As depicted in the preceding figure, the client sends a CorrelationID identifier with the value 123 to the load balancer and it passes that through to the microservices layer. In the microservices layer, ServiceA uses that value to print logs if required and pass it to the ServiceB where it does the same and passes it to ServiceC. If something goes wrong at any of the microservices, we can trace back the request with a CorrelationID identifier and find out the erroneous microservice, and then take actions to fix it. Given that we have a direct correlation with the client in this scenario, we can take actions such as message replay in this scenario.
If the client is not interested in sending a CorrelationID identifier, then ServiceA can generate the ID and pass that to ServiceB so that the remaining process that is depicted in Figure 8.2 is executed. In this scenario, we won't be able to replay the messages since we don't have a direct mapping of client messages along with the internal CorrelationID identifier. But this is enough for most applications.
The usage of CorrelationID is a common practice that can be used in different deployment environments, including VMs, physical data centers, and containerized deployments. Containerized environments provide observability features that are built into the platform so that users can utilize those in addition to the features implemented at the application level. Given that microservices are often deployed in containerized environments, the following section provides a brief overview of observability in containerized deployments.
Observability in containerized deployments
Given the fact that microservices-based solutions are often deployed in containerized environments (for example, Docker) with container orchestration platforms such as Kubernetes, the monitoring of underlying server or VM infrastructure is abstracted away from the users. As an example, Kubernetes provides its own cluster monitoring and managing dashboards so that users can easily monitor the server-level details without using any additional tools.
In Kubernetes, each microservice runs on a separate Pod, and monitoring of the Pod-related activities is done through the monitoring tools provided by Kubernetes itself. It also provides the ability to configure server health checks with its liveness and readiness probes so that load balancers can verify the availability of the Pods that run microservices internally. But still, the application-level monitoring and log monitoring needs to be handled separately similar to what we discussed in the previous section with the usage of CorrelationIDs.
Best practices for microservices observability
Based on what we have discussed so far, we can identify a set of following best practices when implementing observability for microservices-based platforms:
- Instrument microservices code as much as possible with contextual details so that the failures can be traced back.
- It is always better to use CorrelationIDs when network interactions are happening in the code and put these details into a context.
- Always structure data that communicates over the wire and adheres to a common standard (for example, Javascript Object Notation (JSON)).
- Start instrumentation from the get-go and keep improving as the code becomes larger and complex. It is hard to introduce instrumentation at a later stage when the code becomes too large.
- Use log levels such as INFO, DEBUG, WARN, and ERROR to categorize log entries based on their severity.
- Use asynchronous logging mechanism so that the execution performance of the main program is not impacted by the logging.
- Emit log events with useful contextual information so that the person who reads these log entries can get value out of them.
So far, we have discussed the observability and monitoring aspects of microservices in general. In the upcoming sections of this chapter, we will discuss how NATS supports observability and helps us build the microservices architecture based on the NATS messaging platform.
Observability features of NATS
NATS provides two main methods to monitor the behavior of the NATS servers. Those are the following:
- Logging
- Monitoring
The internal implementation of the NATS server is done with a lot of instrumentation so that the users of the NATS server can monitor the servers in any deployment scenario. Let's discuss these options with a few examples.
Logging
Logging is the most common method of observability supported by the server software. It allows the users to track back the failures and possibly identify the root causes of such failures. There are many advanced log management tools available in the market so that users can monitor the logs in real time and trigger alerts and notifications based on certain log events, so that operations teams can take action on those alerts before the server goes into failure mode. The NATS server supports various logging options that you can enable through the command line or the configuration file.
When the NATS server starts with the default mode without any additional options in the command line or configuration file, it prints out the log entries to the console as well as to the default log file location, which is where you have installed the NATS server. You can change that by specifying the location of the log file when starting the NATS server through the command line or the configuration file. The following example shows how you can do that from the command line:
$ nats-server --log nats.log
Once you execute the preceding command, you no longer see the standard log entries that you observed in the terminal window before this. The reason for that is the log entries are now forwarded to the nats.log file, which we have specified. If you go ahead and look at the nats.log file with the following command, you should see the log entries related to server startup:
$ tail -f nats.log
[57001] 2021/08/04 16:55:23.282130 [INF] Starting nats-server
[57001] 2021/08/04 16:55:23.282384 [INF] Version: 2.3.0
[57001] 2021/08/04 16:55:23.282396 [INF] Git: [56a144a]
[57001] 2021/08/04 16:55:23.282404 [INF] Name: NC4ARPCQ2Y5GZ4OMC2LE3MLNSRR3TRZ6PC6VDSEH5PI Y7F2JMJJ4S2LT
[57001] 2021/08/04 16:55:23.282412 [INF] ID: NC4ARPCQ2Y5GZ4OMC2LE3MLNSRR3TRZ6PC6VDSEH5PIY7 F2JMJJ4S2LT
[57001] 2021/08/04 16:55:23.288322 [INF] Listening for client connections on 0.0.0.0:4222
[57001] 2021/08/04 16:55:23.289009 [INF] Server is ready
Similar to this, there are other options available so that we can enable additional levels of logging, such as debug logs, trace logs, and syslog based on your needs. It also provides features such as log rotation based on the log file size, so that older files can be backed up to save space.
More information on configuring the logging for the NATS server can be found in the official NATS documentation available at https://docs.nats.io/nats-server/configuration/logging.
Monitoring
The NATS server follows a modern approach to monitoring the server in addition to the traditional log-based monitoring by running an HTTP server that exposes server details via a REST API. This API is exposed over HTTP by default, and we can expose it over HTTPS for additional security. We can configure the port of this HTTP server via the configuration file or the command line.
Let's go ahead and start the NATS server with HTTPS-based monitoring. To do that, we can reuse the same set of certificates that we had generated in Chapter 7, Securing a Microservices Architecture with NATS You can check out the code at the GitHub repository: https://github.com/PacktPublishing/Designing-Microservices-Platforms-with-NATS.
Then, go inside the chapter8 directory and update the node1-auth.conf file with the https_port parameter as follows:
node1-auth.conf
listen: 127.0.0.1:4222
https_port: 8222
tls {
cert_file = './server.pem'
key_file = './server-key.pem'
ca_file = './ca.pem'
timeout = 5
}
#### more...
Here, we are specifying the TLS configuration and the HTTPS monitoring port as 8222 and the client connection port as 4222. Make sure the certificates generated in the previous chapter are copied into this directory before starting the server. Also, you should export the environment variables related to users and passwords with the following command:
$ export REGISTRATION_PASS=reg123;
export INSPECTION_PASS=ins123;
export TREATMENT_PASS=trt123;
export RELEASE_PASS=rel123;
export ADMIN_PASS=admin123;
export OTHER_PASS=other123;
Then we can start the NATS server with the following command:
$ nats-server --config node1-auth.conf
Now, you should be able to access the URL https://127.0.0.1:8222 to view the monitoring details exposed by the NATS server. When you access this URL with a browser, you will get a browser warning since we are using a self-signed certificate. We can ignore this warning and proceed to the monitoring page.
Let's go ahead and make similar changes to the node2-auth.conf and node3-auth.conf files by adding https_port values 8223 and 8224 respectively. After that, go ahead and start nodes 2 and 3 to form the cluster by executing the following commands:
$ nats-server --config node2-auth.conf
$ nats-server --config node3-auth.conf
We can access the monitoring APIs of these two servers via the following URLs:
- https://127.0.0.1:8223
- https://127.0.0.1:8224
Now we have a 3-node NATS server cluster enabled with TLS for client connections and route connections with monitoring. Let's go ahead and run our publisher and subscriber code to make it interesting so that we have enough data to monitor through the monitoring endpoints. You can go inside the chapter8/subs-1 directory and run the subscriber with the following command:
$ go run main.go
This command will start the subscriber that listens to the patient.register subject and is connected to the NATS server with port 5222. You can start the other two subscribers located inside the subs-2 and subs-3 directories, which will listen to the same subject and are connected to the other two nodes on ports 6222 and 4222 respectively.
Finally, let's go ahead and start the publisher by going inside the chapter8/publisher directory and executing the same command as before.
Now we have the 3-node cluster enabled with TLS and monitoring with three subscribers and one publisher connected. Let's go ahead and access the monitoring endpoint (https://localhost:8222) to find out the information it exposes about the NATS server cluster.
This endpoint provides the details of the server via the following contexts:
- General server information (/varz)
- Connections-related information (/connz)
- Routing information (/routez)
- Information on gateways (/gatewayz)
- Information on leaf nodes (/leafz)
- Subscription routing information (/subsz)
- Account information (/accountz)
- JetStream information (/jsz)
All the aforementioned endpoints provide a JSON response to the client and support JSONP and CORS, so that you can create monitoring web applications using a single page application (SPA) approach. Let's discuss some of the important aspects of these endpoints related to our topic.
General server information (/varz)
This endpoint provides general information on the server and the status, which includes details such as the following:
- Server name, ID, TLS, and authorization details
- Cluster details and routes
- CPU and memory usage data
- Connection URLs
- Hostname, ports, and timeouts
- In/out messages and total size of messages
- Subscriptions
If you access the https://localhost:8222/varz URL in your setup, you should get a response similar to the following content:

Figure 8.3 – Output of the /varz endpoint in the NATS server
You should be able to identify the configurations related to this server instance with this endpoint.
Connections-related information (/connz)
Another important aspect of the NATS server that is exposed through the monitoring API is the connections-related information, such as current and closed connections with clients. This endpoint allows us to filter and sort the results based on various aspects. By default, it provides details of a maximum of 1,024 connections in a paging manner, and you can request more details by specifying the offset value from that page. The response from this endpoint provides information such as the following:
- Server ID
- Total connections on the server
- Details of each connection (in the response):
- Connection ID/name
- Connection port
- In/out messages and sizes (total)
- TLS details
- Uptime/idle time/last activity time/start time
If you access the https://localhost:8222/connz URL in your setup, you should get a response similar to the following content:

Figure 8.4 – Output of the /connz endpoint in the NATS server
Routing-related information (/routez)
This endpoint provides information on the cluster routes and their status. In our setup, we have three nodes clustered together, and each server has route connections from two other nodes. This response contains details such as the following:
- Server ID
- Number of routes
- Details of each route:
- Route ID
- Remote server ID
- IP/port details
- In/out messages and sizes of messages (total)
By accessing the https://localhost:8222/routez URL, we can see the following response from the monitoring endpoint related to the routes:

Figure 8.5 – Output of the /routez endpoint in the NATS server
More details on these endpoints can be found on the official NATS documentation page at https://docs.nats.io/nats-server/configuration/monitoring.
Now, we have a better understanding of the NATS observability features and how microservices observability needs to be implemented. Let's discuss how we can use these concepts to build a microservices-based platform with NATS using these concepts, by using our sample OPD application and the NATS cluster.
Using NATS observability in a microservices architecture
So far, we have discussed microservice observability and NATS observability as two separate topics. Let's aggregate these topics and produce a common approach to implement observability for a microservices-based platform. The best way to learn a concept is to try with a practical example. Let's build a simple application that has two microservices written in Go. These microservices are called publisher and subscriber. We are going to use the open source observability tools Prometheus, Grafana, and Loki in this example.
The following figure shows the example application that we are going to build:
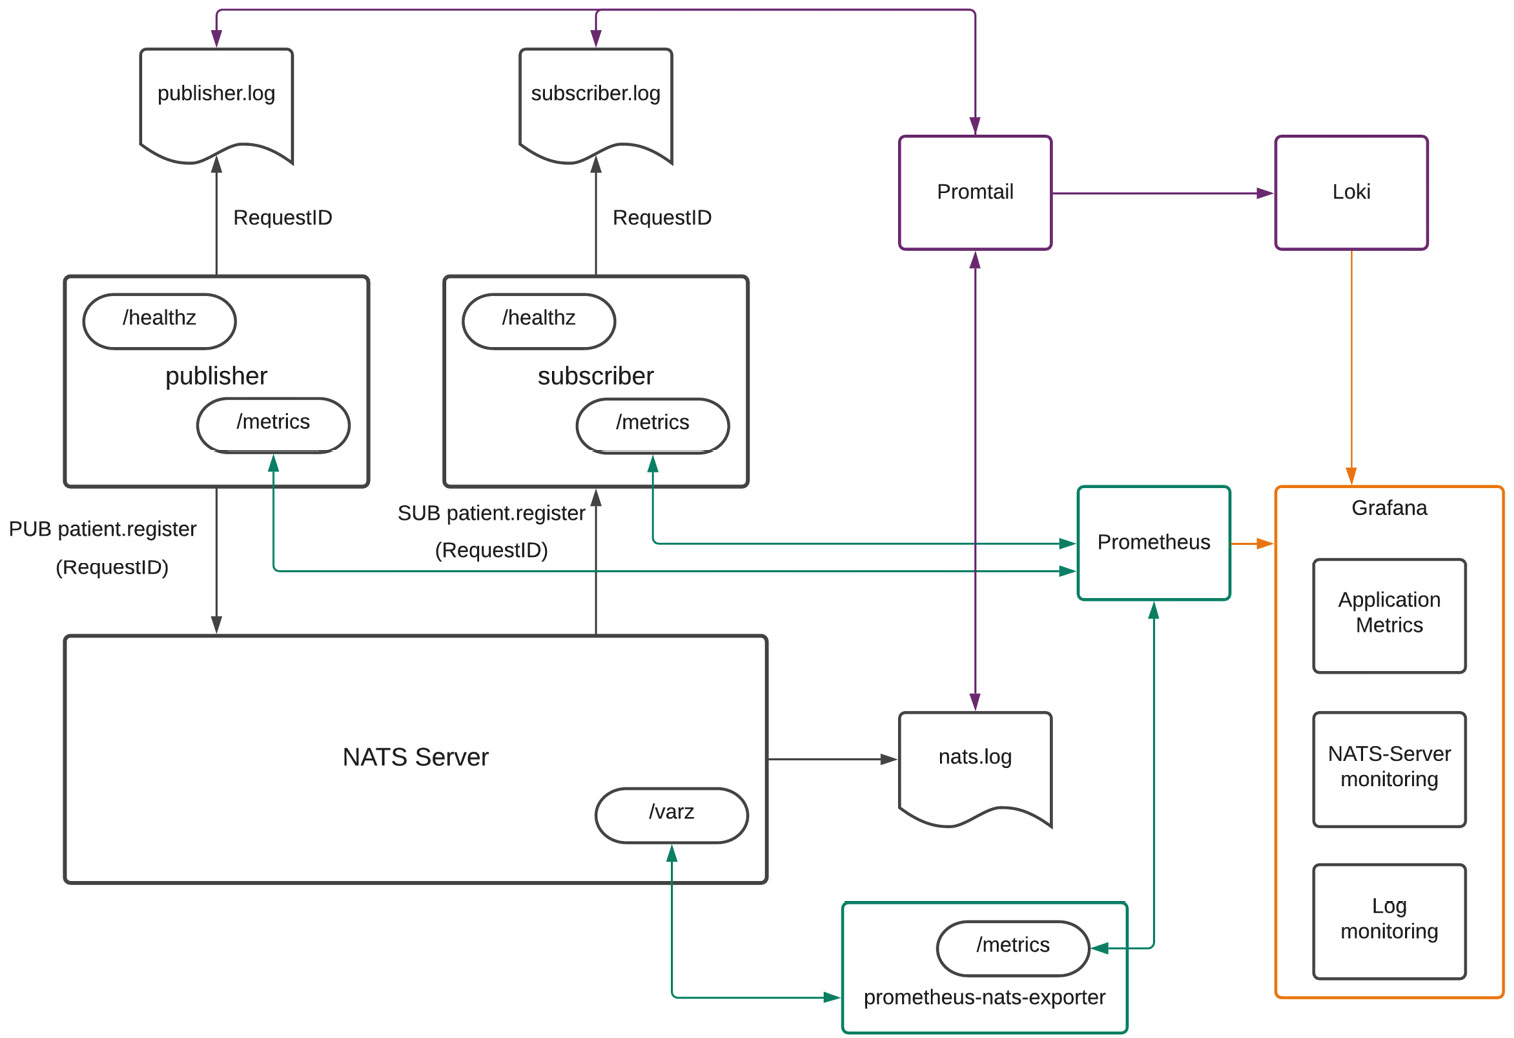
Figure 8.6 – Microservices observability example with Prometheus, Grafana, and Loki
The preceding figure depicts a simple application, consisting of a publisher microservice and a subscriber microservice interacting with each other using the NATS server. We have set up our monitoring ecosystem for this application using the following components:
- Prometheus
- Grafana
- Loki and Promtail
Let's get a basic understanding of these tools in the following subsections.
Prometheus
This is an open source monitoring solution that helps collect metrics on applications and provides interfaces to analyze, visualize, generate alerts, and take actions based on these alerts. Some key features include the following:
- A time series-based data collection
- The ability to run powerful queries to generate graphs, tables, and alerts
- Integration with visualization tools such as Grafana to generate powerful graphics
- Support for many programming languages with client libraries
- Simple implementation
- An excellent alerting capability with flexible queries
Important Note
We are using Prometheus to display observability aspects due to its popularity and wider adoption in the industry.
Grafana
This is an open source tool used to query, visualize, alert on, and understand observability data of applications regardless of the storage technology. It integrates with many metrics collecting systems, such as Prometheus, Loki, and Promtail. We can create, explore, and share observability data through nice dashboards, which are highly customizable. Some key features of Grafana include the following:
- The ability to unify data from different sources and storage technologies
- Flexibility and easy-to-use dashboard creation to share with other people
- Allowing data to be managed across teams and within teams with proper access control mechanisms
Important Note
We are using Grafana in this section due to its flexibility and wider adoption in the technology world.
Loki and Promtail
Loki is a log aggregation tool that collects logs from different applications for further analysis by effectively storing the log data. It uses indexing to improve the log analysis processes and uses labels to index the data without modifying the original log messages. It uses an agent such as Promtail to acquire the logs and turns the logs into streams, and then pushes them to Loki through an HTTP API. Some key features of Loki include the following:
- Effective log indexing with improved memory usage
- The ability to support large-scale applications with scalability
- Good integration with Grafana to build a complete observability stack
- Multi-tenancy to manage log data across teams
We are using Loki and Promtail in this section since it works well with Prometheus and Grafana.
Let's now go ahead and build our sample application. We are going to modify the publisher and subscriber samples we built in Chapter 7, Securing a Microservices Architecture with NATS. The full source code can be found at https://github.com/PacktPublishing/Designing-Microservices-Platforms-with-NATS/tree/main/chapter8.
Adding the health check API
The first thing we are going to do is implement the health check API for both publisher and subscriber examples. To do that, we are going to use the same mux library we used in our OPD application:
observability-sample/publisher/main.go
// ….. More code
// ListenAndServe takes the network address and port that
// the HTTP server should bind to and starts it.
func ListenAndServe(addr string) error {
r := mux.NewRouter()
router := r.PathPrefix("/publisher/").Subrouter()
// Handle health check requests
router.HandleFunc("/healthz", HandleHealthCheck)
l, err := net.Listen("tcp", addr)
if err != nil {
return err
}
srv := &http.Server{
Addr: addr,
Handler: router,
ReadTimeout: 10 * time.Second,
WriteTimeout: 10 * time.Second,
MaxHeaderBytes: 1 << 20,
}
go srv.Serve(l)
return nil
}
func HandleHealthCheck(w http.ResponseWriter, r
*http.Request) {
fmt.Fprintf(w, fmt.Sprintf("Service available. "))
}
// ….. More code
Here, we are starting an HTTP server with the /healthz endpoint to respond to health check calls with a simple response with HTTP status code 200. The same will be implemented for the subscriber sample as well.
Adding CorrelationID to the requests
The next thing we are going to do is generate a Universal Unique Identifier (UUID) and attach that to the request in the message body before publishing it to the NATS server. To do this, we are using a structure to define the message structure and including a field called RequestID to store the unique ID that we can use to trace the message in case of a failure:
observability-sample/publisher/main.go
// .... More Code
// RegistrationRequest contains data about the patient.
type RegistrationRequest struct {
// Full Name of the patient.
FullName string `json:"full_name,omitempty"`
// Address of the patient.
Address string `json:"address,omitempty"`
// National Identification Number of the patient.
ID int `json:"id"`
// RequestID is the ID from the request.
RequestID string `json:"request_id,omitempty"`
}
// Create event
regEvent := RegistrationRequest{"Chanaka Fernando", "44
Seeduwa", 1111, nuid.Next()}
reg_event, err := json.Marshal(regEvent)
if err != nil {
log.Fatal(err)
}
// Publish a message on "patient.profile" subject
subj, msg := "patient.register", reg_event
nc.Publish(subj, msg)
// .... More Code
Here, we are creating the message with the auto-generated UUID and publishing that to the subject in the NATS server.
Adding improved logging for microservices
Each microservice should have its own log files to store the observability data. In addition to that, having separate log categories based on the details that are printed in the log makes analyzing and troubleshooting the issue scenarios much easier. Let's see how we can implement logging in our microservices:
observability-sample/publisher/main.go
// … more code
func initLoggers() {
file, err := os.OpenFile("publisher.log",
os.O_APPEND|os.O_CREATE|os.O_WRONLY, 0666)
if err != nil {
log.Fatal(err)
}
// more code
}
func main() {
// Initialize loggers
initLoggers()
// more code
// Create event
regEvent := RegistrationRequest{"Chanaka Fernando", "44
Seeduwa", 1111, nuid.Next()}
reg_event, err := json.Marshal(regEvent)
if err != nil {
ErrorLogger.Println(err)
log.Fatal(err)
}
InfoLogger.Printf("Publishing message with ID %s",
regEvent.RequestID)
}
// … more code
In the preceding code segment, we are defining the log file name and the log categories with the format of the log entries. Then, we use these categories when logging the details of the program.
Collecting metrics and exposing them for application monitoring
Another important aspect of observability is application-level monitoring and metrics. We can use Prometheus's client exporter, which is a client library, to collect application metrics and expose them through a separate endpoint. Then, Prometheus can collect this information and provide advanced query capabilities and later publish it to grafana for better visualization. The following code sample shows how we can do that using our publisher example:
observability-sample/publisher/main.go
// .. more code
var totalRequests = prometheus.NewCounterVec(
prometheus.CounterOpts{
Name: "http_requests_total",
Help: "Number of get requests.",
},
[]string{"path"},
)
// more code
func main() {
// Initialize Tracing
initTracing()
}
func prometheusMiddleware(next http.Handler) http.Handler {
return http.HandlerFunc(func(w http.ResponseWriter, r
*http.Request) {
route := mux.CurrentRoute(r)
path, _ := route.GetPathTemplate()
timer := prometheus.NewTimer(httpDuration.
WithLabelValues(path))
rw := NewResponseWriter(w)
next.ServeHTTP(rw, r)
statusCode := rw.statusCode
responseStatus.WithLabelValues
(strconv.Itoa(statusCode)).Inc()
totalRequests.WithLabelValues(path).Inc()
timer.ObserveDuration()
})
}
In the preceding code segment, we are defining our own metrics to collect information related to totalRequests, responseStatus, and httpDuration so that we can measure the performance of our publisher application specific to HTTP calls. We intercept all the HTTP requests coming into the /publisher context with the middleware component, which collects this information and publishes it via the /metrics endpoint:
func NewResponseWriter(w http.ResponseWriter)
*responseWriter {
return &responseWriter{w, http.StatusOK}
}
func (rw *responseWriter) WriteHeader(code int) {
rw.statusCode = code
rw.ResponseWriter.WriteHeader(code)
}
func initTracing() {
prometheus.Register(totalRequests)
prometheus.Register(responseStatus)
prometheus.Register(httpDuration)
}
// ListenAndServe takes the network address and port that
// the HTTP server should bind to and starts it.
func ListenAndServe(addr string) error {
r := mux.NewRouter()
router := r.PathPrefix("/publisher/").Subrouter()
router.Use(prometheusMiddleware)
router.Path("/metrics").Handler(promhttp.Handler())
// .. more code
Finally, we implement the response writing code and register the required details with Prometheus and start the microservice with the middleware component and the /metrics endpoint.
Exporting NATS server metrics
The next step is to expose the NATS server statistics to Prometheus using the monitoring endpoints provided. To achieve this, we are going to use the promethus-nats-exporter tool, which you can find at https://github.com/nats-io/prometheus-nats-exporter.
You can clone this repository to your working environment and then build it and install it, as mentioned in the README file. Once you have installed it, you can start the tool by running the following command:
$ prometheus-nats-exporter –varz http://localhost:8222
Here, we are specifying the monitoring port of the NATS server, which has already started. If you have not started the NATS server yet, you can start that with the following command:
$ nats-server --config node.conf --log nats.log
Make sure you copy the TLS configuration files you created in the chapter7 folder to the observability-sample directory before running the NATS server.
Now, we are done with the implementation of the observability and publishing it through the metrics endpoints. Let's go ahead and configure the monitoring tools to consume this data and produce better analytics and visualization capabilities.
Starting microservices
Now, we have the observability features implemented in our publisher and subscriber applications. The next step is to go ahead and start the two applications by going inside the respective directories:
- Terminal 1:
$ cd chapter8/observability-sample/subscriber
$ go run main.go
- Terminal 2:
$ cd chapter8/observability-sample/publisher
$ go run main.go
Now, you should be able to observe the log files are populated with log entries. If you access the /metrics endpoints, you should be able to view the metrics for each microservice.
Configuring Prometheus
You can download and install Prometheus as per your operating system by visiting the website at https://prometheus.io/download/.
Once you install it, you can start Prometheus by specifying a configuration file to listen to certain applications. In our example, we are going to listen to our publisher, subscriber, and NATS server endpoints from Prometheus. The following listing can be used to configure Prometheus for that purpose:
observability-sample/prom1.yml
global:
scrape_interval: 15s
evaluation_interval: 15s
scrape_configs:
- job_name: prometheus
static_configs:
- targets: ['localhost:9090']
- job_name: publisher
metrics_path: /publisher/metrics
static_configs:
- targets:
- localhost:9001
- job_name: subscriber
metrics_path: /subscriber/metrics
static_configs:
- targets:
- localhost:9000
- job_name: 'nats-test-server'
static_configs:
- targets: ['localhost:7777']
In the preceding configuration, we are specifying the applications that we need to observe along with the respective metrics endpoints. You can observe that we are configuring the NATS server with localhost:7777, which is the port exposed by the prometheus-nats-exporter tool.
Now you can go ahead and start Prometheus by going inside the installation directory with the following command:
$./prometheus --config.file prom1.yml
This will start the Prometheus server, and you can access it with http://localhost:9090/.
You can search certain metrics entries from this interface and visualize them with the Prometheus interface.
Configuring Loki and Promtail
The next step is to configure the log aggregation tool, which can help immensely in troubleshooting scenarios. You can download and install Loki and Promtail by following the instructions listed at https://grafana.com/docs/loki/latest/installation/local/.
Once you are done with the installation, you can start Loki by going inside the installation directory and executing the following command:
$./loki-darwin-amd64 -config.file=loki-local-config.yaml
Next, we need to configure Promtail to listen to the log files that are created by the applications and NATS server so that it can publish those log files as streams to Loki. The configuration of the Promtail local file is as follows:
promtail-local-config.yaml
server:
http_listen_port: 9080
grpc_listen_port: 0
positions:
filename: /tmp/positions.yaml
clients:
- url: http://localhost:3100/loki/api/v1/push
scrape_configs:
- job_name: system
static_configs:
- targets:
- localhost
labels:
job: varlogs
__path__: /var/log/*log
The preceding segment of the file is the default configuration to collect system logs and publish them to Loki. The following segments are used to collect logs from the publisher, subscriber, and NATS server:
- job_name: publisher
static_configs:
- targets:
- localhost
labels:
job: publisher
__path__: /Users/chanakaf/Documents/source-code
/Designing-Microservices-Platforms-with-NATS/
chapter8/observability-sample/publisher
/publisher.log
- job_name: subscriber
static_configs:
- targets:
- localhost
labels:
job: subscriber
__path__: /Users/chanakaf/Documents/source-code
/Designing-Microservices-Platforms-with-NATS/
chapter8/observability-sample/subscriber
/subscriber.log
- job_name: NATS-4222
static_configs:
- targets:
- localhost
labels:
job: nats-4222
__path__: /Users/chanakaf/Documents/source-code
/Designing-Microservices-Platforms-with-NATS/
chapter8/observability-sample/nats.log
In the preceding sample configuration file, we have specified the log file location of the publisher, subscriber, and NATS server with the respective names so that we can search based on the application.
Configuring Grafana
The last component of our observability setup is Grafana, which is the data visualization tool. You can download and install Grafana as mentioned here: https://grafana.com/docs/grafana/latest/installation/.
Once it is started, you can access the interface by visiting http://localhost:3000/.
You can log in with the default username and password as admin. Next, you need to configure two separate data sources for Prometheus and Loki to monitor the metrics and logging from the same interface. You can follow the instructions given at the following link to add data sources: https://grafana.com/docs/grafana/latest/datasources/add-a-data-source/.
Now, we have everything set up to monitor and observe our microservices-based solution with NATS. You can import the grafana-nats-dash.json file to the Grafana server to create a graph to monitor the NATS server-related information. This file is available in the GitHub repository at https://github.com/PacktPublishing/Designing-Microservices-Platforms-with-NATS/tree/main/chapter8/observability-sample. You can play with the Grafana dashboards to create useful visualizations of the metrics and logging data. This part is kept as an exercise for you.
Summary
In this chapter, we discussed observability in the context of a microservices architecture and defined the distinct types of observability requirements in such a platform. We discussed how monitoring is related to observability and what types of information we can monitor in a microservices environment. Then, we discussed the various observability features available in the NATS platform and how that information can be accessed through log files and REST APIs. Finally, we built a comprehensive microservices-based observability platform with a sample application that uses NATS for interservice communication. We discussed setting up open source monitoring tools such as Prometheus, Grafana, and Loki to set up the observability platform for our sample application.
This chapter concludes our second section of the book, where we discussed the practical usage of NATS with microservices platforms by going through numerous examples and configurations. The next chapter starts our last section of the book, where we will discuss how microservices platforms along with NATS co-exist in enterprise IT environments and what the future of microservices and NATS looks like.