CHAPTER 4: IDENTIFY AND MAP VALUE STREAM
Introduction
In the previous chapter we considered what customers value and how this is determined. The next stage in lean thinking is to consider the processes by which this value is delivered and fulfilled. This value stream starts with raw material, or a service idea, right through to fulfilment to the final consumer. Lean has a process for considering and documenting this in the form of a ‘value stream map’.
Value stream mapping
Lean considers each step of the production process, analysing in terms of the value added for the customer from the start to finish of the process. These are mapped to allow analysis – the focus on value stream mapping is to identify waste (including rework, scrappage and set up times). The map is a visual representation identifying each step.
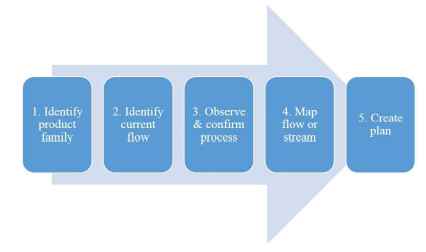
Figure 3: Value stream mapping process
Each of these five steps are described below.
Step 1. Identify product family
The first step is to identify which products are to be included in the value stream to be reviewed. This step sets the scope for the mapping exercise. Generally, this will be based upon products which pass through similar process steps. The focus should be on higher value/volume processes.
At this stage it is also important to identify all of the locations where the specified product family is processed. It is also necessary to have an understanding of the goals and objectives to be achieved and any known issues.
Step 2. Identify current flow
An initial map will be prepared on the ‘as is’ or current state. There are a number of ways this can be prepared, including:
• Using existing process flows and swim lanes.
• Walking through the process using the customer journey perspective.
• Reviewing previous customer feedback to identify which steps are of most value to them.
• Drawing the process and validating with key stakeholders.
• Document each procedural step with high-level notes and examples of transactions (showing for each the inputs, processes and outputs). May also include the ‘customer’ and ‘supplier’, even if these are internal to the organisation.
• Highlighting areas of known potential improvement in the process.
• Obtaining relevant benchmark, the key performance indicators (KPIs) for the process, which may include:
![]() volumes – both stock and flow over time
volumes – both stock and flow over time
![]() frequency
frequency
![]() error rates/quality failures
error rates/quality failures
![]() time to complete – in total and broken down by process steps
time to complete – in total and broken down by process steps
![]() variations in customer demand (e.g. seasonal peaks and troughs)
variations in customer demand (e.g. seasonal peaks and troughs)
![]() available production time/required units of production. So if there are seven working hours in a day (after allowing for breaks, etc.) and the customer demand is seven units, the take time would be one hour.
available production time/required units of production. So if there are seven working hours in a day (after allowing for breaks, etc.) and the customer demand is seven units, the take time would be one hour.
• Using information flows.
Step 3. Observe and confirm process
The mapping begins with a ‘gemba’ walk (Japanese word meaning ‘the real place’). This is a walkthrough of the location where the process is performed. This can be the factory floor, warehouse or office. It is easier to identify waste from seeing the process in action. Also, the flowcharts and other documentation prepared by management may not cover the current process in practice, or may not be applied consistently across different sites. By visiting different locations operating the same process, it is also often possible to identify areas of best practice, some of which may not be identifiable from the KPIs gathered during step two above. Often the mapping will commence at the end – the point at which the product or service is despatched to the customer. It then continues back up the value stream. The output from this step will be process documentation and other evidence (e.g. samples of product at each stage, photographs, QA reports) to support the process documentation.
Step 4. Map the flow or stream
Unlike other forms of process mapping, workshops would not normally be run to draw and confirm the process until the above has been completed. This is when the large rolls of brown paper are used to complete the process map.
The current flow can then be analysed to identify those steps which are:
1. Value adding activities – Those which create value for the customer for which they are willing to pay.
2. Non value adding activities – Those which do not add customer value and there are no bars to them being eliminated immediately.
3. Value enabling activities – Those which do not create direct value, but cannot be eliminated or changed at this stage, usually because they are required for related processes (type 1 Muda). May also include items, such as health and safety, or IT security/data privacy.
Where there are bottlenecks identified in the process, the technique of ‘heijunka’ may be used to smooth the flow. This aims to level the type and quantity of production over a time, to respond to the pull from customers, avoiding batching and large stock levels, without the corresponding capital and staffing costs.
Step 5. Creating the (implementation) plan
A future state map is then created of the ideal value flow – to exclude areas of waste, including reducing the time for processing if possible. This forms the basis for a project plan to move the desired flow – with reduced waste/cost and more streamlining. There should also be increased quality for the customer, which could be measured using the Kano model described in the previous chapter.
Tools for value stream mapping
To support the five steps for value stream mapping described above, there is an established toolbox with seven components:
1. Process activity mapping
2. Supply chain responsiveness matrix
3. Production variety funnel
4. Quality filter mapping
5. Demand amplification mapping
6. Decision point analysis
7. Physical structure mapping.
This is based on the work defined by Hines and Rich (see Peter Hines, Nick Rich, (1997) The Seven Value Stream Mapping Tools, International Journal of Operations & Production Management, Vol. 17 Issue: 1). These tools have been collated from a number of different sources and backgrounds including academia, manufacturing and engineering.
A brief overview of each of these is given below. It is unlikely that all of these tools would be encountered on a particular project. I have included them here for completeness.
There is an excellent illustration of how these tools are applied in practice for a foundry operation by Pude and Naik (see IOSR Journal of Mechanical and Civil Engineering (IOSR-JMCE) ISSN: 2278-1684, PP: 07-12). This illustrates the use of some of the tools to review production in a metal foundry.
Tool 1: Process activity mapping
Process activity mapping is a tool to map the whole of a production process, from receiving raw materials up to the fulfilment of the customer’s order. The maps help to identify and analyse lead time and opportunities to improve production/reduce waste. Every step of the process is mapped, including the supply chain sub-processes. Mapping is completed in five steps:
1. Map and study process flow
2. Identify potential waste
3. Consider changing sequences of process
4. Consider alternative process flow patterns
5. Consider whether all actions at each stage are necessary, and the implications of removing specific tasks.
This determines the main components of the process and documents a process map. It can include a number of metrics. For each step key considerations are:
• Who performs it?
• What resources and tools are used?
• Why the activity occurs (based on customer value)?
• Where it occurs?
• When it occurs?
• How often it occurs?
The above steps also help to identify any duplicate or missing activity in the process, and wastage due to unnecessary hand-offs between different people performing tasks.
Process activity mapping could be applied to a software project. By understanding the flow of the project, including any quality stage gates, the project plan could be streamlined. For example, by identifying any unnecessary, wasteful or duplicated steps, or improving the hand-offs between different sub-teams.
Tool 2: Supply chain responsiveness matrix (SCRM)
The supply chain responsiveness matrix (SCRM) is an inventory management tool used to analyse stock levels with their process and lead times. As spend on raw materials and input services can be a very high proportion of spend (depending on the industry sector), also tying up working capital or requiring short term credit, it is important to ensure that excessive stock levels are not held. However, there is a risk of stock outages if the stock levels are too low for just in time production, leading to idle time waste. The SCRM is usually shown in an easy to use graphical form, with the inventory time shown on the Y axis and the lead time shown on the X axis. The chart enables process teams to focus on areas with excessive stock holdings, or where other improvements can be made. In some cases, apparent overstocking may be unavoidable – for example in the potato snacks industry the main raw material, potatoes, is seasonally harvested, whilst demand for the end product is fairly uniform throughout the year.
This tool could also be applied for software projects. I have known several projects to be delayed because the supporting software or releases were not yet available, or due to offshore testing, or other third party activities not being completed. Using the SCRM approach could help to reduce these potential delays.
Tool 3: Production variety funnel
Different end product variants will require different components to be created – the production variety funnel is a way of identifying these variations at each production stage, and then presenting the result in a chart form. This helps to identify issues around the number of variations and whether there are opportunities for standardisation. The maps can also be used to find where the stock can be held most beneficially during processing, based on likely levels of demand.
Standardisation of sub-components can have benefits to the customer, as well as in the future maintenance of the project. For example, the ‘hand-built’ nature of the Nimrod reconnaissance aircraft made them expensive and difficult to maintain, as standard components could not be used. This led ultimately to their scrapping. In the Apollo 13 incident, air filters built for the lunar module of the space craft had to be ‘modified’ during the flight home, to be useable in the main capsule.
This tool could also be used on software projects. For example, using a modular approach in a system means that modules can be re-used elsewhere in the system, helping to reduce waste and provide a more standard user interface and ease of future maintenance.
Tool 4: Quality filter mapping
Defects can occur throughout a process, however, defects in individual components may not become apparent until later in production. This causes additional waste, as the additional processing performed may not have been necessary. For example, faulty raw materials in a food processing factory could cause the whole batch of production to be scrapped. Quality filter mapping helps to identify where defects occur and where they are discovered.
Quality filter mapping looks at three areas of quality:
1. Product quality – the quality of the end product or service provided to the customer. This will be represented by product returns or complaints.
2. Defects found (scrap) – these are the defects found during production quality control, which were either remedied or led to waste.
3. Service quality – these are issues impacting the ability to provide the product to the customer (e.g. failure of a piece of machinery vital to the process).
Quality filter mapping considers the failure rates for each of these as a ratio (e.g. parts per million/thousand/hundred) for each stage of production.
Quality filter mapping could be applied to software projects, testing to ensure that faults are corrected as soon as possible.
Tool 5: Demand amplification mapping
Sudden changes in customer demand, or changes required in later stages of production, can have a ripple effect back through the process. It’s like the effect of a car braking slightly on a highway – the cars behind all brake increasingly harder, leaving the cars at the back to possibly actually stop. Likewise, in a production cycle a change in orders received, for example, could have an increasing impact back through the process. This phenomenon is known as ‘demand amplification’, or the Forrester Effect (after Jay W Forrester who mathematically documented it in the 1950s at Massachusetts Institute of Technology.
It is also sometimes called the bullwhip effect, as the amplitude of the impact increases as it progresses through the supply chain, in a similar way to the cracking of a whip. In addition to changes in demand, the effect can also be caused by changes and adjustments to products during the processes.
The demand amplification chart (aka the Forrester effect chart) shows the level of variation in demand at each stage or time interval for the production process.
Tool 6: Decision point analysis
The decision point in a process stream is that point where the customer pull in the process is exceeded by the push of production. At this point, products or components are being created based on forecast, or other issues not related to the actual level of demand at that time. Where we are aiming to have production based on customer pull, an understanding of where this occurs is vital to assess processes either side of the point, to ensure alignment with the push or pull. Also, by considering changes in scenarios, the impact of a move of the decision point can be considered, allowing improved design of the value stream.
This is one of the lesser used of the seven tools. There has been some application in the childcare arena in the US.
Tool 7: Physical structure mapping
Physical structure mapping is used to provide an oversight of how the production process fits within the industry as a whole. This provides an understanding of the operation of the supply and demand side of the industry, and can highlight opportunities where there has so far been little consideration by competitors. The tool is in two graphical parts:
1. Volume structure – this shows the number of organisations in the industry structure in which the producer operates, broken down into tiers for supply (raw materials and support) and distribution, including after sales support.
2. Cost structure – this is based on the same organisations shown in the volume structure, but is based on the value added by each. This can be compared to the value added to identify potential unneeded or unrewarding steps in the entirety of the process, so waste can be reduced.
Lean project within mapping stream
One area to consider may be the impact of the project itself on the overall value stream. The conduct of the project should be invisible to the end customer until it actually delivers some benefit. I find it very frustrating as a customer to be told that my requirements cannot be met because the ‘system is being upgraded’, or that the product has been withdrawn because a new model is due out shortly.
Summary and audit approach
The toolkit is a useful way to identify potential tools to understand the value stream process. Like any tool, it is important to ensure that their use is appropriate for the objectives of the review or project. The overall aim of lean thinking is to identify waste, ensure continuous improvement and maximise value to the customer. Any tools used should hence be focused on achieving this objective.
The following audit questions will assist in any review:
1. How has the impact upon the entire value stream been considered?
2. What tools have been used to document the value stream?
3. Are the tools used appropriately and will they be applied effectively?
4. What evidence is there that the output from the tools has been reviewed and opportunities identified for waste reduction, continuous improvement or adding customer value?
5. How has the use of the tools been evaluated?
Having mapped the existing value flow, the next lean principle considers the creation of future flows to eliminate waste. This is considered in the next chapter.