
Chapter 12. Management and monitoring
This chapter covers
- Monitoring Camel instances
- Tracking application activities
- Using notifications
- Managing Camel applications
- Managing custom components
Applications in production are often critical for businesses. That’s especially true for applications that sit at an intermediate tier and integrate all the business applications and partners—Camel is often in this role.
To help ensure high availability, your organization must monitor its production applications. By doing so, you can gain important insight into the applications and foresee trends that otherwise could cause business processes to suffer. In addition, monitoring also helps with related issues, such as operations reporting, service level agreement (SLA) enforcement, and audit trails.
It’s also vital for the operations staff to be able to fully manage the applications. For example, if an incident occurs, staff may need to stop parts of the application from running while the incident investigations occur. You’ll also need management capabilities to carry out scheduled maintenance or upgrades of your applications.
Management and monitoring are often two sides of the same coin. For example, management tooling includes monitoring capabilities in a single coherent dashboard, allowing a full overview for the operations staff.
In this chapter, we’ll review different strategies for monitoring your Camel applications. We’ll first cover the most common approach, which is to check on the health of those applications. Then we’ll look at the options for tracking activity and managing those Camel applications.
12.1. Monitoring Camel
It’s standard practice to monitor systems with periodic health checks.
For people, checking one’s health involves measuring parameters at regular intervals, such as pulse, temperature, and blood pressure. By checking over a period of time, you not only know the current values but also trends, such as whether the temperature is rising. All together, these data give insight into the health of the person.
For a software system, you can gather system-level data such as CPU load, memory usage, and disk usage. You can also collect application-level data, such as message load, response time, and many other parameters. This data tells you about the health of the system.
Checks on the health of Camel applications can occur at three levels:
- Network level— This is the most basic level, where you check that the network connectivity is working.
- JVM level— At this level, you check the JVM that hosts the Camel application. The JVM exposes a standard set of data using the JMX technology.
- Application level— Here you check the Camel application using JMX or other techniques.
To perform these checks, you need different tools and technologies. The Simple Network Management Protocol (SNMP) enables both JVM and system-level checks. Java Management Extensions (JMX) is another technology that offers similar capabilities to SNMP. You might use a mix of both: SNMP is older and more mature and is often used in large system-management tools such as IBM Tivoli, HP OpenView, and Nagios. JMX, on the other hand, is a pure Java standard and is used by Fuse HQ and Hyperic.
In the following sections, we’ll go over the three levels and look at some approaches you can use for performing automatic and periodic health checks on your Camel applications.
12.1.1. Checking health at the network level
The most basic health check you can do is to check whether a system is alive. You may be familiar with the ping command, which you use to send a ping request to a remote host. Camel doesn’t provide a ping service out of the box, but creating such a service is easy. The ping service only reveals whether Camel is running or not, but that will do for a basic check.
Suppose you have been asked to create such a ping service for Rider Auto Parts. The service is to be integrated with the existing management tools. You choose to expose the ping service over HTTP, which is a universal protocol that the management tool easily can leverage. The scenario is illustrated in figure 12.1.
Figure 12.1. A monitoring tool monitors Camel with a ping service by sending periodic HTTP GET requests.

Implementing the service in Camel is easy using the Jetty component. All you have to do is expose a route that returns the response, as follows:
from("jetty:http//0.0.0.0:8080/ping").transform(constant("PONG
"));
When the service is running, you can invoke an HTTP GET, which should return the PONG response.
You can try this on your own with the book’s source code. In the chapter12/health directory, invoke this Maven goal:
mvn compile exec:java -PPingService
Then invoke the HTTP GET using either a web browser or the curl command:
curl http://0.0.0.0:8080/ping
PONG
The ping service can be enhanced to leverage the JVM and Camel APIs to gather additional data about the state of the internals of your application.
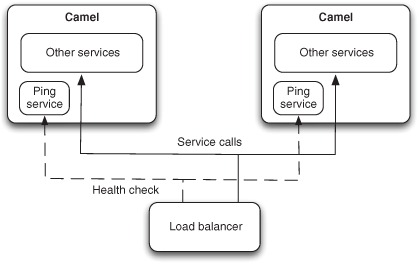
Another use for the ping service is when using a load balancer in front of multiple instances of Camel applications. This is often done to address high availability, as shown in figure 12.2. The load balancer will call the ping service to assess whether the particular Camel instance is ready for regular service calls.
Figure 12.2. The load balancer uses health checks to ensure connectivity before it lets the service calls pass through.
Network-level checks offer a quick and coarse assessment of the system’s state of health. Let’s move on to the JVM level, where you monitor Camel using JMX.
12.1.2. Checking health at the JVM level
The Simple Network Management Protocol (SNMP) is a standard for monitoring network-attached devices. It’s traditionally used to monitor the health of servers at the OS level by checking parameters such as CPU load, disk space, memory usage, and network traffic, but it can also be used to check parameters at the application level, such as the JVM.
Java has a built-in SNMP agent that exposes general information, such as memory and thread usage, and that issues notifications on low memory conditions. This allows you to use existing SNMP-aware tooling to monitor the JVM where Camel is running.
There is also a wide range of commercial and open source monitoring tools that use SNMP. Some are simpler and have a shell interface, and others have a powerful GUI. You may work in an organization that already uses a few selected monitoring tools, so make sure these tools can be used to monitor your Camel applications as well.
The SNMP agent in the JVM is limited to only exposing data at the JVM level; it can’t be used to gather information about the Java applications that are running. JMX, in contrast, is capable of monitoring and managing both the JVM and the applications running on it.
In the next section, we’ll look at how you can use JMX to monitor Camel at the JVM and application levels.
12.1.3. Checking health at the application level
Camel provides JMX monitoring and management out of the box in the form of an agent that leverages the JMX technology. This is illustrated in figure 12.3.
Figure 12.3. JConsole connects remotely to an MBean server inside the JVM, which opens up a world of in-depth information and management possibilities for Camel instances.

The JMX agent exposes remotely (over Remote Method Invocation) a wealth of standard details about the JVM, and some Camel information as well. The former is standard in the JDK, and the latter is provided by Camel. The most prominent feature the Camel JMX agent offers is the ability to remotely control the lifecycle of any service in Camel. For example, you can stop routes and later bring those routes into action again. You can even shut down Camel itself.
So how do you use JMX with Camel? Camel comes preconfigured with JMX enabled at the developer level, by which we mean that Camel allows you to connect to the JVM from the same localhost where the JVM is running. If you need to manage Camel from a remote host, you’ll need to explicitly enable this in Camel.
We think this is important to cover thoroughly, so we’ve devoted the next section to this topic.
12.2. Using JMX with Camel
To use JMX with Camel, you need the following four Spring JAR files on the classpath:
- spring-core.jar
- spring-beans.jar
- spring-context.jar
- spring-aop.jar
These JARs are needed because Camel uses Spring JMX to expose its managed beans to the JMX server. Using Spring JMX is much easier than using the low-level clumsy JMX API. With Spring JMX, you can add a few JMX annotations in the Camel codebase to expose the information you want to manage from JMX.
When Camel starts, it logs at INFO level whether JMX is enabled or not:
2010-01-09 11:15:23,520 [viceMain.main()] INFO  DefaultCamelContext
- JMX enabled. Using DefaultManagedLifecycleStrategy.
If those four Spring JARs are missing, Camel will report it as follows:
2010-01-09 11:44:07,960 [viceMain.main()] WARN  DefaultCamelContext
- Could not find needed classes for JMX lifecycle strategy. Needed
class is in spring-context.jar using Spring 2.5 or newer
(spring-jmx.jar using Spring 2.0.x). NoClassDefFoundError:
org/springframework/jmx/export/metadata/JmxAttributeSource
2010-01-09 11:44:07,960 [viceMain.main()] WARN  DefaultCamelContext
- Cannot use JMX. Fallback to using DefaultManagementStrategy.
With Maven, it’s easy to ensure that the JARs are included in the classpath—you just add a dependency for the camel-spring component:
<dependency>
    <groupId>org.apache.camel</groupId>
    <artifactId>camel-spring</artifactId>
    <version>2.5.0</version>
</dependency>
If you don’t want to use camel-spring, you can add the aforementioned four JAR files individually.
Now let’s look at how to use a simple management tool with Camel.
12.2.1. Using JConsole to manage Camel
Java provides a JMX tool named JConsole. You’ll use it to connect to a Camel instance and see what information is available.
First, you need to start a Camel instance. You can do this from the chapter12/health directory using this Maven command:
mvn compile exec:java -PPingService
Then, from another shell, you can start JConsole by invoking jconsole.
When JConsole starts, it displays a window with two radio buttons. The Local radio button is used to connect to existing JVMs running on the same host. The Remote radio button is used for remote management, which we’ll cover shortly. The Local should already list a process, and you can click the Connect button to connect JConsole to the Camel instance. Figure 12.4 shows the Camel MBeans (Management Beans) that are visible from JConsole.
Figure 12.4. Camel registers numerous MBeans that expose internal details, such as usage statistics and management operations.
Camel registers many MBeans that expose statistics and operations for management. Those MBeans are divided into nine categories, which are listed in table 12.1. Most MBeans expose a set of standard information and operations, concerning things such as lifecycle. We encourage you to spend a moment browsing the MBeans in JConsole to see what information they provide.
Table 12.1. Categories of exposed Camel MBeans
|
Category |
Description |
|---|---|
| Components | Lists the components in use. |
| Consumers | Lists all the input consumers for the Camel routes. Some consumers have additional information and operations, such as the JMS, Timer, and File/FTP consumers. |
| Context | Identifies the CamelContext itself. This is the MBean you need if you want to shut down Camel. |
| Endpoints | Lists the endpoints in use. |
| Errorhandlers | Lists the error handlers in use. You can manage error handling at runtime, such as by changing the number of redelivery attempts or the delay between redeliveries. |
| Routes | Lists all the routes in use. Here you can obtain route statistics, such as the number of messages completed, failed, and so on. |
| Services | Lists miscellaneous services in use. |
| Threadpools | Lists all the thread pools in use. Here you can obtain statistics about the number of threads currently active and the maximum number of threads that have been active. You can also adjust the core and maximum pool size of the thread pool. |
| Tracer | Allows you to manage the Tracer service. The Tracer is a Camel-specific service that’s used for tracing how messages are routed at runtime. We’ll cover the use of the Tracer in detail in section 12.3.4. |
When you need to monitor and manage a Camel instance from a remote computer, you must enable remote management in Camel.
12.2.2. Using JConsole to remotely manage Camel
To be able to remotely manage Camel, you need to instruct Camel to register a JMX connector. That can be done in the following three ways:
- Using JVM properties
- Configuring the ManagementAgent from Java
- Configuring the JMX agent from Spring XML
We’ll go over each of these three methods in the following sections.
Using JVM Properties
By specifying the following JVM property on JVM startup, you can tell Camel to create a JMX connector for remote management:
-Dorg.apache.camel.jmx.createRmiConnector=true
If you do this, Camel will log, at INFO level on startup, the JMX service URL that’s needed to connect. It will look something like this:
2010-01-09 13:28:32,216 [main           ] INFO  DefaultManagementAgent
- JMX Connector thread started and listening at:
service:jmx:rmi:///jndi/rmi://davsclaus.local:1099/jmxrmi/camel
To connect to a remote JMX agent, you can use the Remote radio button from JConsole and enter the service URL listed in the log. By default, port 1099 is used, but this can be configured using the org.apache.camel.jmx.rmiConnector.registryPort JVM property.
Configuring the Managementagent from Java
The org.apache.camel.management.DefaultManagementAgent class is provided by Camel as the default JMX agent. You can configure it to allow remote connections as shown here:
public class PingServiceMain {
    public static void main(String[] args) throws Exception {
        CamelContext context = new DefaultCamelContext();

        DefaultManagementAgent agent = new DefaultManagementAgent(context);
        agent.setCreateConnector(true);
        context.getManagementStrategy().setManagementAgent(agent);

        context.addRoutes(new PingService());
        context.start();
    }
}
All you need to do is create an instance of DefaultManagementAgent, configure it to create a connector, and tell Camel to use it. The agent can also configure the registry port by using the setRegistryPort method.
But there is a simpler way: you can configure the settings directly using the ManagementAgent, as follows:
public class PingServiceMain {
    public static void main(String[] args) throws Exception {
        CamelContext context = new DefaultCamelContext();

        context.getManagementStrategy().getManagementAgent()
            .setCreateConnector(true);

        context.addRoutes(new PingService());
        context.start();
    }
}
Configuring a JMX Agent from Spring XML
If you use Spring XML with Camel, configuring a JMX connector is even easier. All you have to do is add <jmxAgent> in the <camelContext>, as shown here:
<camelContext id="camel" xmlns="http://camel.apache.org/schema/spring">
    <jmxAgent id="agent" createConnector="true"/>
    ...
</camelContext>
The <jmxAgent> also offers a registryPort attribute that you can use to set a specific port number if the default port 1099 isn’t suitable.
You may have noticed that this example doesn’t provide any credentials when connecting to a JMX agent. This may not be appropriate in production environments, so you can enable authentication with JMX. The JMX documentation explains how to use security with JMX: http://download.oracle.com/javase/6/docs/technotes/guides/management/agent.html.
Now that you’ve seen how to check the health of your applications, it’s time to learn how to keep an eye on what your applications are doing.
12.3. Tracking application activity
Beyond monitoring an application’s health, you need to ensure it operates as expected. For example, if an application starts malfunctioning or has stopped entirely, it may harm business. There may also be business or security requirements to track particular services for compliance and auditing.
A Camel application used to integrate numerous systems may often be difficult to track because of its complexity. It may have inputs using a wide range of transports, and schedules that trigger more inputs as well. Routes may be dynamic if you’re using content-based routing to direct messages to different destinations. And there are errors occurring at all levels related to validation, security, and transport. Confronted with such complexity, how can you keep track of the behavior of your Camel applications?
You do this by tracking the traces that various activities leave behind. By configuring Camel to leave traces, you can get a fairly good insight into what’s going on, both in real time and after the fact. Activity can be tracked using logs, whose verbosity can be configured to your needs. Camel also offers a notification system that you can leverage.
Let’s look at how you can use log files and notifications to track activities.
12.3.1. Using log files
Monitoring tools can be tailored to look for patterns, such as error messages in logs, and they can use pattern matching to react appropriately, such as by raising an alert. Log files have been around for decades, so any monitoring tool should have good support for efficient log file scanning. Even if this solution sounds basic, it’s a solution used extensively in today’s IT world.
Log files are read not only by monitoring tools but also by people, such as operations, support, or engineering staff. That puts a burden on both Camel and your applications to produce enough evidence so that both humans and machines can diagnose the issues reported.
Camel offers four options for producing logs to track activities:
- Using core logs— Camel logs various types of information in its core logs. Major events and errors are reported by default.
- Using custom logging— You can leverage Camel’s logging infrastructure to output your own log entries. You can do this from different places, such as from the route using the log EIP or log component. You can also use regular logging from Java code to output logs from your custom beans.
- Using Tracer— Tracer is used for tracing how and when a message is routed in Camel. Camel logs, at INFO level, each and every step a message takes. Tracer offers a wealth of configuration options and features.
- Using notifications— Camel emits notifications that you can use to track activities in real time.
Let’s look at these options in more detail.
12.3.2. Using core logs
Camel emits a lot of information at DEBUG logging level and an incredible amount at TRACE logging level. These levels are only appropriate for development, where the core logs provide great details for the developers.
In production, you’ll want to use INFO logging level, which generates a limited amount of data. At this level, you won’t find information about activity for individual messages—for that you need to use notifications or the Tracer, which we’ll cover in section 12.3.4.
The core logs in production usage usually only provide limited details for tracking activity. Important lifecycle events such as the application being started or stopped are logged, as are any errors that occur during routing.
12.3.3. Using custom logging
Custom logging is useful if you’re required to keep an audit log. With custom logging, you’re in full control of what gets logged.
In EIP terms, it’s the Wire Tap pattern that describes this problem. By tapping into an existing route, you can tap messages to an audit channel. This audit channel, which is often an internal queue (SEDA or VM transport), is then consumed by a dedicated audit service, which takes care of logging the messages.
Using Wire Tap for Custom Logging
Let’s look at an example. At Rider Auto Parts, you’re required to log any incoming orders. Figure 12.5 shows the situation where orders flowing in from CSV files are wiretapped to an audit service before moving on for further processing.
Figure 12.5. Using a wire tap to tap incoming files to an audit service before the file is translated to XML and sent to an order queue for further processing

Implementing the routes outlined in figure 12.5 in Camel is fairly straightforward:
public void configure() throws Exception {
   from("file://rider/orders")
       .wireTap("seda:audit")
       .bean(OrderCsvToXmlBean.class)
       .to("jms:queue:orders");

   from("seda:audit")
       .bean(AuditService.class, "auditFile"); }
The first route is routing incoming order files. These are wire-tapped to an internal SEDA queue ("seda:audit") for further processing. The messages are then transformed from CSV to XML using the OrderCsvToXmlBean bean before being sent to a JMS queue.
The second route is used for auditing. It consumes the tapped messages and processes them with an AuditService bean, which follows:
public class AuditService {
    private Log LOG = LogFactory.getLog(AuditService.class);

    public void auditFile(String body) {
        String[] parts = body.split(",");
        String id = parts[0];
        String customerId = parts[1];
        String msg = "Customer " + customerId + " send order id " + id;
        LOG.info(msg);
    }
}
This implementation of the AuditService bean has been kept simple by logging the audit messages using the Apache Commons Logging log kit. The actual logging is done in the auditFile method.
The source code for the book contains this example in the chapter12/logging directory, which you can try using the following Maven goal:
mvn test -Dtest=AuditTest
Using the Camel Log Component
Camel provides a Log component that’s capable of logging the Camel Message using a standard format at certain interesting points. To leverage the Log component, you simply route a message to it, as follows:
public void configure() throws Exception {
    from("file://rider/orders")
        .to("log:input)
        .bean(OrderCsvToXmlBean.class)
        .to("log:asXml)
        .to("jms:queue:orders");
}
In this route, you use the Log component in two places. The first is to log the incoming file, and the second is after the transformation.
You can try this example using the following Maven goal from the chapter12/logging directory:
mvn test -Dtest=LogComponentTest
If you run the example, it will log the following:
2010-01-10 14:00:23,389 [: FileComponent] INFO  incoming
- Exchange[BodyType:org.apache.camel.component.file.GenericFile,
Body:123,4444,20100110,222,1]
2010-01-10 14:00:23,399 [: FileComponent] INFO  asXml
- Exchange[BodyType:String,
Body:<order><id>123/id><customerId>4444/customerId><date>20100110
</date><item><id>222</id><amount>1</amount></itemn></order>]
By default, the Log component will log the message body and its type at INFO logging level. Notice that in the first log line, the type is GenericFile, which represents a java.io.File in Camel. In the second log line, the type has been changed to String, because the message was transformed to a String using the OrderCsvToXmlBean bean.
You can customize what the Log component should log by using the many options it supports. Consult the Camel Log documentation for the options (http://camel.apache.org/log.html). For example, to make the messages less verbose, you can disable showing the body type and limit the length of the message body being logged by using the following configuration:
log:incoming?showBodyType=false&maxChars=40
That results in the following output:
2010-01-10 14:06:10,187 [: FileComponent] INFO  incoming
- Exchange[Body:123,4444,20100110,222,1]
2010-01-10 14:06:10,197 [: FileComponent] INFO  asXml
- Exchange[Body:<order><id>123/id><customerId>444...]
Tip
The Log component has a showAll option to log everything from the Exchange.
The Log component is used to log information from the Exchange, but what if you want to log a message in a custom way? What you need is something like System. out.println, so you can input whatever String message you like into the log. That’s where the Log EIP comes in.
Using the Log EIP
The Log EIP is built into the Camel DSL. It allows you to log a human-readable message from anywhere in a route, as if you were using System.out.println. It’s primarily meant for developers, so they can quickly output a message to the log console. But that doesn’t mean you can’t use it for other purposes as well.
Suppose you want to log the filename you received as input. This is easy with the Log EIP—all you have to do is pass in the message as a String:
public void configure() throws Exception {
    from("file://riders/orders")
        .log("We got incoming file ${file:name} containing: ${body}")
        .bean(OrderCsvToXmlBean.class)
        .to("jms:queue:orders");
}
The String is based on Camel’s Simple expression language, which supports the use of placeholders that are evaluated at runtime. In this example, the filename is represented by ${file:name} and the message body by ${body}. If you want to know more about the Simple expression language, refer to appendix A.
You can run this example using the following Maven goal from the chapter12/logging directory:
mvn test -Dtest=LogEIPTest
If you run this example, it will log the following:
2010-01-10 15:11:18,001 [: FileComponent] INFO  route1
- We got incoming file someorder.csv containing: 123,4444,20100110
The Log EIP will, by default, log at INFO level using the route ID as the logger name. In this example, the route was not explicitly named, so Camel assigned it the name route1.
Using the Log EIP from Spring XML is also easy, as shown here:
<camelContext id="camel" xmlns="http://camel.apache.org/schema/spring">
  <route>
    <from uri="file://target/rider/orders"/>
    <log message="Incoming file ${file:name} containing: ${body}"/>
    <bean beanType="camelinaction.OrderCsvToXmlBean"/>
    <to uri="jms:queue:orders"/>
  </route>
</camelContext>
The Spring example is also provided in the source code for the book, which you can try using the following Maven goal:
mvn test -Dtest=LogEIPSpringTest
The Log EIP also offers options to configure the logging level and log name, in case you want to customize those as well, as shown below in Spring XML:
<log message="Incoming file ${file:name} containing: ${body}"
     logName="Incoming" loggingLevel="DEBUG"/>
In the Java DSL, the logging level and log name are the first two parameters. The third parameter is the log message:
.log(LoggingLevel.DEBUG, "Incoming",
     "Incoming file ${file:name} containing: ${body}")
Anyone who has had to browse millions of log lines to investigate an incident knows it can be hard to correlate messages.
Using Correlation IDs
When logging messages in a system, the messages being processed can easily get interleaved, which means the log lines will be interleaved as well. What you need is a way to correlate those log messages so you can tell which log lines are from which messages.
You do this by assigning a unique ID to each created message. In Camel, this ID is the ExchangeId, which you can grab from the Exchange using the exchange.getExchangeId() method.
Tip
You can tell the Log component to log the ExchangeId by using the following option: showExchangeId=true. When using the Log EIP, you can use ${id} from the Simple expression language to grab the ID.
To help understand how and when messages are being routed, Camel offers Tracer, which logs message activity as it occurs.
12.3.4. Using Tracer
Tracer’s role is to trace how and when messages are routed in Camel. It does this by intercepting each message being passed from one node to another during routing. Figure 12.6 illustrates this principle.
Figure 12.6. Tracer sits between each node in the route (at  ,
,  , and
, and  ) and traces the message flow.

You may remember being told that Camel has a Channel sitting between each node in a route—at points ![]() ,
, ![]() , and
, and ![]() in figure 12.6. The Channel has multiple purposes, such as error handling, security, and interception. Because the Tracer is implemented as an interceptor,
it falls under the control of the Channel, which at runtime will invoke it.
in figure 12.6. The Channel has multiple purposes, such as error handling, security, and interception. Because the Tracer is implemented as an interceptor,
it falls under the control of the Channel, which at runtime will invoke it.
To use the Tracer, you need to enable it, which is easily done in either the Java DSL or Spring XML. In the Java DSL, you enable it by calling context.setTracing(true) from within the RouteBuilder class:
public void configure() throws Exception {
    context.setTracing(true);
    ...
 }
In Spring XML, you enable the Tracer from <camelContext> as follows:
<camelContext id="camel" trace="true"
              xmlns="http://camel.apache.org/schema/spring">
When running with Tracer enabled, Camel will record trace logs at INFO level, which at first may seem a bit verbose. To reduce the verbosity, we have configured the Tracer to not show properties and headers. Here is an example of Tracer output:
2010-01-10 16:40:58,229 [: FileComponent] INFO  Tracer
- ca18a05b-a7a6-401b-8f83-e97ba35df87e >>> (route1)
from(file://target/rider/orders) --> wireTap(seda://audit) <<<
Pattern:InOnly, BodyType:org.apache.camel.component.file.GenericFile,
Body:123,4444,20100110,222,1
2010-01-10 16:40:58,241 [: FileComponent] INFO  Tracer
- ca18a05b-a7a6-401b-8f83-e97ba35df87e >>> (route1) wireTap
(seda://audit) --> camelinaction.OrderCsvToXmlBean@129103 <<<
Pattern:InOnly, BodyType:org.apache.camel.component.file.GenericFile,
Body:123,4444,20100110,222,1
2010-01-10 16:40:58,241 [1: seda://audit] INFO  Tracer
- b4d4c842-3884-41aa-a216-d230a6661a9e >>> (route2)
from(seda://audit) --> camelinaction.AuditService@5db23e <<<
Pattern:InOnly, BodyType:org.apache.camel.component.file.GenericFile,
Body:123,4444,20100110,222,1
2010-01-10 16:40:58,251 [: FileComponent] INFO  Tracer
- ca18a05b-a7a6-401b-8f83-e97ba35df87e >>> (route1)
camelinaction.OrderCsvToXmlBean@129103 --> seda://queue:orders <<<
Pattern:InOnly, BodyType:String,
Body:<order><id>123/id><customerId>4444/customerId><date>20100110
</date><item><id>222</id><amount>1</amount></item></order>
The interesting thing to note from the trace logs is that the log starts with the exchange ID, which you can use to correlate messages. In this example, there are two different IDs in play: ca18a05b-a7a6-401b-8f83-e97ba35df87e and b4d4c842-3884-41aaa216-d230a6661a9e. You may wonder why we have two IDs when there is only one incoming message. That’s because the wire tap creates a copy of the incoming message, and the copied message will use a new exchange ID because it’s being routed as a separate process.
Next, the Tracer outputs which route the message is currently at, followed by the from --> to nodes. This is probably the key information when using Tracer, because you can see each individual step the message takes in Camel.
Then the Tracer logs the message exchange pattern, which is either InOnly or InOut. Finally, it logs the information from the Message, just as the Log component would do.
Tip
You can use the Delay interceptor to slow processing down to a pace we humans can follow. For example, you could delay and tail the log file, watching what happens in the log file while the message is being routed, to get a better understanding of what’s going on. You can learn more about the Delay interceptor in the Camel documentation: http://camel.apache.org/delay-interceptor.html.
Customizing the Tracer
We just said that we had customized the Tracer to be less verbose. This can be done by defining a bean in the Registry with the bean ID traceFormatter. In Spring XML this is easy—all you do is this:
<bean id="traceFormatter"
      class="org.apache.camel.processor.interceptor.DefaultTraceFormatter">
    <property name="showProperties" value="false"/>
    <property name="showHeaders" value="false"/>
</bean>
The formatter has many other options that you can read about in its online documentation (http://camel.apache.org/tracer). One of the options is maxChars, which can limit the message body being logged. For example, setting it to a value of 200 will limit the Tracer to only output at most 200 characters.
If you have many routes, the Tracer will output a lot of logs. Fortunately, you can customize the Tracer to only trace certain routes. You can even do this at runtime using JMX, but we’ll get to that a bit later.
Enabling or Disabling Tracer for Specific Routes
Remember that you can enable the Tracer from the <camelContext> tag? You can do the same with the <route> tag.
Suppose you only wanted to trace the first route—you could enable the Tracer on that particular route, as shown here:
<camelContext id="camel" xmlns="http://camel.apache.org/schema/spring">
    <route trace="true">
        <from uri="file://rider/orders"/>
        <wireTap uri="seda:audit"/>
        <bean beanType="camelinaction.OrderCsvToXmlBean"/>
        <to uri="jms:queue:orders"/>
    </route>

    <route>
        <from uri="seda:audit"/>
        <bean beanType="camelinaction.AuditService"/>
    </route>
</camelContext>
Doing this from the Java DSL is a bit different. You need to do it using the fluent builder syntax by using either tracing() or noTracing(), as follows:
public void configure() throws Exception {
    from("file://target/rider/orders")
        .tracing()
        .wireTap("seda:audit")
        .bean(OrderCsvToXmlBean.class)
        .to("jms:queue:orders");

    from("seda:audit")
        .bean(AuditService.class, "auditFile");
}
If a route isn’t explicitly configured with a Tracer, it will fall back and leverage the configuration from the CamelContext. This allows you to quickly turn tracing on and off from the CamelContext but still have some special routes with their own settings.
The Tracer can also be managed using JMX. This allows you to enable tracing for a while to see what happens and identify issues.
Managing Tracer Using JMX
The Tracer can be managed from the JMX console in two places. You can enable or disable tracing at either the context or at routes. For example, to enable tracing globally, you could change the tracing attribute to true at the CamelContext MBean. You could do the same on a per route basis using the Routes MBeans.
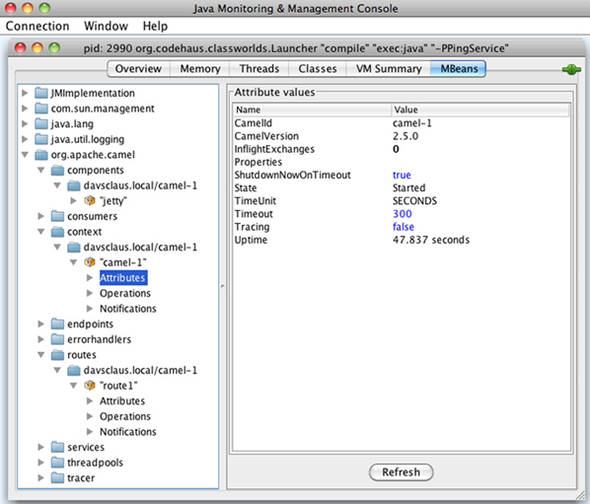
You can configure what the Tracer logs from the Tracer MBean, as shown in figure 12.7.
Figure 12.7. Managing the Tracer from JMX allows you to customize the trace logging and change many attributes at runtime.

We’ve prepared an example for you to try in the source code for the book. First, run this Maven goal in the chapter12/tracer directory:
mvn compile exec:java -PManageTracer
This will start an application that will run for a while.
Then start jconsole and connect to the application. Click on the MBeans tab and expand the org.apache.camel node in the tree. Figure 12.8 shows where you’re going.
Figure 12.8. To enable tracing, select the CamelContext under the Context node and change the Tracing attribute from false to true.

Click on the value for the Tracing attribute, which should be editable. Change the value from false to true, and press Enter to confirm. You should be able to see the changes in the console logged by the application.
Spend some time playing with this. For example, change some of the other options on the Tracer.
Monitoring applications via the core logs, custom logging, and Tracer is like looking into Camel’s internal journal after the fact. If the log files get very big, it may feel like you’re looking for a needle in a haystack. Sometimes you might prefer to have Camel call you when particular events occur. This is where the notification mechanism comes into play.
12.3.5. Using notifications
For fine-grained tracking of activity, Camel’s management module offers notifiers for handling internal notifications. These notifications are generated when specific events occur inside Camel, such as when an instance starts or stops, when an exception has been caught, or when a message is created or completed. The notifiers subscribe to these events as listeners, and they react when an event is received.
Camel uses a pluggable architecture, allowing you to plug in and use your own notifier, which we’ll cover later in this section. Camel provides the following notifiers out of the box:
- LoggingEventNotifier—A notifier for logging a text representation of the event using the Apache Commons Logging framework. This means you can use log4j, which has a broad range of appenders that can dispatch log messages to remote servers using UDP, TCP, JMS, SNMP, email, and so on.
- PublishEventNotifier—A notifier for dispatching the event to any kind of Camel endpoint. This allows you to leverage Camel transports to broadcast the message any way you want.
- JmxNotificationEventNotifier—A notifier for broadcasting the events as JMX notifications. For example, management and monitoring tooling can be used to subscribe to the notifications.
You’ll learn in the following sections how to set up and use an event notifier and how to build and use a custom notifier.
Warning
Because routing each exchange produces at least two notifications, you can be overloaded with thousands of notifications. That’s why you should always filter out unwanted notifications. The PublishEventNotifier will leverage Camel to route the event message, which will potentially induce a second load on your system. That’s why the notifier is configured by default to not generate new events during processing of events.
Configuring an Event Notifier
Camel doesn’t use event notifiers by default, so to use a notifier you must configure it. This is done by setting the notifier instance you wish to use on the ManagementStrategy. When using the Java DSL, this is done as shown here:
LoggingEventNotifier notifier = new LoggingEventNotifier();
notifier.setLogName("rider.EventLog");
notifier.setIgnoreCamelContextEvents(true);
notifier.setIgnoreRouteEvents(true);
notifier.setIgnoreServiceEvents(true);
context.getManagementStrategy().setEventNotifier(notifier);
First you create an instance of LoggingEventNotifier, because you’re going to log the events using log4j. Then you set the log name you wish to use. In this case, you’re only interested in some of the events, so you ignore the ones you aren’t interested in.
The configuration when using Spring XML is a bit different, because Camel will pick up the notifier automatically when it scans the registry for beans of type EventNotifier on startup. This means you just have to declare a Spring bean, like this:
<bean id="eventLogger"
      class="org.apache.camel.management.LoggingEventNotifier">
    <property name="logName" value="rider.EventLog"/>
    <property name="ignoreCamelContextEvents" value="true"/>
    <property name="ignoreRouteEvents" value="true"/>
    <property name="ignoreServiceEvents" value="true"/>
</bean>
You can also write your custom EventNotifier instead of using the built-in notifiers.
Using a Custom Event Notifier
Rider Auto Parts wants to integrate an existing Camel application with the company’s centralized error log database. They already have a Java library that’s capable of publishing to the database, and this makes the task much easier. Figure 12.9 illustrates the situation.
Figure 12.9. Failure events must be published into the centralized error log database using the custom RiderEventNotifier.

They decide to implement a custom event notifier named RiderEventNotifier, which uses their own Java code, allowing ultimate flexibility. The following listing shows the important snippets of how to implement this.
In listing 12.1, you extend the EventNotifierSupport class, which is an abstract class meant to be extended by custom notifiers. If you don’t want to extend this class, you can implement the EventNotifier interface instead. The RiderFailurePublisher class is the existing Java library for publishing failure events to the database.
Listing 12.1. A custom event notifier publishes failure events to a central log database

The notify method is invoked by Camel with the event being passed in as a java.util.EventObject instance. You use an instanceof test to filter for the events you’re interested in, which are failure events ![]() . Then information is extracted from the event, such as the unique exchange ID and the exception message to be published.
This information is then published using the existing Java library
. Then information is extracted from the event, such as the unique exchange ID and the exception message to be published.
This information is then published using the existing Java library ![]() .
.
Tip
If you have any resources that must be initialized, Camel offers doStart and doStop methods for this kind of work, as shown in listing 12.1.
The source code for the book contains this example in the chapter12/notifier directory, which you can try using the following Maven goal:
mvn test -Dtest=RiderEventNotifierTest
We’ve now reviewed four ways to monitor Camel applications. You learned to use Camel’s standard logging capabilities and to roll a custom solution when needed. In the next section, we’ll take a further look at how to manage both Camel and your custom Camel components.
12.4. Managing Camel applications
We already touched on how to manage Camel in section 12.2, where we covered how to use JMX with Camel. In this section, we’ll take a deeper dive into management-related use cases and show how you can management-enable your custom Camel components and services.
We’ll start by looking at how you can manage the lifecycles of your Camel applications.
12.4.1. Managing Camel application lifecycles
It’s essential to be able to manage the lifecycles of your Camel applications. You should be able to stop and start Camel in a reliable manner, and you should be able to pause or stop a Camel route temporarily, to avoid taking in new messages while an incident is being mitigated. Camel offers you full lifecycle management on all levels.
Suppose you want to stop an existing Camel route. To do this, you connect to the application with JMX as you learned in section 12.2. Figure 12.10 shows JConsole with the route in question selected.
Figure 12.10. Selecting the route to manage in JConsole

As you can see in figure 12.10, route1 has been selected from the MBeans tree. You can view its attributes, which reveal various stats such as the number of exchanges completed and failed, its performance, and so on. The State attribute displays information about the lifecycle—whether it’s started or stopped.
To stop the route, select the Operations entry and click the stop operation. Then return to the Attributes entry and click the Refresh button to update the attributes. You should see the State attribute’s value change to Stopped.
Managing Consumers
Starting and stopping routes is a common thing to do, but what if you want to adjust how the routes behave at runtime? Camel allows you to manage the consumers, and you can adjust them at runtime.
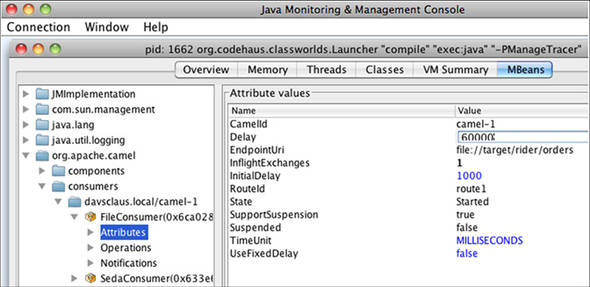
Imagine you have a route that uses a file consumer to pick up new files, and you want to change the polling interval for the file consumer. Figure 12.11 shows how you can do this by selecting the file consumer under consumers in the MBean tree. You can then change the Delay attribute by clicking on it and editing it. The changes to the attributes aren’t enforced immediately. You have to restart the consumer, which is done by invoking the stop and then the start operation.
Figure 12.11. Adjusting a file consumer at runtime by changing the Delay attribute
You may have built some Camel components of your own that you would like to manage. This can also be done.
12.4.2. Managing custom Camel components
Suppose Rider Auto Parts has developed a Camel ERP component to integrate with their ERP system, and the operations staff has requested that the component be managed. The component has a verbosity switch that should be exposed for management. Running with verbosity enabled allows the operations staff to retrieve additional information from the logs, which is needed when some sort of issue has occurred.
Listing 12.2 shows how you can implement this on the ERPEndpoint class, which is part of the ERP component. This code listing has been abbreviated to show only the relevant parts of the listing—the full example is in the source code for the book in the chapter12/custom directory.
Listing 12.2. Management-enabling a custom endpoint

If you’ve ever tried using the JMX API to expose the management capabilities of your custom beans, you’ll know it’s a painful
API to leverage. It’s better to go for the easy solution and leverage Spring JMX. You’ll notice, in the source code from listing 12.2, that it uses the Spring @ManagedResource annotation ![]() to expose this class as an MBean. In the same way, you can expose the verbose property as a managed attribute by using the @ManagedAttribute
to expose this class as an MBean. In the same way, you can expose the verbose property as a managed attribute by using the @ManagedAttribute ![]() annotation on the getter and setter methods.
annotation on the getter and setter methods.
What remains is to tell Camel to enlist this MBean for management, which is done by implementing the ManagementAware interface. This interface brings in the getManagedObject method ![]() , where you simply return this.
, where you simply return this.
You can run the following Maven goal from chapter12/custom directory to try out this example:
mvn compile exec:java -Pcustom
When you do, the console will output a log line every 5 seconds, as the route below illustrates:
from("timer:foo?period=5000")
    .setBody().simple("Hello ERP calling at ${date:now:HH:mm:ss}")
    .to("erp:foo")
    .to("log:reply");
What you want to do now is turn on the verbose switch from your custom ERP component. Figure 12.12 shows how this is done from JConsole.
Figure 12.12. Enabling the Verbose attribute at runtime using JConsole
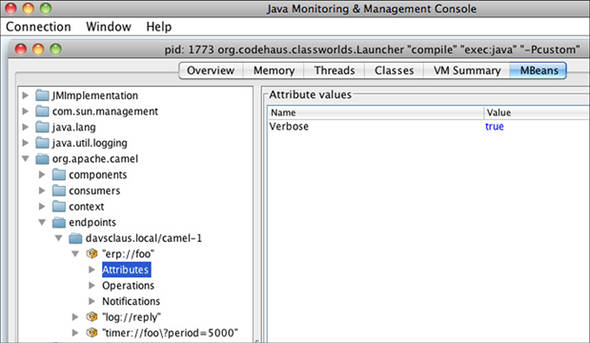
As you can see in figure 12.12, your custom component is listed under endpoints as erp://foo, which was the URI used in the route. The figure also shows the Verbose attribute. If you change this value to true, the console should immediately reflect this change. The first two of the following lines are from before the verbose switch was enabled. When the switch is enabled, it starts to output Calling ERP..., as shown below:
2010-01-30 15:09:49,118 [foo            ] INFO  reply
- Exchange[BodyType:String, Body:Simulated response from ERP]
2010-01-30 15:09:54,118 [foo            ] INFO  reply
- Exchange[BodyType:String, Body:Simulated response from ERP]
Calling ERP with: Hello ERP calling at 15:09:59
2010-01-30 15:09:59,118 [foo            ] INFO  reply
- Exchange[BodyType:String, Body:Simulated response from ERP]
Calling ERP with: Hello ERP calling at 15:10:04
2010-01-30 15:10:04,118 [foo            ] INFO  reply
- Exchange[BodyType:String, Body:Simulated response from ERP]
What you have just learned about management-enabling a custom component is in fact the same principle Camel uses for its components. A Camel component consists of several classes, such as Component, Endpoint, Producer, and Consumer, and you can management-enable any of those. For example, the schedule-based components, such as the Timer, allow you to manage the consumers to adjust how often they should trigger.
Congratulations! You have now learned all there is to managing Camel applications and enlisting your custom components for management.
12.5. Summary and best practices
A sound strategy for monitoring your applications is necessary when you take them into production. Your organization may already have strategies that must be followed for running and monitoring applications.
In this chapter, we looked at how you can monitor your Camel applications using health-level checks. You learned that existing monitoring tools could be used via SNMP or JMX protocols. Using JMX allows you to manage Camel at the application level, which is essential for lifecycle management, and performing functions such as stopping a route.
We also looked at what Camel has to offer in terms of logging. You learned about the Camel logs and how you can use custom logging. We also covered the Camel notification system, which is pluggable, allowing you to hook in your own notification adapter and send notifications to a third party.
Here are a few simple guidelines:
- Involve the operations team. Monitoring and management isn’t an afterthought. You should involve the operations team early in the project’s lifecycle. Your organization likely already has procedures for managing applications, which must be followed.
- Use health checks. For example, develop a happy page that does an internal health check and reports back on the status. A happy page can then easily be accessed from a web browser and monitoring tools.
- Provide informative error messages. When something goes wrong, you want the operations staff receiving the alert to be able to understand what the error is all about. If you throw exceptions from business logic, include descriptive information about what’s wrong.
- Use the Tracer. If messages aren’t being routed as expected, you can enable the Tracer to see how they’re actually being routed. But beware; the Tracer can be very verbose and your logs can quickly fill up with lines if your application processes a lot of messages.
- Read log files from testing. Have developers read the log files to see which exceptions have been logged. This can help them preemptively fix issues that otherwise could slip into production.
Management and monitoring aren’t the sole tasks the operations staff plays with regards to your Camel applications. The staff is also very much involved in the deployment process, taking your applications into production. The next chapter covers this topic, walking through the various deployment strategies.