10
Report Writing
“… a report covers everything that has to be covered but nothing more.”
—H. A. Shearing and B. C. Christian
COMMUNICATION AT WORK
Rajesh Tewari, a middle-level executive in the marketing department of Samsung, Noida, faced some difficulties when he was asked to submit a report on his plan to expand the company’s retail outlets in metropolitan areas he had recently visited. More than a week had passed since his visit, but he had not been able to begin the report. Something or the other kept happening to make him postpone writing the report. He felt that if he had been asked to write an essay on his business visits to Mumbai and Chennai, he could have easily written it. But writing a report, he thought, was a technical thing. He thought he did not know how a report was written. Finally, he searched the Internet to learn about the form and structure of short technical/business reports. Before it was too late, he hurriedly dashed off a report to his senior manager.
However, the report left the senior manager asking himself several questions that were not answered by Rajesh in his report. Moreover, Rajesh had presented the data in words that ran into several pages. He failed to include graphs and illustrations that would give the reader an idea of the overall picture at a glance, and this further affected the quality of his report.
Upon completion of this chapter, you should be able to:
-
Understand that a report and an essay are two distinct forms of written communication and be able to differentiate between their physical structures and the styles in which they are written.
-
Know the various types of reports and their essential elements.
-
Develop organizing and outlining skills.
-
Learn how to write both long and short formal reports in a clear, objective style, using the appropriate layout.
-
Know how to write abstracts and summaries, introductions, final recommendations, and conclusions.
-
Understand the role and use of graphics in reports.
WHAT IS A REPORT?
After the letter and the memo, the report is the most used form in business writing. A report can be defined as a communication in which the writer (or speaker if it is an oral report) provides information to some individual or organization because it is his or her responsibility to do so.1 It is an assigned communication for a purpose and for a specific receiver/reader.
The common element in all reports is the element of responsibility. The writer is obliged to communicate what he or she knows to those who need this information, as a part of an assigned, clearly defined, time-bound task.
The differences between a report and other forms of writing are:
- Other forms of writing, such as essays, are subjective in nature. They reflect the writer’s personality.
- Reports generally draw on outside sources. They present facts, conclusions, and recommendations based on investigation and analysis of data obtained by observation of facts. Appendix 2 discusses the investigation process in a research study in detail.
- The word “paper” can mean several things, such as an article, a detailed report, or a project report. However, it most commonly refers to research writing.
- Reports have a highly structured format.
- Each part of a report is numbered and captioned with headings and sub-headings.
- The language of a report is concise and concrete.
- Reports contain recommendations and conclusions.
- They make use of tables and graphs.
- Reports are usually preceded by a summary.
- Reports can be oral or written, but essays are always written.
- An essay can be factual, but it remains subjective in its treatment and presentation. The essayist does not usually offer evidence for his or her writing, nor does the reader look for it. The reader of a report, on the other hand, looks for facts and evidence.
- As a form of creative writing, an essay’s purpose is largely self-expression for the author and providing entertainment or enjoyment for the reader.
- An essay is rooted in the writer’s imagination, whereas a report is rooted in investigation and analysis. This is why an essay has a beginning, but may not have a report’s logically derived conclusion. Moreover, it has no signposts, headings or sub-headings, or bullet points to indicate a coherent structure that moves from the beginning, through the middle, to the end.
1
Understand that a report and an essay are two distinct forms of written communication and be able to differentiate between their physical structures and the styles in which they are written.
The common element in all reports is the element of responsibility.
Thus, a report is distinct from an essay or any other form of writing.
THE PURPOSE OF A REPORT
While collecting data, the investigator should remember that the report is not a descriptive statement of facts, events, or future possibilities. For example, the purpose of a report is not fulfilled if it speaks about “the possibility of change of work site”. Instead, the report should explain the reasons for changing the workplace, discuss the need for doing so, compare the relative advantages of different choices available, and choose and recommend the best option. The basic purpose of a report is to help the management identify the reasons underlying a specific situation. The factors responsible for the problem, the alternatives available for solving it, and the best course of action to take emerge from a thorough study of all relevant facts and factors. The main purpose of report is to present specific conclusions regarding the problem’s existence and solution.
The basic purpose of a report is to help the management identify the reasons underlying a specific situation.
KINDS OF REPORTS
Broadly speaking, reports are of two kinds:
- Formal reports that contain all essential elements of a report
- Semi-formal/informal reports
2
Know the various types of reports and their essential elements.
Reports are known by the names from which they get their purpose and form. They are usually identified as:
- Routine reports: reports made by filling in a printed form
- Letter reports: reports in the form of letters
- Memo reports: reports in the form of memos
- Progress reports: reports on the progress and status of a project
- Periodic reports: reports for keeping records, made routinely at regular intervals
- Laboratory reports: reports on the results of laboratory work
- Short reports: short reports that are like formal reports in tone and other general qualities, but are simpler in design because they do not have all the front and back matter, and have a shorter main body
- Formal reports: reports that are impersonal in tone, detailed, and fully structured
In the world of business, a report can vary from a short, informal account (essentially a memo) of the present state of a project to a long, formal, well-documented report of a corporation or government department. Each organization normally has its own in-house method of presentation, which its report writers will adhere to. The writer of a report in an organization is guided by the following:
- A specific layout—the sequence in which information is presented. For instance, recommendations and conclusions may precede the discussion.
- Its cover details and terms of reference—this includes the name of the organization, report code number, and other related information about the author, subject, and details of submission.
THE TERMS OF REFERENCE
In an organization, the task of producing a report on a specific problem can be assigned to an individual or a team. The problem, purpose, scope, limitations, budget, cultural considerations related to the ethical values of the organization, and the date for submission (time limit) are clearly specified when the report is authorized. These specifications guide the report writer. They form what is called “the terms of reference”. The person authorizing or sanctioning the writing of the report sets down these terms.
The writer has to first investigate the problem, search for facts, gather evidence, and then analyse the data before presenting observations, conclusions, and suggestions for solutions to the problem.
The process of writing a report is left entirely to the writer. Report writing involves research, analysis, and presentation. The writer has to first investigate the problem, search for facts, gather evidence, and then analyse the data before presenting observations, conclusions, and suggestions for solutions to the problem. The writer can choose from a variety of methods when studying the problem—visits, interviews, questionnaires, data banks, past records of the organization, and consulting existing literature and documents as relevant sources of information. The writer also needs to know the total context and background of the subject of investigation. Background study and data collection may sometimes pose difficulties, but without this effort, a report will not be authentic.
THE OBJECTIVES OF A REPORT
A report is primarily a source of information that helps in decision-making. It can also be used to offer a solution to a business problem. Its objective can be:
- To give information about a company’s activities, progress, plans, and problems.
- To record events for future reference.
- To recommend a specific action.
- To justify and persuade readers about the need for action in controversial situations.
- To present facts to the management to help decide the direction the business should choose.
A report is primarily a source of information that helps in decision-making.
The study and report should be comprehensive. They should examine all aspects of a problem and the potential solutions. The recommended solution and its advantages or disadvantages should be analysed in relation to management as a whole, not just the entrepreneur. All groups—workers, staff, customers, and so on whose interests may be affected in different ways by a change should be considered.
The report writer should consider the objectives of the report from the point of view of its recipients and ask the following questions as guidelines:
- For whom is the report written?
- What is their level of information and education?
- How much do they already know about the problem?
- Why do they want the report?
- What do they want to know, and in how much detail?
- How does the report’s result (conclusion) help them?
PLANNING AND ORGANIZING INFORMATION
The writer of a report should choose a method of data collection according to the nature and purpose of the proposed study. Before writing the report, he or she should evaluate the information collected for its relevance and usefulness, and should plan and organize the information. The findings should be logically grouped to form an outline of the report.
3
Develop organizing and outlining skills.
Planning the message before writing the report will make it clear and easy to follow. Planning involves organizing the ideas already identified as important. In the case of a short, simple piece of writing such as a letter or memo, the material can be organized by deciding what points to include and how to arrange them. When the material to be covered is vast and complex, like in long reports, the writer must plan not just the sequence of presentation, but also the subordination and coordination of ideas and facts in relation to each other and to the text as a whole.
Planning the message before writing the report will make it clear and easy to follow.
Organizing involves two parts:
- Sequencing information
- Outlining information
Sequencing Information
Information can be arranged in three different ways:
- Randomly
- Sequentially
- Hierarchically
Random Organization
Random organization, as the term suggests, indicates no visible relationship among the ideas and facts presented. The communicator (writer/speaker) expresses thoughts and ideas as they come into his or her mind; the document is just a string of ideas, not a pattern.
Sequential Organization
A sequence is a set of things relating to one another in sequential order. Each item has the same relationship to each of the other items. Examples are alphabetical, numerical, or chronological ordering.
Hierarchical Organization
Hierarchical organization is an ordering of items according to their relative importance. It is based on multi-level relationships. In this pattern, items have other items placed under them. Hierarchical organization is best shown as a tree-structure given in Exhibit 10.1.
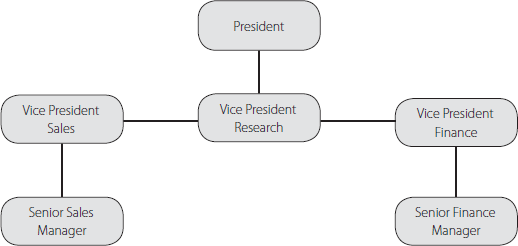
Hierarchical organization is based on multi-level relationships.
This hierarchical relation among ideas/items is what an outline shows. This form of organization helps a reader understand the information more easily. Random and sequential organization, which are used in computer theory, are not as well suited to reports. A reader would feel lost in the maze of unarranged and unpatterned ideas. Hence, related ideas should be grouped together.
Grouping material for writing is done by considering levels of generality. Generality is a relative concept because each idea is to be viewed in the context of the whole set of ideas. One idea is more general than another if it represents a larger category. For example, “literature” is more general than “novel”, and “communication” is less specific than “report”. “Report” is more general than “progress report”, which itself is more general than “third-term progress report”, which in turn is less specific than “third-term progress report of XYZ”.
Considering levels of generality is useful as both general statements and specific details are included in effective communication. For example, in informative and persuasive writing, general statements have to be developed with specific facts, reasons, arguments, and examples.
Outline As a Structuring Device
An outline is a shape-giving device. It is a valuable planning strategy. By making an outline, the writer structures the relevant ideas and groups them together on the basis of their generality. An outline can be used at different stages of report writing. For instance, before writing or presenting the report orally, an outline helps arrange and organize material; when revising, it can be used to see how far the first draft is logically arranged. An outline also points out any weakness in the written document, such as missing points or digressions from the main point.
An outline is a tentative plan or projection of what the final draft will say. It is possible for the outline to change somewhat during the actual writing. In that case, the writer should alter the original outline and ensure that the changes do not disturb the logic and order of the argument and ideas.
Formal Outline
In a formal outline, the content and format follow the conventions formed to show relationships among ideas clearly. A formal outline can be a topic outline or a sentence outline. A topic outline consists of a word or a phrase, whereas in a sentence outline each item is a complete sentence. The two methods are never used together in the same formal outline. However, a sentence outline is more helpful for writing. For example, “differences in the arts” is a topic outline, but a sentence outline such as “the arts differ in terms of objects, manner, and mode of imitation” provides more detail. A general layout of a formal outline is given in Exhibit 10.2.
Statement of thesis _________________________
-
First main idea ___________________________
-
First subordinate idea ______________________
-
First reason or illustration _____________________
-
Second reason or example _____________________
-
First supporting detail __________________
-
Second supporting detail _________________
-
-
-
Second subordinate idea ______________________
-
-
Second main idea ___________________________
In a formal outline, the content and format follow the conventions formed to show relationships among ideas clearly.
Framing an Outline
Some guidelines for framing an outline include:
- Introductory and concluding sentences: These do not form part of a formal outline. The thesis or the topic statement is placed before the first sentence.
- Numbers, letters, and indentations: The formal outline begins with the capitalized Roman numeral I, which numbers the first main idea and is followed by the Roman numerals II, III, and so on, which are used to indicate major subdivisions of the topic. Indented capital letters (A, B, C, and so on) are used to mark the next level of generality, while small letters (a,b,c, and so on) indicate a further level of generality, if any. This arrangement is based on the principle that each subdivision is placed above the next level of specific detail given by the outline. It may be noted that in a sentence outline if an entry is longer than one line, the second line is indented by one word. That means that the second line begins under the second word of the first line.
- At least two entries at each level: In an outline, there can be a topic numbered “I” only if there is “II” that follows it, and similarly, there can only be an “A” when there is a “B”. Without at least two parts, no category can be divided. Where a category has only one subdivision, it should either be left out or reclassified, or expanded to include at least two subdivisions.
For example:
Incorrect
- Standards of hygiene in the canteen not satisfactory
- Food left over from lunches
- Fridge not defrosted frequently
Correct
- Standards of hygiene in the canteen not satisfactory
- Safety issues regarding electrical sockets in the canteen
Correct
- Standards of hygiene in the canteen not satisfactory
- Food left over from lunches
- Fridge not defrosted frequently
- Safety issues regarding electrical sockets in the canteen
- Standards of hygiene in the canteen not satisfactory
- Levels of generality: All subdivisions should have the same level of generality. A main idea and a supporting detail cannot be placed at the same level.
Incorrect
- Starting an IT centre
- Conducting computer courses
Correct
- Starting an IT centre
- Opening a health resort
- No overlap: There should be a fresh point under each heading. The same idea should not be repeated in different places.
Incorrect
- People move away from villages
- The go in search of jobs
- They go to seek their livelihoods
Correct
- People move away from villages
- They go in search of jobs
- They often change their outlooks
- People move away from villages
- Parallelism: All statements (divisions and sub-divisions) should have grammatically parallel construction. For example, if one item begins with the –ing form of the verb, other items should also begin with form verb + –ing.
Incorrect
Correct
- Negotiating peace
- Promoting understanding
- Punctuation and capitalization: Only the first word or a proper noun should be capitalized in each entry. Please note that a full stop should be used at the end of each entry only when it is a sentence outline. No punctuation mark is used at the ends of entries in a topic outline.
Outlining is the key to organization; it is essential for writing any form of business communication. To determine the sequence of ideas (or presentation) in any piece of writing, the writer has to consider the level of importance of the information and also the order in which it should be known. For instance, when writing a report, one could mention the problem first and then discuss the method used to solve it, followed by findings and conclusions.
Since the reader of a report is more interested in the findings and conclusions, it is better to give more importance to these elements. The details of the problem and the methodology used to solve it receive less attention as they are of less interest to the reader. However, they provide the necessary background for the findings and conclusions. One could have an outline including all the four elements of a report in the form shown in Exhibit 10.3.
Introduction
Definition of the problem
Description of the methods used
Findings
Conclusions
As the statement of the problem and description of research methodology are of lesser interest to most readers, they can be put together as two elements under the same entry, Introduction. As the other two elements, findings and conclusions, are of greater interest, they are entered separately as item II and item III.
The effort and time devoted to forming an outline are rewarded by the gain in clarity and understanding of the levels of significance of different elements in the composition.
The effort and time devoted to forming an outline are rewarded by the gain in clarity and understanding of the levels of significance of different elements in the composition.
Cultural Differences in Report Details
There may be some differences in the way people from different cultures write reports. Here are some broad examples of how different types of details are emphasized in different cultures:
- German report writers consider historical facts and in-depth explanations very crucial for a proper understanding of problems and their solutions.
- French reports tend to present more abstract concepts and theories. The French are theorists by nature and are known for their creative concepts in all forms of art and literature.
- Latin Americans sometimes leave out negative information, and potential problems may not be reported and discussed.
- Indian report writers prefer to follow the conventional structure and offer the expected quantity of details, but when guided by the psychology of the reader, Indians modify the form suitably.
WRITING REPORTS
A report presents facts, conclusions, and recommendations in simple and clear words and in a logical and well-defined structure. The elements (parts) of a full report, in the order of their sequence in a long, formal report are:
- Cover
- Title page
- Acknowledgements
- Table of contents
- Executive summary
- Introduction
- Discussion/description
- Conclusions
- Recommendations
- Appendix
- List of references
- Bibliography
- Glossary
- Index
The first five elements (cover, title page, acknowledgements, table of contents, and executive summary) constitute the front matter; the next four elements (introduction, discussion, conclusions, and recommendations) form the main body; and the last five elements (appendix, list of references, bibliography, glossary, and index) constitute the back matter.
Structure of a Report
In the normal arrangement, the conclusions and recommendations are positioned after the discussion. However, this is not the case in the alternative arrangement of a report. Business executives are usually short of time and are, therefore, more interested in knowing the conclusions and recommendations of the study. A detailed description of the discussion may, therefore, appear after the conclusions and recommendations in the alternative arrangement.
Business executives are usually short of time and are, therefore, more interested in knowing the conclusions and recommendations of the study.
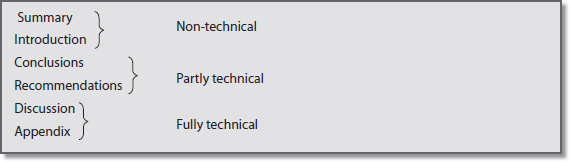
The order of elements in a formal business report may be as given in Exhibit 10.4. The researcher should also keep in mind the non-technical background of his or her readers and demarcate certain parts differently as shown in Exhibit 10.4.
Basic and Subsidiary Parts of a Report
The basic and subsidiary parts of a report are delineated in Exhibit 10.5.
Exhibit 10.5 Exhibit 10.5 Parts of a Formal Report
| Basic Parts of a Report | Subsidiary Parts of a Report |
|---|---|
| Executive summary | Cover |
| Introduction | Title page |
| Discussion | Table of contents |
| Recommendations | Bibliography/references |
| Appendix | Glossary |
Some subsidiary elements—the table of contents, the bibliography and references, and the glossary—are used only in long, formal reports. The cover and title page in short reports are replaced with the heading and other similar devices.
SHORT MANAGEMENT REPORTS
A short report is usually written either in the form of memorandum (memo) or a letter. Usually, reports meant for persons outside the company or clients are written in letter form. The short report:
- Uses the title page or just the report’s title as the heading or subject.
- Is usually in direct order, beginning with a summary or a statement summarizing the content.
- Presents findings, analysis, conclusions, and recommendations.
4
Learn how to write both long and short formal reports in a clear, objective style, using the appropriate layout.
Memos
Memos are used as internal messages in companies. They are informal and need very little introductory or background information. Their goal is to address and solve an internal problem. An example of a memorandum is given in Exhibit 10.6.
To: All departments
From: Debasish Roy, HR
Date: 19 August, 2010
Ref: MR/ 02/ 06
Subject: Pest-Control Problems
On 17 August 2010, I inspected the company office as part of my routine monthly inspection. The inspection concentrated on two main aspects—hygiene and maintenance issues in the office.
-
Hygiene: Standards of hygiene in the office need to be improved. Cleanliness and pestcontrol are becoming difficult issues because:
- Despite the fact that employees are allowed to carry only beverages to their desks, we constantly find food particles in the carpeted area. This attracts a lot of pests.
- Food left over after team get-togethers is frequently stored in the fridge and left there for days.
- Used coffee mugs and glasses left on desks and spilled sugar near the coffee machine attract ants.
-
Maintenance Issues: A little involvement on the part of employees can go a long way in helping reduce waste.
- Lights are not switched off as employees leave the office for the day.
- The printer is often overloaded because of multiple-page printouts. This also delays other peoples’ work. There is also a lot of wasted paper around the printer.
Recommendations
-
Employees are requested to avoid carrying food to their desks. Used coffee mugs and glasses should be returned to the pantry at the end of the day. Food stored in the fridge should be consumed in a day, and the maintenance team should be informed if coffee/sugar is spilled.
-
Employees are requested to switch off their cabin lights at the end of the day. To help save electricity, computer monitors can be switched off when not in use. Employees should not print more that 30 pages at a time using the common printer. Further, everyone is requested to take two-sided printouts if possible.
Letters
Letters are usually written to deal with smaller problems and are organized in an indirect order. They usually end on a note of goodwill. An example of a letter report is given in Exhibit 10.7.
30 August 2009
Terms of Reference
At the request of the General Manager, Mom and You, in his letter of 16 July 2009 (ref PO/ST/24/03), I was instructed to:
Investigate the reasons for the fall in profits at Mom and You, Noida, during the period 1 January 2009 to 30 June 2009.
Suggest corrective steps in light of the findings.
Procedure
The sales records for the period 1 January 2009 to 30 June 2009 were inspected and compared with those for the second half of 2008.
Two hundred customers were interviewed over seven days (2nd to 8th August).
The shop and its vicinity were carefully inspected.
The store manager, sales assistants and cashiers were interviewed.
Recent developments in Noida and the surrounding area were observed.
Findings
A study of the sales records show that profits fell from a monthly average of 8% in the second half of 2008 to an average of 6% in the first 6 months of 2009.
The factors responsible for the fall in profits can be divided into internal and external factors.
A. Internal
A new manager, Mr N.M. Shah, joined Mom and You in late 2008. Soon after joining, he went through a prolonged period of illness, which has clearly affected his efficiency in dealing with a new store.
Two of the sales assistants —Arun Sharma and Prem Kumar—have been uninvolved in their dealings with customers. A majority of the customers interviewed complained of their brusqueness and unhelpful attitude.
The cashier appointed between December and April to replace the previous cashier is inexperienced. The regional manager found that accounts books have not been maintained systematically, and there are gaps in some areas.
B. External
The prolonged construction of a flyover in Noida has affected the area. Customers prefer to avoid the dust and the traffic in this area and go to the new market that has opened in Sector 43.
The opening of Mother’s Angels in GP Mall has diverted some of the customers. The new mall has a big food court, multiplex and parking space, and this seems to have attracted some loyal customers.
Conclusions
The decline in profits is because of external developments—competition from a children’s store in the new mall and restricted access to the store because of ongoing construction activities.
The performance of the manager, along with the inexperience of the cashier and the discourtesy of some of the staff, is a factor that cannot be ignored.
Recommendations
Mr Shah should be consulted to help raise his efficiency and to provide him any support that may help him resolve his health issues. His performance should be reviewed again after six months.
Arun and Prem should be warned about their behaviour.
The cashier should be provided training.
The store and its offers should be given coverage in local newspapers. Special offers and children’s activities should be organized to promote the store and increase footfall.
The viability of the store be reviewed in December 2009.
P. Misra
Regional Sales Manager
M&Y Group of Stores
LONG FORMAL REPORTS
Some of the elements of a long formal report are discussed in detail in this section.
The Title Page
The title page includes the following:
- The heading (title of the report), which should be short, clear, and unambiguous
- The name and affiliation of the author(s)
- The department and date of issue
An example of a title page is given in Exhibit 10.8.
Acknowledgements
The writer of the report should thank everyone associated with the assignment and preparation of the report. He or she should be generous in expressing gratitude. An example is:
I thank my organization, PPL Feedback Packaging Limited, for giving me the opportunity to conduct this research project. A special word of thanks to Mr Suresh Kumar (Director & Chief Executive), Mr Nitin Khanna (DGM), and the executives of PPL Feedback Packaging Limited for giving me the necessary guidance and help.
I also thank all the respondents of the survey, who gave me valuable information to carry out the study.
Finally, I wish to thank my colleagues in the marketing department, whose inputs were invaluable to the research.
Cover Letter
The cover letter is usually written by top management or project guides as a preface or foreword to a report, reflecting the management’s policy and interpretation of the report’s findings, conclusions, and recommendations. It introduces the report and tells readers why it is being sent to them. The cover letter is usually placed between the cover and the title page. It is never bound inside the report. It can be written in the form of a memo, a letter, or a forwarding certificate.
Letter of Transmittal
Many times, a formal report is accompanied by a letter to outside readers. Although the letter of transmittal is usually placed after the title page, it functions as a greeting to the reader. The letter summarizes the findings, conclusions, and recommendations and gives an idea of what is in the report. It is best written in a direct, conversational manner.
- It begins by directly talking about the subject of the report. For example:
Dear Ms Singh,
Here is the report you requested on August 20 regarding a plot of land for your proposed playschool in Greater Noida.
- It then gives a brief review of the contents of the report.
- It acknowledges the contribution of others to the study, if any.
- The letter ends by thanking the person or body who authorized the report and expressing hope for future interaction. This letter should be written in the personal style of a business letter—that is, using personal pronouns, first person, and active voice. The tone should reflect sincerity. Nowadays, a cover letter is generally preferred to a letter of transmittal.
Table of Contents
Long reports must have a table of contents placed after the acknowledgements and before the executive summary. The table of contents is an important element in a long, formal report as it identifies the topics and their page numbers in the report (or any long document). The table of contents also indicates the hierarchy of topics and their sequence and mentions the main sections of the report exactly as they are worded in the text. An example is given in Exhibit 10.9.
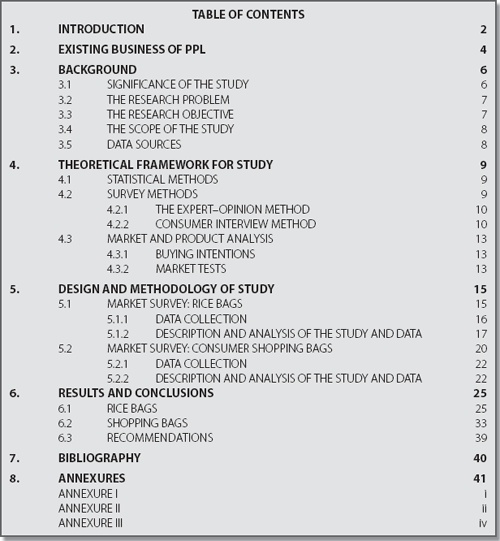
The table of contents indicates the hierarchy of topics and their sequence.
Abstract and Executive Summary
An abstract or executive summary comes immediately after the list of tables in the table of contents or on/after the title page itself. Normally, a report has either an abstract or an executive summary, based on the length of the report and expectations of readers. A company practice may be to have both an abstract and an executive summary with long reports.
5
Know how to write abstracts and summaries, introductions, final recommendations, and conclusions.
A summary:
- Should give the context of the report
- Should provide the most important findings, conclusions, and recommendations
- Should act as a time-saver for busy management executives
Usually, management reports use executive summaries instead of abstracts. An abstract is a summary of a report’s most important points. It can be either descriptive or informative and is generally written in about 200 words and in one paragraph. An executive summary gives a more detailed overview of a report than an abstract does. It can run into one or two pages. It presents the reader with a preview of the report’s findings, conclusions, recommendations, and impact on the company. Management executives sometimes need to know just the main contents of a report, specially its conclusions and recommendations, and a detailed synopsis in the form of an executive summary serves this purpose.
Descriptive Abstract
A descriptive abstract only mentions the topics discussed in the report. It does not give details on those topics. For details, the reader has to go through the report. Busy executives have little patience with such a skeletal account of a report’s important conclusions and recommendations. Therefore, descriptive abstracts are less popular with writers of business reports. For example, consider a descriptive abstract of the report “Identification of market potential and entry strategy for consumer paper bags”. It would be as follows:
A descriptive abstract only mentions the topics discussed in the report. It does not give details on these topics. Busy executives have little patience with such a skeletal account of a report’s important conclusions and recommendations.
The study finds that the market potential for paper bags is not picking up due to the price of paper bags when compared to polybags. It is recommended that the company PPL Feedback supply paper bags at a lesser cost to compete with polybags.
Informative Abstract
An informative abstract discusses the main subject and presents conclusions and recommendations. Formal reports and scientific and technical articles often use an informative abstract. An informative abstract for the report “Identification of market potential and entry strategy for consumer paper bags” would read as follows:
An informative abstract discusses the main subject and presents conclusions and recommendations.
This report explores new ways to expand the company’s (PPL Feedback and Packaging Limited) business, from industrial bags to consumer bags, to meet its growth targets.
The objective of the study was to study the market potential of consumer paper bags for rice and to identify entry strategies for the company. It was found that the market potential for paper bags for rice is about 27 million bags per annum at present; there is an interested segment whose requirement is 27 million bags. The recommendation is that PPL Feedback should price paper bags lower than polybags.
This abstract provides more details of the report’s contents than the descriptive abstract.
Executive Summary
An executive summary covers all the major elements of a report’s content:
- Background of the problem
- Major topics
- Important details
- Main conclusions
- Recommendations
- Discussion of how implementation of the recommendations would affect the company.
An executive summary of the PPL report is shown in Exhibit 10.10.
Stiff environmental regulations have brought up new concerns in packaging. These concerns include hygiene, safety, disposability, and recyclability in a developed world. Paper, being ecofriendly and having a premium image, has replaced other packaging materials such as tin, plastics, and so on for packaging goods for export.
The export market is highly volatile and so is the demand for packaging material. Last year, that is, in 2009, exports were low in the first half of the year as compared to the second half. Also, in segments like carbon black where paper packaging is used, the demand is almost saturated.
Considering these factors, the company (PPL Feedback and Packaging Ltd) is exploring new ways to expand business from industrial bags to consumer bags to meet its growth targets. The more lucrative segments are shopping bags and consumer bags for rice, for which there is a steady demand.
The aim of this research was to study the market potential of shopping bags and consumer paper bags for rice to identify entry strategies for the company. To calculate the market potential, the consumer sample survey method, explained in Chapter IV, was adopted. Chapters I and II provide details about the existing business of the company. Chapter III provides details about the significance of the study for the company, the research objectives, the scope of the study, and data sources. Chapter V explains the design and methodology of the study. To estimate the market potential, the questionnaire approach was followed and the respondents were interviewed personally for relevant details about paper bags. Chapter VI provides details of the results and conclusions reached by the study. The market potential for paper bags for rice is about 27 million bags per annum at present. There is an interested segment whose requirement is also for 27 million bags. The main factor working against the popularity of paper bags is their price in comparison to polybags. However, PPL can supply bags at a lower cost as it has an existent idle capacity to manufacture bags and its machines are fully depreciated. The consumer paper shopping bags market has a potential of about 32.4 million bags per annum at present. If the company invests in mechanized operations at this stage, then the operations may not be profitable for the company in the short run as per the break-even capacity utilization for the machine (discussed on page 35). The operations, however, may be viable in the long run.
This study was for the corporate retail segment only; there is another segment of individuals and retail showrooms who also use paper bags. At the time of market testing for corporate retail segments, the company could also study this segment under the set conditions of product mix explained in Chapter VI, to calculate the size of the market for retail showrooms. At the time of test marketing, which is essential for entry-strategy finalization, the company should test the various possibilities identified in the marketing mix and specifications for the final product launch, which are explained in Chapter VI.
Introduction
The introduction of this executive summary states the details of the:
Authorizing person or body requesting the report
Author or group of authors responsible for investigation (and submission of the report)
Purpose or reason for the report
Methods of enquiry (the research method used)
Arrangement or grouping of data
General background of the report’s subject
Findings
The findings present the results of the investigation.
Conclusions
The conclusions of the executive summary:
States the results of the investigation
Offers answers to questions raised in the beginning of the report.
Contains no new information
Recommendations
The recommendations of the executive summary:
Are the action centre of the report
State how the conclusions should be acted upon.
Make clear and definite suggestions/proposals.
Mention the need for further investigation as a condition for a more comprehensive study of the problem if required.
It is not possible to have a report without recommendations, even if recommendations were not specifically requested when the report was assigned. Recommendations flow from conclusions, as conclusions flow from the discussion.
Discussion and Analysis of Findings
This is the main body of the report. It discusses findings and analyses results. The information is developed in one of the ways discussed here.
Recommendations flow from conclusions, as conclusions flow from the discussion.
Chronological Development
The information can be arranged in the order in which the events happened. This is the simplest method of presenting information—as a story with a beginning, middle, and end. Chronological development requires relatively little planning and organizing. The writer selects and arranges the major topics in the order of their occurrence. Non-significant events are left out.
This method is usually used for writing short reports, progress reports describing the status of a project, and investigative reports that discuss investigations conducted over a long time and at different places.
Chronological development requires relatively little planning and organizing.
By discussing each event step by step, the cumulative effect of a variable (factor/thing) can be seen through the conclusions drawn at suitable intervals. The organization of information is easy to determine, as the report writer is guided by the order in which events actually took place.
Subject-wise Development
The information can also be arranged according to the subjects or topics discussed within the report. The subjects are grouped in a predetermined order. This arrangement makes the presentation of information coherent and logical.
When a report involves the study of two or more variables acting upon something, the writer has to arrange the discussion by subject. The writer could describe the effect of one variable on the subject and then proceed in chronological order to determine the cumulative effect of the variable on the subject. Then, in a similar manner he or she would study and describe the effects of the other variable, and record chronologically its cumulative effect.
The question that then concerns the writer is regarding the sequence in which each variable should be discussed if there are several variables of equal importance. The writer has to choose the sequence according to the variable he or she wants to recommend or emphasize. The report can move in increasing order of suitability or move from the most suitable to the least suitable. Before structuring the information, the writer should make the order clearly known by stating whether ascending or descending order is being followed.
Suppose an automobile dealer wants to recommend the most suitable model of luxury car to an executive. He or she will follow the descending order. After evaluating the price, fuel consumption, speed, automation, seating capacity, space, and after-sales guarantees for different models of luxury cars, the dealer would then recommend the model most suitable for the customer. In this case, the dealer has, in fact, made a comparative study of the essential parameters that determine a buyer’s choice of a car and presented the information accordingly.
Concept-wise Development
The information can be organized “concept-wise”. This means that the writer develops his or her argument and reasoning on the lines of his or her thoughts.
The logic of the argument guides the organization of the report. Each part or stage of the project is seen as part of a well-linked procession of ideas forming a complete concept.
A report writer can arrange the report by following the logical sequence of the investigation. The writer can develop the topic by describing each step in sequence with the step that follows it, in a series of steps that builds up his or her argument. The logic of the argument guides the organization of the report. Each part or stage of the project is seen as part of a well-linked procession of ideas forming a complete concept.
In the concept-wise method, the writer tells the reader how he or she arrived at the results and why they are valid. This method should be employed when the topic is complex and reasoning and careful consideration are required to explain the various concepts used in reaching the conclusion. When the best result can be selected by a simple and direct analysis, for instance the choice of a car or a site for a new house, subject-wise development would be more appropriate than concept-wise development. Whatever the method of developing the main argument, the report should be logically organized and the narration interesting and convincing.
Glossary
The glossary is the list of technical or special terms used in a report or technical paper and is placed at the end of a report, before the index. It alphabetically lists words or phrases that need special attention. It explains the usage of technical terms peculiar to the industry. A glossary of usage includes rules for forming compound words, abbreviating technical terms, and writing unusual or difficult words. A glossary also acts as a dictionary for some select words that are often confused, misused, or wrongly spelled. These are:
A glossary of usage includes rules for forming compound words, abbreviating technical terms, and writing unusual or difficult words.
- Words that are often confused because they are similar in meaning or spelling; examples are diplex and duplex, ground floor and first floor, postpone and cancel, or imply and infer.
- Common errors of usage such as many a times (should be many a time), one of the best option (in place of one of the best options), comprised of (for comprises).
- Words that tend to be wrongly spelled; examples are agism (correct spelling is ageism), accomodation (instead of accommodation), seprate (should be separate).
- Words having more than one acceptable spelling, such as program and programme. In case of words like symposiums and symposia where both versions are in use, both are given in the glossary and a choice is indicated for one of them.
- Words like data, which is often wrongly used as singular or as datas for the plural, are specially entered in the glossary and their usage is fully explained. Data is plural (but is also treated as singular, although the singular form is datum). In scientific, philosophical, and general use, data generally means a number of items and is thus regarded as plural, with datum as the singular. But in computing and related subjects, it is taken to denote a mass or collective noun and is therefore used with words like this, that, and much and with singular verbs (for example, “useful data has been gathered”). The glossary, like the Oxford English Dictionary, will draw our attention to the meaning as well as usage of the word data and point out that although some people consider the use of data with a singular verb incorrect, it is now in common use. It will also point out that data is not a singular countable noun and should not be preceded by words such as a, every, each, either, or neither or be given the plural form datas.
In scientific, philosophical, and general use, data generally means a number of items and is thus regarded as plural, with datum as the singular.
Appendix
The appendix is used to give a variety of information separately when its inclusion in the main body could interfere with the smooth reading of the report. It usually includes the text of questionnaires or other instruments of survey. Tables, flow charts, maps, summaries of raw data, and details of mathematical formulation are generally included in the appendix. Each appendix is numerically or alphabetically labelled to help the reader identify the material. Sometimes a descriptive title is given. The word “annexure” is sometimes used for the appendix.
The appendix may also include the distribution list. When a report is sent to several persons, it will contain a list of all the persons who receive a copy. The distribution list is placed according to its size or the customer’s or company’s practice. However, it seems proper to place it as a separate appendix if the list happens to be long. A short distribution list can appear at the foot of the table of contents.
Bibliography and References
All published and unpublished sources of information used in preparing the report are listed in the bibliography. All reference documents, previous reports, books, periodicals, and even letters written and received by the writer are mentioned in it. In using written material from secondary sources, report writers must always mention the source of the information by citing it as a footnote or endnote. Failing to document sources amounts to plagiarism.
Rules for bibliographies vary. In a report, the bibliography should conform to the style of documentation followed by the concerned company, just as a technical article or paper conforms to the form followed by the journal or society that is publishing the material. Though each organization usually has its own standard format of documenting sources, the general system followed is either that of the Modern Language Association (MLA) or the American Psychological Association (APA).
Documentation of cross-references should be done in a way that does not disturb the flow of the argument. The writer can provide references in footnotes at the end of each relevant page or can describe all references together in endnotes, which is the list of all references at the end of the report. In both cases, the reader can find all the details about sources mentioned in the report and can check the accuracy of facts by consulting the original sources. Endnotes are usually preferred as they are easy to refer to when desired. Also, footnotes create the problem of spacing the material on the page.
It is to be noted that each reference to be cited in the endnotes is numbered consecutively as 1, 2, 3, and so on. Each reference should have the same number when mentioned in the body of the discussion. The various styles for documenting the sources are discussed in greater detail in Appendix 1.
Index
An index (plural indexes or indices) is an alphabetical list of subjects, names, and so on, with references to page numbers where they occur in the report or book. It is usually placed at the end. It should not be confused with the table of contents, which always appears at the beginning of the report or book.
In long reports and voluminous works, an index helps the reader locate a subject easily wherever it has been mentioned or discussed in the text. For example, “Order refusals 115” entered in a report’s index means one can find order refusals mentioned on page 115. In a book’s index, the entry “Research questions 34 a — 675” means that the topic of research questions is discussed on page 675 under section 34 a.
Normally an author’s note about the symbols used in indexing subjects appears at the beginning of index entries, which helps the reader follow the way entries are made. For more information, see Lynn Quitman Troyka’s note on indexing in the Handbook of Writers.2
USING DIAGRAMS AND VISUAL AIDS IN REPORTS
Report writers use tables and graphics such as bar charts, line charts, and pictograms to explain ideas briefly and vividly. Diagrams, like all visual aids, communicate information clearly and effectively. For example, written instructions supported by illustrations to show how an eye-drop should be opened and applied would be far more effective than plain instructions in words alone.
Diagrams, like all visual aids, communicate information clearly and effectively.
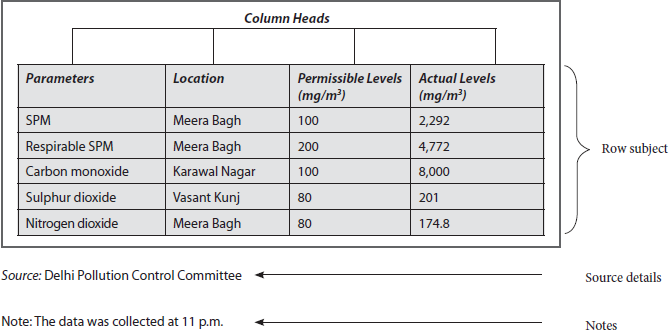
Use of Tables
A table presents numerical or topical data in rows and columns. A report writer should know some of the techniques of preparing tables for clear presentation of content. The most important technique is to label each table in a manner that allows the reader to locate the desired table easily. Some tips are given here:
- Numbering all tables: The writer should number all the tables in the report consecutively by calling them “Table 1”, “Table 2”, “Table 3”, and so on. When referring to them, one can simply say, “as shown in Table 1,…” or “… in the following table”. This makes cross-references simple and clear. The table number should be written at the top of the table.
- Labelling each table: There should be a complete heading or title for each table that clearly describes the contents of the table for the reader. As headings, the table titles can be long as long as they completely describe the table’s contents. The title can even run into two lines. It may mention sources of data, numbers included in the figures in the table, and the subject of the table. An example is: “Segmentation of market (5–20 kg) based on the usage of bags in the total market of 3,150 million”. For emphasis, the title of the table can be written in bold letters.
- Column heads and sub-heads: Column heads and sub-heads should be used to classify information when several columns are given. For example, if the column head is “Cities” and the column lists several cities, they may be segregated by sub-heads that classify the cities under various zones, such as “North”, “South”, and so on.
- Rows: Similarly, the subject of each row should be indicated by identifying its contents. For example, in a column that lists various sectors of the economy, the subject of the row should be identified as “Economic Sector”.
- Footnotes: Footnotes are used to explain or qualify specific entries, if required.
- There should be sufficient space between columns so that the data remain well separated.
Exhibit 10.11 is an example of a table with various parts labeled; it illustrates the layout, title placement, and headings for the vertical columns and horizontal rows effectively. Notice that if the table is taken exactly from some other source, the source must be mentioned.
Use of Graphics in Reports
In reports, the following forms of graphics are commonly used:
- Bar charts
- Line charts
- Pie charts
- Pictograms
- Actual pictures
- Maps
6
Understand the role and use of graphics in reports.
These graphics are also used in oral presentations of reports. The writer or presenter of the report considers how the use of graphics helps in grasping the information conveyed through words. Sometimes, reports use graphics as a source of embellishment that makes the presentation colourful.
Bar Charts
A bar chart can be simple or complex. A simple bar chart is used to compare quantities that can be depicted on a scale. A bar chart can be broken up when the quantities are too large to be covered by the chart. In such a case, the chart is broken up to show that some quantities are not shown in the diagram.
A simple bar chart is most effective for comparing quantitative data. The layout for vertical bars is shown in Exhibit 10.12. The lengths of the bars, whether they are horizontal or vertical, show quantity. The quantitative scale should always begin at zero. The graduation space must be equal. Also, the width of the bars should be equal. Different colours, shadings, variations, and cross-hatchings are usually used to bring out differences in bars.

Segmented Bar Charts (Component Bar Charts)
Sometimes bar charts represent more than one item. They include several components, which are depicted by segmenting the bars into different parts shown in different colours or cross-hatchings. The labels to identify different parts can be given separately in the legend if there is inadequate space along the bars. The segmented bar chart is also known as the component bar chart or subdivided bar chart. For example, consider the segmented bar chart in Exhibit 10.13, which presents the creation of thousands of jobs in the Indian IT sector since 2000; the fastest growth is in call-centres, not software.

When negative quantities also are included in the data, zero can be placed at the midpoint on the scale and not at the beginning. By doing so, one can present both positive and negative bars.
Line Charts
Line charts are useful for showing changes in quantitative data spread over some time. Line charts also help in projecting trends (Exhibit 10.14).
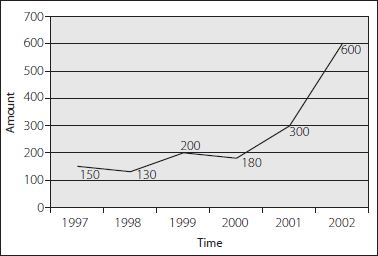
Some guidelines for constructing line charts are:
- Use the vertical axis to represent amount and the horizontal axis for time.
- Begin the vertical axis at zero and divide the scale according to the size of the amount to be shown on it.
- Make both vertical and horizontal gradations equal. That is, all spaces on the amount (vertical) axis should be the same, and all time scales should be the same. But it is not necessary that the time space and amount divisions be equal.
- Use proper proportions in the sizes of the vertical and horizontal measures so that the lines drawn are marked by natural slopes (see the line chart in Exhibit 10.14).
Pie Charts
A pie chart presents a whole that is divided into various parts. The pie represents the whole, and its segments represent parts of the whole. A pie chart is used to show the relationship among parts only when there are more than two parts forming the whole. If only two parts are to be described, their relationship can be simply stated in the report. A pie chart should have three or more segments. The pie is cut clockwise, beginning with the largest part on the right side, with other parts following (clockwise). It is not necessary to cut the parts in descending order of size. The size of the pie chart should be large enough for its segments to have labels and unit values clearly written on them. Different colours are often used to emphasize and contrast the relationships among the parts. Exhibit 10.15 represents the popularities of two candidates for the position of prime minister.
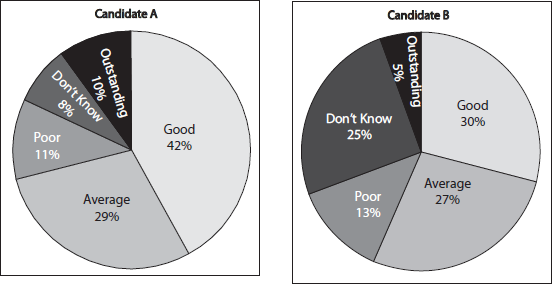
A pie chart presents a whole that is divided into various parts.
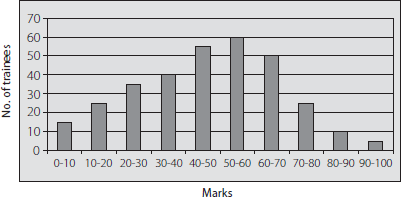
Histograms
A histogram is a graph of frequency distribution. A histogram consists of a series of rectangles, each of which is proportional in width to the range of values within a class and proportional in height to the number of items covered by the class, that is, the frequency. If the class size is the same, then each rectangle will be of the same width.
A histogram is a graph of frequency distribution.
When drawing a histogram, the variable is always shown on the x-axis and the frequency is determined on the y-axis. A histogram consists of a series of adjacent rectangles, each having a class-interval distance as its width and the frequency distance as its height. The area of the histogram represents the total frequency distribution across the classes.
It is important to understand that a histogram is not just a bar diagram. In a bar diagram, only the length of the bar matters, not its width. But in a histogram both the length and the width are important. The histogram in Exhibit 10.16(b) shows the marks distribution of 320 students.
Exhibit 10.16 (a) The Data for the Histogram
| Marks | Students |
|---|---|
0–10 |
15 |
10–20 |
25 |
20–30 |
35 |
30–40 |
40 |
40–50 |
55 |
50–60 |
60 |
60–70 |
50 |
70–80 |
25 |
80–90 |
10 |
90–100 |
5 |
Pictograms
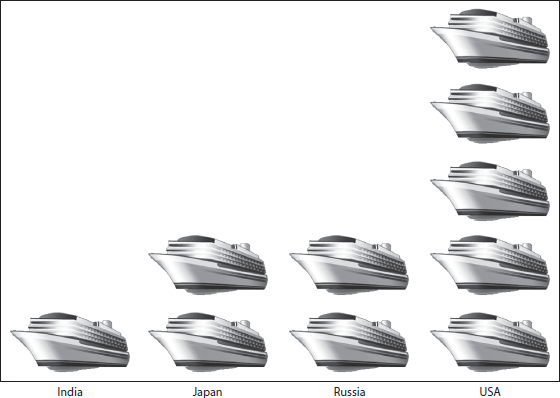
Pictograms illustrate numerical relationships by using pictures to represent quantities. In a pictogram, figures of the same size should be used to represent amounts and relationships clearly. For example, assume that the merchant tonnage of four different countries, say the United States, Russia, Japan, and India, needs to be pictorially represented. A picture of a ship can be used to symbolize merchant tonnage, with the value of say 1,000,000 tons assigned to each ship. Accordingly, this will depict the differences in tonnage using different numbers of ships in relation to different countries. For example, if the merchant tonnage of the United States is four times greater than that of India’s, one can illustrate the numerical relationship between India’s and the United States’ tonnage by vertically placing four ships for the United States and one ship for India. Similarly, suppose Japan’s and Russia’s amounts are double India’s, then one would use two ships each for both countries, and one ship for India. The increased amount is not shown by changing the height and width of the ship in the picture, as this would be misleading. The pictures are placed along the y-axis and the names of the countries are on the x-axis (Exhibit 10.17).
How to Use Figures and Diagrams in Reports
Figures and diagrams can be used in the text of the report if they are not very large. If they can be accommodated on a page within the running text without breaking the continuity of the text, they should be kept as part of the text. Otherwise, tables, charts, and other diagrammatic representations should be placed in an appendix. Each figure should be serially numbered throughout the report. First the data should be introduced, then the diagram should be explained, and finally, the reader’s attention should be drawn to the diagram itself by specifying the figure number and the appendix number if needed.
- The report is a distinct form of written communication involving investigation, analysis, and presentation to give its receiver the required information. There are various methods of enquiry, data collection, and analysis of information that the report writer should make use of.
- The terms of reference guide the report writer. They delineate the problem, purpose, scope, limitations, budget, cultural considerations, and deadline for the report when it is authorized.
- Planning and organizing information by outlining before writing helps in writing a clear and logically arranged report.
- A report writer should know the essential elements of reports and their normal or alternative sequences in different types of reports (short informal reports and long formal reports).
- There are several types of visual aids that a report writer can use; examples include tables, bar charts, pie charts, pictograms, and histograms.
Objective
This project aimed at studying the interest of students in studying abroad. This primary survey was conducted for 200 respondents of different age groups and backgrounds. The survey involved some multiple-choice and open-ended questions, which were carefully interpreted and analysed. The personal and contact details of the students surveyed have also been maintained in a database for future reference. More specifically, the project had the following objectives:
- To understand what potential candidates look for when applying to a university abroad.
- To understand their country preferences.
- To find the range of expenses they are prepared to pay for studying abroad.
Data Collection
The data have been collected through both primary and secondary sources. Primary data have been obtained through a self-administered questionnaire. The questionnaire takes into account all the relevant variables required for research so that meaningful analysis could be computed at the end of the survey. Secondary sources of data, like the Internet and various books, were used for exploratory studies.
Results of the Primary Survey
- According to our survey, 47% of students think that studying abroad is a better option than studying in India.
- Results also revealed that the majority of the students would prefer to go to the United States—46 students chose the United States, 40 students preferred the United Kingdom, 30 students preferred Australia, and 4 students chose France.
- There were very few students willing to spend INR 10,00,000 to 12,00,000 each year to study abroad. Most of them were comfortable spending around INR 5,00,000 a year.
- From this survey, it seems a lot more would need to be done in terms of marketing and promotion for HRC Business School, France, as there was a lack of awareness among students.
Results of the Secondary Survey
- According to the secondary survey, 1,53,000 students go abroad every year from India—the second largest group of international students in the world after China.
- In 2007, 970 students went to France to study; in 2008, the number increased to 1,757.
- The French government provides specific scholarships for Indian students, like the Eiffel scholarships sponsored by the French Ministry of Foreign Affairs. There are also scholarships co-financed by French companies or institutions. These scholarships are attracting many Indian students.
- Indian students are highly cognizant of the fact that they need to learn French and studying in France gives students the opportunity to learn the language and add to their overall professional profile.
Challenges Ahead
Marketing and promotion barriers:
- Awareness of French universities is very low among Indian students, so very few students want to go to France for higher studies.
- Increasing awareness of HRC Business School is also a major challenge; only 4% of students were aware of HRC Business School in our survey.
Expense barriers:
- Indian students perceive that doing one-year, full-time MBA abroad would cost more than doing it from India.
- Indian students perceive that France is a more expensive place to live in.
Solutions
- Increasing awareness of HRC Business School among students.
- Promoting French education as world-class education.
- Taking part in various education fares for increased visibility.
- Forging good relations with our strategic partners for wider reach.
- Making strategic relationships with some financial institutions for loan facilities.
Questions to Answer
- Give a very brief overview of this report.
- Mention the reasons for taking up the survey.
- Sum up the conclusions you draw from the report and give your recommendations.
- Does the report contain all the necessary parts that help a reader understand it easily? Suggest the missing parts, if any.
- Mention the points you would need to know if someone asked you to write a report and not an essay.
- State the purpose and place (sequence) of the following elements in a report:
- Summary
- Introduction
- Appendices
- Table of contents
- Recommendations
- What part(s) of a report are most important to a business executive?
- List the basic parts of a short formal management report in their preferred sequence.
- Discuss the points covered by the introduction of a report.
- Discuss the significance of graphics and diagrammatic representations in a report. Illustrate your answer with some examples.
- Identify the elements of a long formal report.
- Discuss the importance of planning and outlining in writing a formal report.
- Define and discuss a report as a specially assigned task.
- What is the difference between formal and informal reports?
- Discuss the chief characteristics of a good business report.
- Describe the difference between direct and indirect organization of a report.
- Bring out the difference between “conclusions” and “recommendations” in a report.
- If the basis of a report is a problem, what should be the first step necessary before moving further into the writing process?
- Prepare a title page of a report to be written by you as a management graduate at BITS Pilani on “Communication Needs of Business Management Executives”. The assignment is to be submitted to the Dean, Instructions Division, BITS Pilani.
- Write a formal report as a marketing manager to your company’s vice-president of marketing on the reasons you have investigated for the sudden fall in demand for your product. You can create the details on the company, product, and location.
From the given options, please choose the most appropriate answer.*
- Reports present conclusions based on:
- investigation
- intuition
- impression
- belief
- The terms of reference for producing a specific report are given by the:
- writer
- reader
- organization
- expert
- The index forms a part of the:
- front matter
- main body
- end matter
- glossary
- How many basic parts of a formal report are there?
- Five
- Four
- Six
- Three
- Which of the following is not a subsidiary part of a formal report?
- Table of contents
- Appendix
- Glossary
- References
- A cover letter is normally written by the:
- report writer
- top management
- CEO
- reader
- The chronological development of information in the body of the report is done according to the:
- choice of the writer
- logical sequence of events
- collection of data
- order in which events occurred
- The glossary is the list of:
- subjects covered in the report
- diagrams used in the report
- technical terms used in the report
- references
- Business research gives information to guide:
- scholars
- stockholders
- brokers
- business decisions
- A report can present the information in:
- four ways
- two ways
- five ways
- three ways