Asset Liability Management in Major Banks
Asif Ahmed
Citigroup
Those who triumph compute at their headquarters a great number of factors prior to a challenge. Little computation brings defeat. How much more so with no computation at all!
—Sun Tzu, c.490 BC, Chinese military strategist
Introduction
Basel II has been a catalyst for many banks to revisit their market and credit risk management. Flattening yield curves and consolidation in the banking market has meant that the treasury functions within a bank are often asked to help with the formulation of strategy. Risk budgeting based on return on economic capital has become a key platform for capital allocation decisions.
This chapter will describe some of the ways the treasury assists in this strategy-setting process. Two case studies are used to illustrate the concepts. The remainder of the chapter will focus on some of the challenges banks face in implementing this approach in a uniform and consistent manner.
The chapter deliberately avoids elaborating on liquidity, interest rate, and credit risk management. It is assumed that the reader is already familiar with the relevant terminologies (such as gap analysis, sensitivity testing using simulations, transfer pricing, and economic capital) and the underlying complexity involved in managing in a dynamic environment.
Asset Liability Management Dynamics
Charting alternative futures lies at the heart of strategic planning. Understanding the interaction between interest rate, prepayment, liquidity, and credit is similar to understanding the interaction between the current, wind speed and any submerged obstacles in navigating a ship. Net interest income (NII) and market value of equity (MVE) are key elements to judge the robustness of any planned route. A focus on MVE ensures that the short-term accounting returns, captured by NII, are not emphasized at the expense of longer-term economic sense. Any scenario charted, therefore, must be seen in light of these two metrics. Other measures such as return on assets, return on risk-adjusted assets, return on economic capital and return on equity can be seen as variants of these two measures.
This chapter starts by looking at how a balance sheet generates the income and expense statement.
Proper coordination of the aforementioned in the asset liability management (ALM) process can be simplified through six policy objectives:
- Spread management: this involves both the yield curve gap as well as the margin.1 In a dynamic environment the spread from any given product is dependent on the business cycle, which in turn is correlated to interest rates. The same applies to prepayment speed.
- Loan quality: this is a function of interest rate levels, existing bad loan assessment processes and default experience per product.
- Fee income and service charge: this invariably is a function of the products that can be reliably managed by the existing infrastructure of the bank, including personnel. The underlying risks of the products will range from interest rates, credit, foreign exchange, equity, and commodities.
- Control of noninterest operating expenses: for instance, additional customer service cost required to increase or maintain the core depositor base.
- Tax management.
- Capital adequacy: this is where the indirect impact of interest and credit management becomes evident.
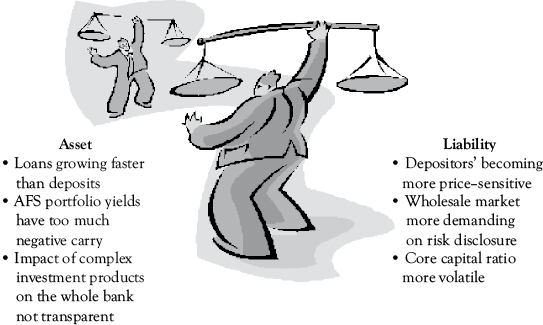
Exhibit 5.1 The business of managing the balance sheet is a tough balancing act
Source: Author’s own.
In a dynamic analysis, changing any one or a combination of these internal or external variables will have an impact on the NII and MVE. The role of the ALM is to allow management to present the options in an intuitive and quantifiable form.
Implementing a Robust ALM Framework
Risk needs to be captured consistently across all the risk factors and reported uniformly across all the business lines (see Exhibit 5.3). Monte Carlo simulation offers a flexible and intuitive methodology to achieve this objective. Joint simulations of all the risk factors allow us to control the inputs, stress test the assumptions, incorporate jump-like behavior (fat tails) and combine management expectations of business growth and spread trends (see Exhibit 5.4). The transparency and flexibility this offers also helps to check the model’s robustness.2

Exhibit 5.2 The ALM dynamics
Source:Author’s own.

Exhibit 5.3 Different facets of risk
Source: Author’s own.

Exhibit 5.4 Model risk consistently
Case Study: Regional Bank with Falling NII
This is a case study of a medium-sized regional bank focused on its core activity of lending to local clientele. In the last two years, it has faced falling NII due to:
- Rising cost of retaining the core deposit base.
- Rising default rate in a cooling housing market.
- Legacy of fixed-rate mortgages that had not been swapped to floating. In a flat/inverted yield curve environment, this had added to the spread compression.
- A portfolio of trading securities invested mainly in medium-term, fixed-rate government bonds. Again, in a flat/inverted yield curve situation, this negative carry had played a major part in compressing the NII.
Although the positive gap position had been considerably reduced in the quarter since results were published, the core problem of falling NII remained. Citigroup performed a top-level ALM analysis to first quantify the magnitude of the issues and then elaborate a given number of practical solutions for the bank’s Asset and Liability Committee (ALCO) to consider.
The following charts (see Exhibits 5.5 and 5.6), which has been rebased to disguise the identity of the bank, shows the top-level diagnostics, their implication and the impact of the solutions pursued. A standard definition of economic capital is used, being expected MVE in one year’s time less 2.5 percent tail-end MVE.

Exhibit 5.5 Best case, mean, worst case MVE

Exhibit 5.6 Best case, mean, worst case NII
Source: Author’s own.
The risk cones of NII and MVE belie a given initial set of parameters—in this case, a base-case scenario of management projections, asset correlations and volatilities. We see that the MVE is really on a steady upward trend with only a 2.5 percent chance that in two years’ time the current structure could lead to any serious trouble. In practice, management focuses mainly on the MVE in one year’s time and that is seen to be pretty much the same as today. Thus, the rest of the investigation will focus on the causes of a flat/falling NII and ways to improve this situation.

Exhibit 5.7 Risk factor breakdown
Source: Author’s own.
More granular analysis of the underlying risks revealed that most of the risks were concentrated in consumer and commercial loans (see Exhibit 5.8). Investigation revealed that these two areas offered particularly lucrative margins and were also areas where existing mortgage customers wanted to utilize their unsecured lines. Although a fast way to grow the balance sheet, the bank had frequently lent 110 percent of the value of the underlying asset. While such practices can be averted in the future by modifying the products, in the short term these changes would not have had much impact on the NII.

Exhibit 5.8 Risk breakdown by business lines
The next step of the analysis is to combine the internal dynamics and market-related variables with management projections of what they expect spread to do going forward in their particular market. Exhibit 5.9 shows expected return on the Y axis and risk represented by 2.5 percent worst-case MVE on the X axis. The sizes of each of the respective businesses are represented by the diameter of the circles.

Exhibit 5.9 Risk return by business size—current
Source: Author’s own.
We can see that commercial construction loans yield the best risk-adjusted return, followed closely by commercial mortgages. Commercial unsecured loans form a big part of the business with the same return as that achieved in respect of secured loans, but with more risk.
Exhibit 5.10 overlays management expectation of spread as well as the business’s forecast of asset growth. The patterned colored circles are the projections, with the solid colors being the current situation.

Exhibit 5.10 Risk return by business size—projected
Source: Author’s own.

Exhibit 5.10a Risk return by business size—solution 1
Source: Author’s own.
We see that both commercial and consumer loans increase in risk for a small increase in return and construction and commercial mortgage fall in size and yield. Indeed, securities and mortgages are the only business lines to exceed their risk-adjusted returns.
The investigation following the analysis mentioned earlier revealed the following trends:
- The bank’s risks are highly correlated with the local economy. As of August 2006, the economy is experiencing reduced growth and this is evident in the increase in risk in both types of unsecured loans. Due to technical inertia, however, (e.g., lines have already been given for a year), it was not possible for the bank to reduce the size of its exposure to these two core sectors.
- The most lucrative businesses in the portfolio, construction and commercial mortgage, are even more cyclical than loans. As such, both of these may experience a downturn. Furthermore, there is a natural constraint in how much business can be done locally in these two niche sectors. Nevertheless, management may consider investing more in building relationships in this niche for future growth.
- Securities and residential mortgages both experience greater risk-adjusted return for virtually the same size. Management may consider investing more in these for the next year.
Solution 1
The initial analysis suggests that the bank should try to find an investment that is less correlated to the existing asset portfolio. Citigroup suggested a combination of hybrid assets and structured credits based on a collateral pool of foreign banks. Correlation analysis showed that the hybrid asset solution was the more effective route.
The initial parameters for this scenario were then changed to reflect an LCU2bn reduction in the securities portfolio, which was substituted with the Citigroup Hybrid Index. The impact of the hybrid solution can be seen in the two MVE distributions—the worst case has improved as well as the portfolio return by year three (see Exhibit 5.11).
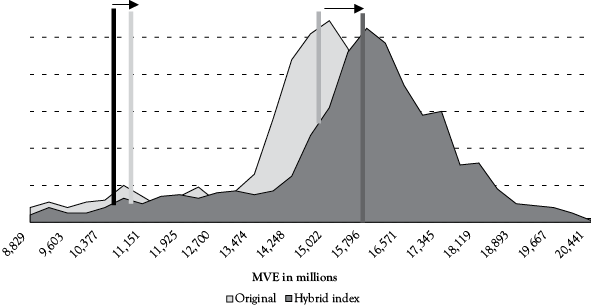
Exhibit 5.11 Benefit from diversifying assets
Source: Author’s own.
.jpg)
Exhibit 5.12 Best case, mean, worst case MVE
Source: Author’s own.

Exhibit 5.13 Loss distribution function—stress scenario
Source: Author’s own

Exhibit 5.14 Loss distribution function—normal scenario
Source: Author’s own.
On the risk-return graph, this has the net impact of increasing return on a risk-adjusted basis. The improved risk-adjusted return is also apparent in the MVE cone, which shows a higher trend for slightly reduced risk.
Solution 2
Credit risk is one of the key components of overall economic risk capital. Of this, commercial loans form a major part. Management expects that in the coming year the losses from this book will increase.
The following chart shows the loss distribution function in a normal scenario and in an increased loss stress-case scenario for the commercial loans book.
More granular analysis identified a subset of names that were contributing to the excess default events or fat tail (see Exhibit 5.15). These were ranked by their impact on economic capital losses. Citigroup’s correlation desk was able to sell protection on most of these names, thereby reducing the overall default exposure of the commercial loans book.

Exhibit 5.15 Loss concentration by names
Source: Author’s own.
Implementation Issues
The difficulty for most banks lies in the legacy systems they have inherited. Credit risk assessments are often performed on a name-by-name basis using fundamental analysis with risk limits set per sector/region. Portfolio analysis in this case is not the norm. Market risk, on the other hand, is performed at a bank level. Combining the two, often different, departments can prove to be a daunting task. Most off-the-shelf software packages are robust in one aspect (e.g., market risk) and weak in the other. Moreover, these packages are designed for reporting purposes and do not facilitate scenario-building—an essential component for strategy-setting. Add to this the shortage of qualified personnel to handle these types of projects and we soon see why most mid-sized banks have resorted to compromise solutions.
A survey of 42 US regional banks shows that most still concentrate on the sensitivity of their NII to parallel shifts of the yield curve. Compare this to UK banks where the FSA requires repricing gap analysis. These risk measures mainly capture the short-term risks. While this is a reasonable measure for a balance sheet that is relatively neutral or has a short duration gap, it can potentially hide structural imbalances embedded in the businesses, for example, any inherent options—whether financial or contractual.

Exhibit 5.16 Type of market risk analysis disclosed by US regional banks and UK banks
Source: Company Annual Reports.

Exhibit 5.17 Type of market risk analysis disclosed by mid-tier UK banks and building societies
Source: Author’s own.
Analyzing portfolio credit risk poses numerous practical constraints, the major one being reliable data. Default experiences per product lines and locality are not widely available. As such, internal estimations of worst-case losses and correlation to business cycles have to be incorporated into a bank-wide analytical framework.

Exhibit 5.18 Underlying asset classes correlation with CHI
Source: Author’s own.
Conclusion
The potential for using real-time RoEC is already being realized: banks have released capital by comparing their regulatory capital to economic capital; correctly priced loans have been made, where previously the line would have been declined; trends in growing businesses have been spotted earlier, enabling greater focus in those areas; and risk-return hurdle rates are guiding securities investment decisions. Asset liability management is encouraged throughout the bank as a core discipline underlying all capital allocation decisions of its managers. The bar is being raised across the industry to generate greater return for each unit of risk capital the bank has and a bank-wide ALM methodology is imperative for this goal.
1 The treasury is strictly not responsible for the margin particular business units make for a product. However, the process of transfer pricing ensures treasury involvement. The spread earned on a product must be incorporated in the RoEC calculation.
2 A common method of validating a model is to ensure robustness—that means the model must produce consistent results for a wide range of reasonable initial parameters. Initial parameters for our purposes will be correlations, volatilities and various management assumptions on spread trends.