CHAPTER 8
Company Analysis
________________
In Chapter 1 we discussed the characteristics of a good business. Good businesses operate in growing industries with relatively predictable pricing, hold a dominant and defensible position within that industry, and have a strong balance sheet, an astute management team, and a positive image in society. The characteristics of a good business can be further broken down into profitability, earnings sustainability, balance sheet strength, growth prospects, investment risks, and valuation. We now take a deeper look at each of these in detail.
Profitability
Profitability can vary significantly between distinct types of businesses. The amount of money needed to operate a business (its capital intensity), the required level of technical expertise, economies of scale in manufacturing or distribution, and brand recognition, product differentiation, and degree of competition in the industry all help determine a company's profitability. Differentiated products are those that have specific features that distinguish them from competing products and make them more desirable. The perception of scarcity or superiority typically allows businesses to earn higher profits on those goods. Often this is achieved through better functionality or quality, but differentiation can also be derived from brand name recognition. Luxury goods retailers are an excellent example of businesses that generate higher profits due to the perception of scarcity. Consumers who believe that these goods are of higher quality or that they are proof of one's success are often willing to pay higher prices for them. Businesses that produce goods that are not differentiated in some way and that face intense competition tend to generate lower profits. Businesses that offer common products that are easily substituted or replicated (often referred to as commoditized products) typically compensate for the lower profitability of each unit sold by selling large quantities of them.
There are exceptions to these rules, where some combination of the above factors results in high levels of profitability. For instance, industries that require low levels of capital investment but require advanced technological knowledge often produce remarkably high profit margins. Software developers, for example, tend to generate high profit margins due to a mix of lower capital requirements and unique product features that often deliver productivity gains for customers. While a competitor may not need significant financial capital to enter the software market, producing a software platform that is superior to others in the market requires advanced knowledge. Industries that are less competitive or whose products require advanced manufacturing ability also tend to generate higher levels of profitability.
Good businesses distinguish themselves through superior profitability. Profitability can be measured in several ways, but two of the most common measures are net income margin (also referred to here as profit margin) and return on equity (ROE). Net income margin is the company's final income (after all accounting adjustments) as a percentage of revenue. ROE is also based on a company's final (net) income but expressed as a percentage of shareholder equity. Unfortunately, these measures are heavily influenced by a company's capital structure (how much debt it has versus how much equity shareholders have accumulated in the firm), as well as by the accounting methods used by the company. Although simple to calculate, these measures may be misleading and prevent them from being truly representative of a company's profitability.
Alternative measures for assessing profitability include return on invested capital (ROIC) and EBITDA margin. ROIC is calculated by dividing net operating profit after tax by invested capital, while EBITDA margin is equal to earnings before interest, taxes, depreciation, and amortization (EBITDA) as a percentage of revenue. In certain respects, both ROIC and EBITDA margin may be cleaner measures of profitability because they are less susceptible to accounting manipulation. The general idea for ROIC is that if a company's rate of return on the capital it invests is higher than the cost of obtaining that capital (known as the weighted average cost of capital, or WACC), value is being created for shareholders. The difficulty in relying on these measures is that they ignore taxes and interest charges, which have an exceptionally large impact on profitability for most publicly traded businesses. A thorough analysis would also include intermediate measures of profitability, such as operating margins, as these can provide helpful insights into the company's financial and operational position.
It is important to remember that levels of profitability can differ significantly between industries. Businesses that require a lower level of assets (referred to as being asset-light), such as software companies, will often have higher profit margins than those requiring a higher level of assets, such as a utility company. For some industries, the standard measures of profitability may not be suitable. We noted earlier that when analyzing banks, for example, the most common indicator of profitability is net interest margin, which measures net interest received divided by the bank's interest-generating assets.
One way to overcome the shortfalls inherent in the measures of profitability just discussed is to conduct a DuPont analysis. DuPont analysis works by breaking down ROE into its five individual components, namely the tax burden, interest burden, EBIT margin, total asset turnover, and leverage as shown in the following formula:

Note that EBT means earnings before tax and EBIT means earnings before interest and tax. By breaking out these individual components of ROE, we can develop a better understanding of what is driving a company's profitability. Collectively, these ratios measure profitability while accounting for the company's operational efficiency and financial structure. It is also helpful to compare a company's profitability to the industry average or its closest competitors. All of the data needed to conduct a DuPont analysis can typically be found in the company's financial statements.
Finally, it is necessary to look at the trend in a company's profitability. Falling profit margins could be a sign that a company is being run inefficiently, experiencing cost pressures, or facing increased competition. A good example of this is the emergence of the internet and the impact it had on the printed newspaper industry. With consumers increasingly able to gather news from the internet, newspaper publishers faced a serious threat to their long-term viability. As print subscriber numbers began to fall, profitability across the industry declined. Figure 8.1 shows the declining trend in profitability and subsequent effect on share price for the New York Times Company.
The company's profitability, measured by ROIC, fell from a high of nearly 27% in December 2004 to a low of –20% in September 2007. Combined with the global financial crisis, this drop in profitability caused the company's share price to fall by 93.5%, plummeting from a high of $53 in mid-2002 until it finally bottomed in February 2009 at a price of $3.44. You will also notice that the share price began to drop before the company's profitability declined meaningfully, suggesting that investors were able to predict the reduction in the newspaper industry's near-term profitability and began selling the shares before it happened. Fortunately, the management team at the New York Times was able to transform the company over time, enabling it to compete effectively in the digital age, after which the share price fully recovered. You will also note that as the company recovered, profitability led the share price higher, suggesting that investors incorrectly believed that management could not reposition the company and restore profitability.

FIGURE 8.1 The New York Times Company
Data source: Bloomberg and Yahoo Finance, as of September 30, 2021.
Earnings Sustainability
Finding companies that can generate above-average levels of profitability in their industry is a good starting point, but you should also be confident that the company can continue to sustain an elevated level of earnings power into the future. An investor must have a thorough understanding of industry dynamics to estimate the future earnings growth of an industry and the companies that operate in it. This includes the likelihood of new technologies being developed and whether those advances are achieved by the business you own or by a competitor. New entrants can disrupt industries and make the competitive advantages of the current industry leaders obsolete. This is especially true where margins are abnormally high and barriers to entry comparatively low, as these industries will attract greater competition. Less competitive industries, where companies generate moderate but reliable earnings streams, may make a better long-term investment than companies in industries that produce high margins but are extremely competitive.
The trend in profit margins for a company can supply valuable insights into earnings sustainability. Reviewing the past few years of ROE, operating and EBITDA margins, for example, can show how strong the company's business is and may reveal problems as they emerge, allowing you to sell the stock early and avoid a significant loss. If margins are trending downward, it is particularly important to understand why. Increasing competition or other factors may be affecting the industry's profitability, or the company in question could be losing operational efficiency. If the share price already reflects this bad news, there may be an opportunity to invest if management has a plan to address the reduction in margins and improve profitability. The only way to gauge a company's earnings sustainability is through due diligence, including potentially speaking to management or the company's investor relations department to learn whether they are aware of the problem and how they plan to address it. If the management team is not aware of the issue or does not seem concerned, you should reevaluate your investment in the business.
Balance Sheet Strength
When investors say a company has a strong balance sheet, they are referring to the company's capital structure, specifically the amount of debt the company owes versus the amount of equity that has been accumulated by shareholders in the firm. The capital structure of a company can have a significant impact on earnings in different economic environments, and affect its share price at different stages of the market cycle. There can be certain tax advantages for companies to have some debt, and debt may be required periodically to fund and grow the business. However, relying on a high level of debt can spell trouble for companies during tough economic times because lenders begin to charge a higher interest rate to compensate for the increased level of risk. This can make it difficult for companies to refinance their debt, potentially causing them to default on their loan obligations. This risk is heightened in the event of a liquidity crisis.
A liquidity crisis occurs when the supply of money in the economy (liquidity) dries up and there is insufficient capital available to allow the financial system to operate effectively. If steps are not taken to provide adequate liquidity to the financial system, a liquidity crisis can quickly evolve into a credit crisis when banks and other lenders collectively stop lending money for fear of not being repaid. Liquidity crises developed in 2008 and again in the early days of the 2020 global pandemic. In the case of the 2020 pandemic, central banks were able to avert a credit crisis by pumping tremendous amounts of liquidity into the global financial system. In 2008 a slower response by central banks to the drop in liquidity gave way to a credit crisis where firms with higher levels of debt were not able to borrow money or refinance their debt and many of these businesses went bankrupt as a result. These factors led to the global financial crisis.
A commonly used measure for balance sheet health is the net debt-to-shareholder equity ratio. This is calculated by adding short-term debt plus long-term debt, subtracting liquid assets (such as cash and investments that can be sold quickly), and then dividing this number by shareholder equity. A strong balance sheet is characterized by low levels of debt compared to shareholder's equity. A quick review of a company's financial statements will reveal how much short-term and long-term debt the company holds, as well as cash and other short-term investments and shareholder equity. Comparing these figures to a company's peers is an effective way to quickly assess whether a company deserves closer analysis, and if so, the investor must delve further into the balance sheet and consider off-balance-sheet items. Off-balance-sheet items (OBSIs) include assets and liabilities attributed to the company but that are not shown on the balance sheet. Examples may include operating leases, certain accounts receivable, contingent liabilities, joint ventures, financial guarantees, or letters of credit.
Other useful measures include the interest coverage ratio, which compares the interest paid on debt by the company as a percentage of net income. The higher the interest coverage ratio, the better. The more debt a company has and the higher the rate of interest paid on that debt, the more problematic it becomes. Low net debt-to-equity and high interest coverage ratios are preferred, but they must be viewed in the context of the industry in which the company operates. Higher-growth firms in the technology sector, for example, will often have little or no debt, while providers of electric or water utilities may have substantial amounts of debt. Both types of businesses can be beneficial to investors at different points in the market cycle and may complement one another in a well-diversified portfolio.
Mature companies can often increase their after-tax return to shareholders by issuing debt and so there may be instances when it makes financial sense for a company to carry more debt on its balance sheet. As well, a company may wish to finance a strategic acquisition that improves its long-term profitability by issuing debt. Assessing a company's debt structure is best accomplished by comparing its balance sheet to those of other companies in the same industry and looking through notes to the financial statements in order to identify OBSIs. As an investor, you must decide whether these items should be included in the net debt-to-shareholder equity calculation.
Growth Prospects
Most businesses constantly strive to grow, whether through increased sales, profits, or both. Future expected growth is an important determinant of a company's current value. The most common approach to analyzing growth is to estimate the future cash flows of the company and then to discount (reduce) those cash flows to arrive at an estimate of the value for the shares in today's terms. The reason for discounting future cash flows is simple: $1.00 of earnings generated 10 years from now is worth less than $1.00 of earnings today. Inflation erodes the value of money since goods will cost more in the future, and there is an opportunity cost for delaying the receipt of earnings, because money received today could be invested and used to generate additional returns.
For some companies, expected earnings growth represents most of the value reflected in its current share price, even though that future growth is not guaranteed. In fact, of all the aspects of a business we need to assess as investors, the prospects for future earnings growth are the most difficult to accurately forecast. Many variables affect a company's ability to grow that are outside management's control. A factor that will affect a company's earnings power in the future may not even exist at the time an investment is made. For example, a company may launch an innovative new product that disrupts the industry, rapidly taking market share from competitors. This competitive advantage could last for decades, or it could be displaced by a competing product shortly thereafter. Regulations are another potential change that occurs outside of management's control. An industry that is very profitable could suddenly become less appealing if the government changed the rules in a way that reduces its after-tax profitability.
Investment Risk
Investment risk is an important consideration when making any investment decision. Most people view investment risk as the possibility of losing money. There are countless ways you can lose money on an investment, even if your logic for making the investment is sound. Investment risk can be broken down into two broad categories. The first relates to factors that fundamentally affect the operations of the business, while the second results from the behavior of the company's share price. If the stock market were efficient, a company's share price would always reflect the fundamentals of the business, trading at a price that equals the fair or intrinsic (true) value of the company. However, a company's share price frequently differs from its business fundamentals.
Fundamental business risk refers to events that may adversely impact the operations of the business, thereby lowering the long-term earnings power and value of the company. All businesses face risks to their fundamentals, and these vary significantly by industry and region. Anything affecting a company's balance sheet, growth prospects, sales, or profitability could be considered a risk to business fundamentals. Summarized in Figure 8.2 are important fundamental factors that are relevant to all companies that investors should monitor. In cases where a meaningful change occurs or the company's fundamentals are deteriorating, it is important for investors to understand what caused the change and how it may affect the company going forward.
For investors, risk is most often measured in terms of how much a company's stock price fluctuates (known as its standard deviation or volatility), or how much the share price changes compared to a relevant index or benchmark (referred to as the stock's beta). For example, a stock with a beta of 1.2 means that for every 1% change in the index (up or down), the stock would likely move 1.2% in the same direction. Stocks with a beta of 1.0 generally move in line with the index, while stocks with a beta below 1.0 move less and are therefore considered to be defensive in nature. Examples of stocks with (typically) low betas are the shares of utilities or companies that produce consumer goods, like soap and toothpaste. Stocks with high betas tend to be higher-growth companies such as technology companies, as well as those whose businesses are more cyclical in nature, like energy and mining companies. There are times in the business cycle when owning high-beta companies is beneficial, and times when owning them can cause large losses. I refer to stock beta and standard deviation collectively hereafter as share price volatility.

FIGURE 8.2 Potential Signs of Weakening Business Fundamentals
Another consideration is how the share prices of the businesses you own move in relation to one another. This is known as correlation. Stocks whose prices move in a similar manner are said to be positively correlated, while those that move in the opposite direction are said to be negatively correlated. When two or more share prices move in a purely random fashion relative to one another, they are said to be uncorrelated. Owning several companies that are positively correlated (their share prices tend to move together in the same direction) does not provide the same diversification benefits as investing in several companies that operate in different industries and that do not move in tandem during market cycles. Correlation and the benefits of diversification are particularly important considerations when constructing an investment portfolio, as discussed in Chapter 20.
The importance of owning stocks that are uncorrelated or negatively correlated is illustrated in the example shown in Figure 8.3. Here, we compare owning a portfolio consisting only of banks and energy stocks to owning a broad stock market index. Figure 8.3 shows how one dollar invested equally in only energy and financial stocks would have performed compared to investing the same dollar in the S&P 500 Index.

FIGURE 8.3 S&P 500 Index versus Energy and Financials Only
Data sources: Yahoo Finance and Standard & Poor's Financial Services LLC, sourced via Bloomberg.
As you can see from the figure, there were periods (2000–2007 in particular) when holding the more concentrated portfolio consisting only of energy and financials would have been rewarding. However, over the full time period investors were better off holding the more diversified portfolio, which would have also included holdings in technology, healthcare, and industrials (among others) since it fluctuated less in value. Compared to the concentrated portfolio, share prices for the S&P 500 Index fell less in 2007–2009 and 2018, reflecting the fact that the S&P 500 Index consists partially of stocks whose share prices are uncorrelated. Keep in mind that for long-term investors, short-term fluctuations in share prices should be less concerning and in fact provide opportunities for patient investors to add to their holdings. Patience and the ability to withstand short-term price drops, buying when share prices fall and selling when share prices become expensive, are perhaps the most requisite skills for achieving long-term investment success. In addition to the investment risks outlined earlier, companies that operate globally are also subject to risks related to market cycles, currency fluctuations, and geopolitics, which we discussed in detail in Chapters 5, 6, and 7.
Valuation
How much you pay for a company, regardless of whether you are buying only a few shares or the entire business, is critical to a successful investment. Throughout history, investors are repeatedly fooled into thinking that price does not matter and that someone else will come along and pay more for their shares at an even higher price. History has proven repeatedly that this so-called “greater fool theory” is unsustainable in the long term. Betting that someone will eventually pay more for an asset you own, regardless of price, is one of the greatest mistakes an investor can make. Intrinsic value matters and in the end, prices will reflect economic reality and business fundamentals. Figure 8.4 shows that the price you pay for a business today will affect your future investment returns. This chart shows the 10-year future return for the S&P 500 Index for each quarter from 1954 through 2011 based on the price-to-earnings ratio of the Index.
The downward-sloping line shows the relationship between stock market valuation and forward 10-year returns. It demonstrates that the best investment returns are generated by buying companies when they are inexpensive. Paying too much for a business today may make it difficult or impossible to generate a reasonable return on your investment, even over many years. In fact, when valuations are expensive, there is a significant probability the next 10 years could result in a loss on your investment.
Valuation can be measured several ways. The most widely used metric is the price-to-earnings (P/E) ratio, which is appealing because of its simplicity. Unfortunately, this ratio uses as the denominator the company's reported earnings, which can be manipulated by unscrupulous management teams and may also be distorted by a firm's capital structure or accounting methods. Another, perhaps cleaner, measure of valuation is the price-to-sales (P/S) ratio. This ratio is easy to calculate like the P/E ratio, but it is less prone to manipulation because a company's sales or revenues are less subject to accounting manipulation. However, while it is usually more difficult for a company to manipulate its sales numbers, it is not impossible. Nevertheless, comparing the current price-to-sales ratio of a company's shares to historical values can be a useful exercise when assessing a company's valuation. Unfortunately, some companies may choose to grow revenue at the expense of profitability, for example, by cutting prices in order to gain market share from competitors. The P/S ratio therefore does not provide any insights into the quality of revenue growth. Investors should always understand why a company appears to be expensive or inexpensive before deciding to invest.
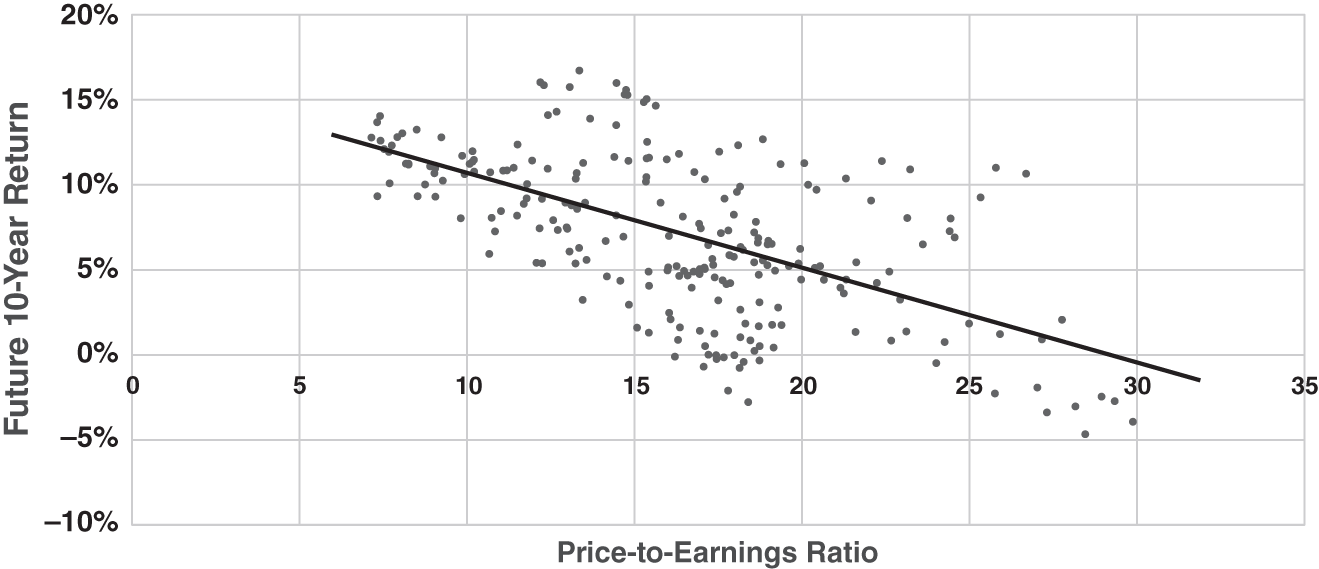
FIGURE 8.4 S&P Valuation versus Future 10-Year Return, 1954–2011
Data source: Standard & Poor's Financial Services LLC, sourced via Bloomberg, as of November 2021.
Enterprise value (which is equal to stock market capitalization plus total debt minus cash and equivalents) to EBITDA is another potentially useful measure of a company's valuation. This ratio approximates the total value of the company to how much cash flow it generates. It is therefore less subject to manipulation than the P/E ratio and, unlike the P/S ratio, considers the operational efficiency of the business. As with all valuation metrics, it helps to look at how current EV/EBITDA values compare to historical levels, the firm's competitors, and the broader stock market.
The price-to–cash flow (P/CF) ratio is another widely accepted measure of valuation. The benefits of using P/CF over P/E or P/S to value a company are similar to that of EV/EBITDA. The key difference between EV/EBITDA and P/CF is that P/CF considers interest payments, taxes, and investment income in its analysis. This is especially important when analyzing companies with different levels of debt or that require large amounts of fixed capital investment. High levels of debt result in higher interest expense, while higher fixed costs (plant and equipment) increase amortization expense. A variation of P/CF is price to free cash flow (P/FCF), which subtracts capital expenditures from cash flow to arrive at an estimate of the amount of cash available to pay dividends and repurchase shares. Free cash flow is therefore the cash flows available to shareholders of the company after all working capital and capital expenditure requirements have been met. The calculation of a company's price-to–cash flow ratio can be done by dividing its share price by its cash flow per share, which is generally found in the statement of cash flows from the company's most recent financial report. Where a per-share amount is not readily available, the investor must divide total cash flow by the number of shares outstanding to arrive at a per-share cash flow amount. These financial reports can generally be obtained from regulatory filings or the company's website. For these reasons, using P/CF or P/FCF for valuing companies is often preferable to P/E or P/S; however, assessing valuation using all of these ratios can provide helpful insights into the inner workings and health of the business.
Valuation should always be considered in the context of market conditions and company fundamentals. Dramatic changes in the P/E or P/CF ratios could be the result of a temporary drop or spike in earnings or cash flow. A sudden drop in earnings due to one-time events, for example, could cause the P/E ratio to increase significantly because the price of the security may not have changed, while the earnings have temporarily vanished. Looking at a specific point in time, especially at a single measure of valuation, may lead investors to an incorrect assessment of the company's valuation. For this reason, valuation should always be considered in relation to the stock's historical averages as well as the company's closest competitors and to the overall market. It also pays to read the Manager Discussion and Analysis (MD&A) section within the company's annual report as well as the notes to the financial statements. While some companies publish reports only annually, many companies publish quarterly reports as well, so it is best to obtain all reports issued by the company over the past few years.
Whether a stock trades below or above the market average (the average valuation for all publicly traded companies in their respective market) depends on a few key factors, shown in the following relative valuation matrix in Figure 8.5. The relative placement of a company for each factor should indicate whether its shares are likely to trade above or below the average valuation for the market.

FIGURE 8.5 Relative Valuation Matrix
Companies that operate in stable political and economic environments, are growing faster, generate above-average levels of profitability, have a history of producing consistent earnings, pay attractive dividends, and do not have excessive debt tend to trade at valuation multiples above that of the average stock in the market. Conversely, companies that are growing slower and operating in unstable environments, generate below-average profitability and unpredictable earnings, and have a high level of debt tend to trade at below-average valuations.
One challenge to thinking about valuation lies in the fact that when most investors buy shares in a company, it is for a relatively small amount of money, or at least a small ownership stake in the business. There is also a tendency to equate price with value, but in reality, a stock trading at a price of $5 could be vastly more expensive than a stock trading at a price of $200. Price does not equal value when it comes to equity investing. It also becomes easier to downplay the importance of valuation when only investing a few hundred or a few thousand dollars, and it is also a natural human tendency to want to own a larger number of shares, so getting 200 shares versus five shares for a $1,000 investment sounds more appealing. To avoid making these mistakes, evaluate every investment you make as if you were buying the entire business, regardless of share price.
A fitting example of the importance of valuation is former Canadian technology firm Nortel Networks. From the time it began trading as a public company in 1983 to the peak of the technology bubble in 2000, Nortel's share price rose from 18 CAD to a high of 1,220 CAD, as shown in Figure 8.6. In 10 short years, the company went from being valued at $6.5 billion to $363.8 billion in August 2000. The company's share price benefited from the technology boom of the late 1990s, when investors ignored business fundamentals and anything technology-related rose in value. A lack of innovation and mismanagement caused Nortel's business fundamentals to deteriorate. Reality eventually set in and the tech bubble burst, causing Nortel's share price to collapse and reach a low of 0.185 CAD before the shares were finally delisted from the stock exchange.
For several years, Nortel was a stock market darling. Investment managers who did not own the company's shares had a tough time explaining to clients why they missed such a great opportunity. After the technology bubble burst, the tables turned and investment managers who had invested heavily in Nortel at sky-high valuations were the ones having to explain their decisions to clients.

FIGURE 8.6 Nortel Networks Share Price, in CAD (Canadian dollars)
Data source: Bloomberg, as of November 13, 2021.
Estimating Share Value
Analysts most often estimate the fair (intrinsic) value of a company's common shares using either an absolute or a relative approach. Estimating share price in relative terms involves calculating financial ratios and comparing the results to historical values, close competitors, and the overall stock market. Valuation methods aimed at deriving an absolute (target) share price are based on a company's ability to generate cash flows for shareholders.
Absolute Valuation
There are several different methods used by investors to estimate the absolute value of a company's shares, each with its own pros and cons. One common approach is to estimate the future unlevered free cash flows (UFCFs) generated by the business, and then discount them to arrive at a current value. A company's UFCF is equal to:
UFCF = EBITDA – Capital expenditures – Change in net working capital
Expected UFCFs are discounted (divided by an appropriate interest rate) to account for the time value of money and for the risk that these cash flows will not occur as expected. The further out into the future the cash flow occurs, the greater the discount applied to it. Simply put, one dollar received today is worth more than one dollar received next year, which is worth more than one dollar received the year after that, and so on. The discount rate should consider the company's weighted average cost of capital (WACC), but also any other factors that increase or decrease the risk of the company realizing those cash flows. The more uncertain the future cash flows of a company are, the higher the discount rate used. Higher discount rates are therefore often used for smaller companies, businesses in emerging industries, companies with a lot of debt, and sometimes in cases where a single entity, family, or individual controls a majority of the voting rights. Not only are the company's future cash flows uncertain, but the resulting target price is extremely sensitive to the discount rate.
Figure 8.7 provides a basic example of how to discount the free cash flows for a company, assuming end-of-year cash flows. Readers will note that the current year's UFCF is not discounted in this example, which indicates that it is the end of the current year. A 10% discount rate (r) is used in this example to simplify the calculation, but investors should carefully consider the risks and uncertainties of the company's cash flows before deciding on the discount rate to use. Importantly, the final year's cash flow also includes the terminal value of the shares, which is the cash flow the investor expects to receive upon the sale of the shares. To arrive at the discounted UFCF per share, we divide the annual UFCF per share by the discount factor for that year.
Adding these together we calculate the current value of the company's future free cash flows to be €5.00 + €5.23 + €5.37 + €5.07 + €4.78 + €35.70 = €61.15. From this amount we must subtract net debt to arrive at a fair value estimate of the company's shares. Net debt is equal to the value of non-operating assets (such as an investment in another company) minus debt and other non-equity claims. In this example, if we assume the company has non-operating assets per share of €5.00 and debt of €2.00 per share, the estimated fair value for the shares would be €61.15 + €5.00 – €2.00 = €64.15. In theory, if the shares are trading below the €64.15 fair value estimate, the investor could buy the shares and generate a positive return. If per-share data is not available, investors must make this calculation using data for the entire company and then divide the end result by the total number of shares outstanding to arrive at a per-share price. For companies that consistently pay dividends, investors may instead employ a dividend discount model. The formulas used to calculate discounted cash flows or dividends are readily available on financial and investing websites.
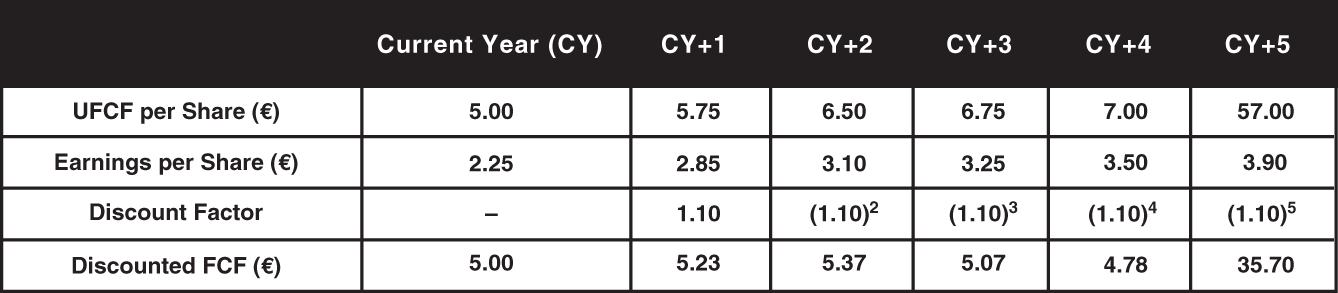
FIGURE 8.7 Discounted Cash Flow Example
Relative Valuation
Relative valuation methods estimate the fair value of a company's shares by applying a multiple to one of its financial metrics, including current or expected earnings, sales, or cash flow. These ratios are often based on the average multiple of competitors, the broad stock market, or historical values for the company. These approaches are commonly known as multiplier models. Using the data from the earlier example, if we apply a 10 times P/FCF multiple to the expected free cash flows, we arrive at a fair value estimate next year (CY+1) of €5.75 × 10 = €57.50, and €6.50 × 10 = €65.00 in two years (CY+2). Similarly, we could apply a price-to-earnings multiple to our estimated earnings per share to arrive at a future estimate of the share price. If we employ a P/E ratio of 20 times, the target price for one year from now would be €2.85 × 20 = €57.00 and for two years out the target price would be €3.10 × 20 = €62. The variability of results achieved using different approaches means that it is most helpful to use a combination of methods to estimate fair value, including discount models as well as multiplier models based on different metrics, such as earnings, sales, or cash flow.
Assessing whether a company is inexpensive enough to buy is often difficult. At market extremes, the answer may be obvious for the seasoned investor, but when sentiment is not at an extreme, estimating the fair value of a company is highly subjective. It is therefore best to consider valuation both in absolute and relative terms, comparing where the stock's current valuation metrics stand compared to your fair value estimate, the market, and to where it has traded in the past. Comparing the company's valuation to its closest competitors is also critical. Finally, companies in different industries are often assessed using different valuation metrics to better account for the operational realities of the business. In fact, for conglomerates and other large companies that operate in multiple industries, a sum-of-the-parts analysis may be the best approach to assessing valuation. A sum-of-the-parts analysis involves valuing each major business segment individually using the appropriate valuation metric for that industry, and then adding them to arrive at a total valuation for the company. We address these unique situations when we discuss global industries in Part Five.
Social Factors
Another area of growing importance to investors is a company's environmental, social, and governance (ESG) characteristics. The exponential growth of the internet has allowed the global exchange of information to flourish. It is common now to see environmental calamities and political upheaval as they occur in distant parts of the world in real time. Younger generations of investors are becoming increasingly aware of how businesses from around the world behave and may avoid doing business with or investing in companies that are socially or environmentally irresponsible. Good governance, which is also becoming increasingly important, requires that the board of directors controlling the company have their interests aligned with shareholders and that the composition of the board is diverse in terms of gender, race, and ethnicity. The growing expectation that businesses must act in a socially responsible manner has therefore made ESG considerations critically important to company boards. Being perceived as uncaring on environmental issues such as climate change or social issues can cost a business its customers and affect a company's long-term business fundamentals. Medium- to long-term impacts of climate change could also affect the viability of a company due to the effects of severe weather, flooding, and fires in locations in which the company operates, causing the value of the company's assets to decline. Therefore, it is essential to consider the impact of ESG factors on the company's viability. Even if you are not concerned about environmental, social, or governance issues personally, having a poor ESG rating could negatively impact a company's business prospects and share price.
Companies are increasing disclosures of their ESG policies and initiatives, but it is incumbent upon investors to discern whether these claims are legitimate. Fortunately, there are an increasing number of presumably independent businesses that assess the ESG policies of public companies and provide ratings for each business they analyze. Unfortunately, ESG ratings are not yet standardized, and in fact some areas of the field continue to evolve. For example, standards for climate change are still being developed. In addition, the impact of diversity on returns is not understood. Current diversity reporting focuses on outward signs of diversity so there is a risk of an actual lack of diversity in ideas. The major providers of ESG ratings for companies include S&P Global, Sustainalytics, Bloomberg, Thompson Reuters, ISS, MSCI, Dow Jones, and RepRisk. Most of these require a paid subscription to access, but your broker or trading platform may be able to provide ESG data to you at little or no cost. If not, a little extra research may be needed for you to decide whether a company has acceptable ESG policies in place.
Returning Capital to Shareholders
As noted earlier, perhaps the most important factor to consider when analyzing a business is the management team. The best companies have strong management teams whose compensation is structured in a way that promotes shareholder interests. This also means that the best management teams are effective stewards of investor capital. Periodically, management teams will find themselves with no attractive reinvestment opportunities and it is therefore critical that they make good choices about the use of cash being generated by the business. As industries mature, they become saturated and eventually consolidate until they are dominated by only a few large companies. Once these businesses have captured the addressable market entirely and can no longer buy competitors, they must find new sources of revenue in order to continue growing faster than the economy. Investors should be wary of management teams that buy other businesses purely for the sake of growth. Dedicating enormous amounts of capital to new endeavors and acquisitions must make sense for current shareholders. Astute management teams will recognize when there is a lack of prudent investment opportunities available and will instead choose to return excess cash to shareholders, either by issuing dividends or buying back stock. The latter is also known as a share repurchase and benefits shareholders in a comparable way to a dividend. Since repurchased shares are no longer a claim of ownership of the company's earnings, each remaining shareholder receives a slightly bigger piece of the pie as the total number of shares outstanding falls, causing earnings per share to rise. In addition to being visionaries in their industry, great management teams therefore have the ability to navigate a company through tough economic times and recognize when they should return capital to shareholders.
Assessing Acquisitions
Businesses can grow either organically (by investing in themselves) or through mergers and acquisitions. As an active investor, you will no doubt find yourself in a position where a business you own acquires, or is acquired by, another company. If the business you own is the company being acquired (the target), the thought process is relatively simple. If you believe the terms and price being paid is fair, you can simply agree to surrender your shares to the acquiring company in exchange for the offered price. Although acquisitions are often made entirely with cash, the price paid may be comprised of both cash and shares of the acquirer. In cases where shares of the acquiring company are being offered as compensation, investors must assess whether they want to continue to be an owner of the new business entity.
When an acquisition is announced, the share price of the target company usually jumps to a level close to the stated purchase price. If there is some doubt that the transaction will proceed, the share price may remain at a discount to the announced purchase price and slowly climb as it becomes clear the acquisition will be approved by regulators and shareholders. As an investor, you will have to decide whether it makes sense to continue holding shares of the target company, or to simply sell them in the open market and invest the proceeds in another business. This decision will depend on the current discount to the purchase price, the expected time needed to close the acquisition, as well as the availability of other investment opportunities. Keep in mind that acquisitions may require approval from more than one regulatory body, especially when they involve companies that operate in multiple countries.
If you own the acquiring business, the process of assessing the acquisition is more complex. You must determine whether the management team you have entrusted with your money is making a sound investment and whether the price they are paying is reasonable. As an owner of the company making the acquisition, investors should determine whether the acquisition is accretive and causes earnings per share (EPS) to rise, or dilutive and causes EPS to fall, if there are strategic benefits for the acquiring firm (such as giving it access to new customers or essential new technology), whether cost savings will be realized from merging the companies, and if the price paid for the business was reasonable. If a company you own announces an acquisition that does not make strategic sense to you, or you believe the price being paid is too high, you should consider selling your shares and looking for another investment opportunity.
Summary
To summarize, there are a few common characteristics present in all good businesses from around the world. They have defensible, leading market positions in growing industries, astute management teams, strong balance sheets, and a strong social conscience. The checklist in Figure 8.8 highlights some of the questions you should be able to answer with confidence prior to making an investment in any business.
It is not enough to answer these questions once and then forget about them. Things can change quickly in the business world and so it is crucial to revisit these questions regularly with respect to each of your holdings and their primary competitors. Unless you are vigilant and take a moment to contemplate these issues on a recurring basis you may miss an opportunity to exit a business that is on the brink of declining or buying into a business showing emerging strength. This chapter has provided a brief overview of how to identify a great business, but for a detailed discussion on company analysis I strongly suggest you read Security Analysis by Benjamin Graham and David Dodd.
We now switch gears and review the sectors and industries in which these global businesses operate.

FIGURE 8.8 Company Checklist