
CHAPTER 11
Consumer Staples
________________
Businesses in the global consumer staples sector provide goods and services to consumers that are nondiscretionary in nature, meaning they are essential. These are items that consumers purchase regardless of economic conditions. Sales and profits for companies in the sector traditionally grow at the same rate as the underlying economy. The reason for this is that the main driver of growth is through increasing sales volumes, which is primarily driven by economic and population growth. Most of the goods and services these businesses supply are similar with close substitutes, and therefore the scale of production and brand recognition are particularly important factors for separating the winners from the losers. In fact, consumers often base their purchase decision on brand and are often reluctant to change their preferences. Industries within the consumer staple sector therefore do not usually experience sudden changes in market share between key competitors. In the beverage industry, for example, consumers usually prefer either Coca-Cola or Pepsi products and rarely switch between the two. Despite this, companies do emerge with products having unique characteristics that enable them to grow quickly for an extended period of time. Eventually, however, competitors will begin to offer comparable products at lower prices and thereby eliminate any short-term advantages.

Data source: Bloomberg, as of March 18, 2022.
In general, consumer staple companies are less sensitive to the economic cycle because they sell everyday items such as groceries as well as certain household products like cleaning supplies and toothpaste. Whether economic conditions are good or bad, these businesses earn relatively stable profits. The relatively predictable nature of earnings for consumer staple companies means that most investors view them as being defensive, and investors often shift capital into the sector when economic conditions are expected to worsen as a means of preserving capital. It is therefore during bear markets that consumer staple stocks show the best relative performance. The lower relative growth rates for most consumer staple companies leads investors to move money out of them once economic conditions improve and we enter a bull market, instead favoring businesses in industries that will benefit more during periods of strong economic growth.
In this chapter we take a closer look at the six main industry groups within the sector: (1) beverages, (2) grocery and convenience stores, (3) household products, (4) hypermarkets, (5) packaged foods, and (6) tobacco.
Beverages
The beverage industry includes producers of both alcoholic and nonalcoholic drinks. Some of the companies noted here, such as Pepsi, also produce a wide variety of snack foods. Beverage producers can grow through acquisition by buying other product lines, and organically by investing in research and development in the hope of developing a successful new product. Either approach allows the company to leverage their strong supply chains and distribution networks. After years of slow growth, the importation of energy drinks into the United States gave a boost to industry growth rates and launched a variety of competitors. Segments of the beverage industry have received negative press at times due to possible health issues arising from consuming excessive amounts of soft drinks and energy drinks. Economic factors that have the greatest impact on profit and revenue growth for the beverage industry include GDP growth, food prices, packaging costs, wages, freight costs, and supply chain disruptions. Availability of containers and packaging can also impact industry profitability. These businesses sell goods that are relatively inexpensive and that many people find difficult to live without. This means that they generate consistent profits regardless of the economic environment and their earnings tend to hold up relatively well during recessions. Most beverage producers earn above-average profit margins, but growth is usually limited to the broader rate of economic growth in the regions in which they operate. Investors should track SG&A expense ratios, ad spending, volume, sales, and profit (EBIT) growth in total and by region. Both P/E and EV/EBITDA ratios are often used to compare valuations between companies in this industry.

Data source: Bloomberg, as of March 18, 2022.
Grocery and Convenience Stores

Data source: Bloomberg, as of March 18, 2022.
Grocery and convenience stores sell food and nonfood staples, sometimes including gasoline. Current trends in the industry include growing demand for food, semi-prepared and prepared meal delivery, as well as a shift toward healthier eating habits. Food is a necessity of life, making the industry perhaps the least sensitive to the economic cycle. However, these businesses do compete with restaurants and other forms of food delivery, such as semi-prepared meals, and consumers are sensitive to rising food costs, which may cause them to buy lower-cost items that typically generate lower profit margins for the business. Economic factors that have the greatest impact on profit and revenue growth for the industry include GDP growth, food prices, packaging costs, wages, freight costs, and supply chain disruptions. Supply chain management is a critical component of success for these businesses, especially to the degree they sell perishable goods. Accordingly, these businesses require operational scale, which gives them buying power (the ability to purchase larger quantities of inventory at lower prices). The grocery industry generates relatively low profit margins in most developed countries and therefore relies heavily on selling large volumes of products to generate earnings in those regions. For companies that cover large geographic areas, higher fuel costs could drive up transportation costs and negatively impact profits. Investors should monitor same-store sales growth, foot traffic, ticket size, new-store growth, new-store productivity, total revenue growth, change in gross margin, SG&A rate (and SG&A leverage), SG&A per store or SG&A per square foot growth (to normalize for changes in store count), EBIT margin (and change in EBIT margin), EBIT and EPS growth, leverage (net debt/EBITDA), and lease-adjusted leverage (net debt, including operating leases/EBITDAR). Commonly used valuation measures for the industry include P/E and EV/EBITDA.
Household Products

Data source: Bloomberg, as of March 18, 2022.
The household products industry produces a wide range of everyday necessities, including toothpaste, shampoo, soap, makeup, and cleaning products. These businesses sell goods that are difficult to live without and therefore they generate relatively consistent profits regardless of the economic environment. Like companies in the beverage industry, household product companies can grow through acquisition by acquiring other product lines or companies, or organically by investing in research and development in the hope of developing a successful new product. Either of these will allow the company to leverage their strong supply chains and vast distribution networks. Companies in this industry are benefiting from continued expansion into developing economies. Although the industry is mature and growth is usually limited to the broader rate of economic growth in the regions in which they operate, their predictable earnings allow them to pay competitive dividends and grow them at an above-average rate. Most household and personal product companies generate attractive profit margins, because of both brand power and manufacturing scale. Availability of containers and packaging, as well as shipping, raw material, and labor costs, can have a significant impact on profitability. Investors should track advertising and promotion spending levels, growth rates in emerging markets (a key area of growth for the industry), organic sales growth, and operating margins. Principal factors for investors to track include gross and EBIT margin, SG&A expenses, and new product innovations. Both P/E and EV/EBITDA ratios are often used to compare valuations between companies in this industry.
Hypermarkets

Data source: Bloomberg, as of March 18, 2022.
Hypermarkets are large-format stores that sell essential and nonessential products to businesses and consumers, including both food and nonfood items. Customers often visit the store for food or personal products and purchase something they did not intend to buy (there is an element of treasure-hunting at some of these stores). Most retail concepts struggle to expand overseas and are therefore geared to the local market. However, US-based Costco and Walmart are exceptions. Walmart has localized concepts or brands in several Asia-Pacific regions, while Costco has traveled well and successfully expanded internationally. As with other consumer-focused businesses, profitability for hypermarkets can be affected by inflation, whether caused by product, labor, or transportation costs. Similar to the grocery and convenience store industry, hypermarkets often generate comparatively low profit margins and rely heavily on selling large volumes of products. For these companies, operational scale is required to afford them the buying power needed to purchase inventory in volume at lower prices. Pricing power and the ability to offset inflationary pressures is crucial in deciding relative winners and losers in the industry. For companies that cover large geographic areas, transportation costs can meaningfully impact profitability due to higher fuel costs. Important metrics to track include same-store sales growth, the source of growth (traffic volume or ticket size), per-store-unit growth, new-store productivity, revenue growth, gross and EBIT margins, SG&A/square foot growth, EBIT and EPS growth, as well as leverage (net debt/EBITDA) and lease-adjusted leverage (net debt, including operating leases/EBITDAR). Standard valuation measures such as P/E and EV/EBITDA are often used to assess valuations in this industry.
Packaged Foods
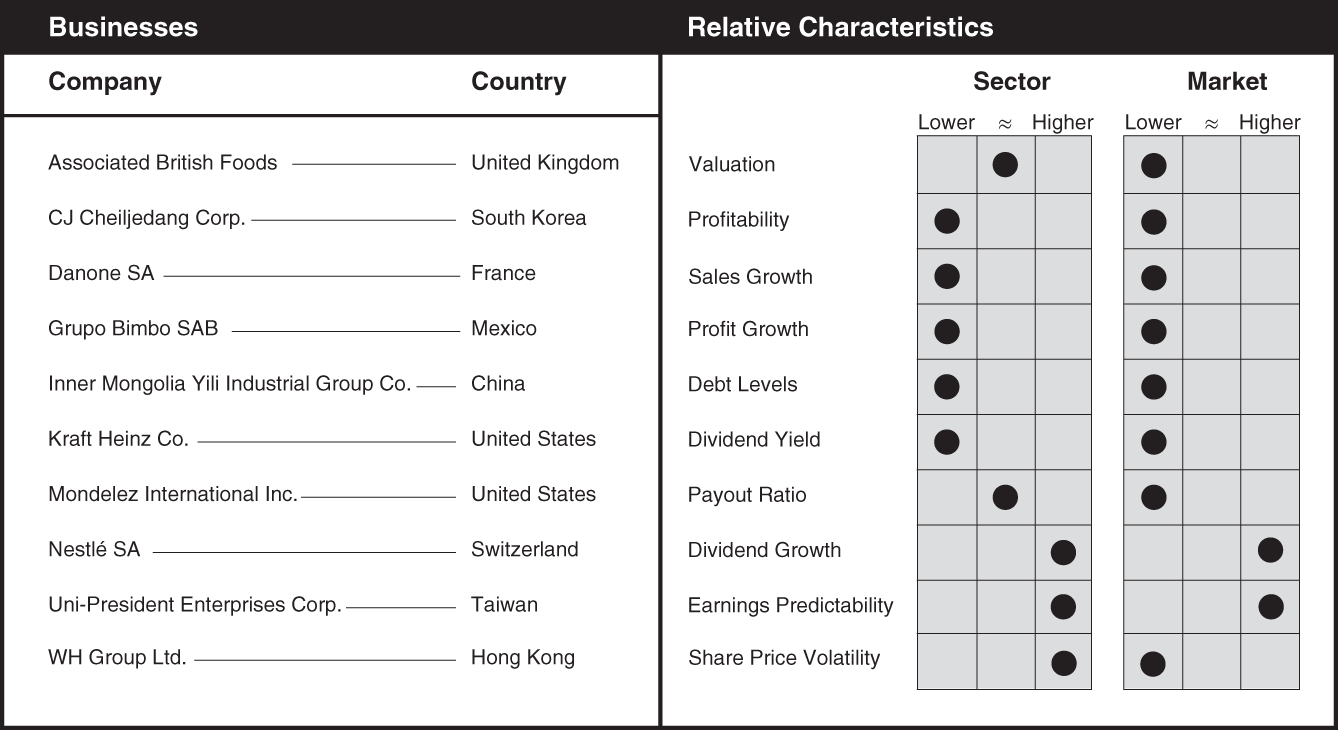
Data source: Bloomberg, as of March 18, 2022.
The packaged food industry prepares food products that are sold through wholesalers, grocery stores, convenience stores, and hypermarkets. Brand strength can be an important consideration in the packaged foods industry. Consumers will often buy a higher-quality brand of food product when economic conditions are good but shift to less expensive products when economic conditions weaken to save money. Economic factors that have the greatest impact on earnings and revenue growth for the packaged foods industry include GDP growth, food prices, packaging costs, wages, interest rates, freight costs, and supply chain disruptions. Inflation can be problematic for the packaged food industry as it can take between six and nine months for companies to pass along higher costs to consumers by increasing prices. Furthermore, as inflation hits consumers in other areas, such as gasoline and rent, it can become difficult for packaged food companies to fully pass along higher costs to consumers and may eventually affect profit margins. As with many other companies in the consumer staple sector, packaged food companies typically sell high volumes of products that generate below-average profit margins. Important metrics for investors to monitor are both segment and geographic organic growth rates, gross profit, gross margin, adjusted profit margin by segment, adjusted operating profit and margin by geographical region, advertising and promotional spending, EBIT, and EBITDA as well as EBIT and EBITDA margins. Both P/E and EV/EBITDA ratios are often used to compare valuations between companies in this industry.
Tobacco

Data source: Bloomberg, as of March 18, 2022.
Although in long-term secular decline, the use of tobacco products remains at high absolute levels. The World Health Organization estimated that tobacco use had fallen from 1.397 billion people in 2000 to 1.337 billion in 2018, a drop of 60 million people.1 Despite the slow decline in use of tobacco products, which is expected to continue as a result of increased regulation and growing awareness of the health risks involved with its use, tobacco companies still produce consistent profits and cash flows. For this reason, shares of tobacco companies perform well during times of market uncertainty, as investors often reallocate capital to the industry when the economic cycle is nearing a peak and a recession is likely to occur. Economic considerations include inflation, interest rates, supply chain disruptions, government regulations, and taxation. Investors should track percent change in volume, segment and geographical organic growth, gross revenue, excise taxes, net sales growth, gross profit, gross margin, operating income, operating margin, EBIT, EBITDA, as well as EBIT and EBITDA margins. Since the companies within the tobacco industry are mature and generate consistent earnings, standard valuation metrics such as P/E, P/CF, and EV/EBITDA can be used to compare relative valuations between companies.
Note
- 1. World Health Organization, “WHOI Launches New Report on Global Tobacco Use Trends,” December 19, 2019, https://www.who.int/news/item/19-12-2019-who-launches-new-report-on-global-tobacco-use-trends.