
CHAPTER 16
Information Technology
________________
The global technology sector includes companies providing software, electronic equipment, semiconductors, and IT services used in every corner of the globe and is the driving force behind the digital economy. The technology sector has played a leading role in improving human productivity over the past few decades. Every sector of the global economy relies on the technology sector to run its operations effectively. The invention of the semiconductor was central to this revolutionary process, but semiconductors alone did not achieve this feat. Corresponding advancements in software and other electronic devices also played critical roles in enhancing productivity.

Data source: Bloomberg, as of March 18, 2022.
Like the financial sector, many companies in the technology sector are interest rate sensitive; however, there is an important distinction. Businesses in the financial sector are primarily affected operationally by changes in interest rates, but in the case of technology companies, valuations may also be impacted. This is especially true for tech companies trading at high valuations. As previously noted in Chapter 5, rising interest rates have a larger, negative impact on long-dated bonds and the share prices of companies whose cash flows are expected to occur further into the future. The reason the technology sector is especially vulnerable to rising interest rates is because it contains a larger proportion of early-stage businesses with little or no earnings and high expected future growth rates. That being said, not all companies in the technology sector would be considered long-duration assets since they already generate strong earnings.
The technology sector usually outperforms the market throughout the entire bull market but is especially vulnerable late in the cycle due to rising interest rates and is often the weakest-performing sector in bear markets.
In this chapter we review eight main industry groups that together comprise the technology sector: (1) communications equipment, (2) electronic components, (3) fintech and payment processing, (4) IT consulting, (5) semiconductors, (6) semiconductor equipment, (7) software, and (8) technology hardware.
Communications Equipment

Data source: Bloomberg, as of March 18, 2022.
Software and equipment (hardware) produced by the communications equipment industry forms the backbone of both the internet and the world's telecommunications infrastructure. These businesses produce switches, routers, and various other components. Initial advancements in the industry came from hardware development, but now efficiency gains are increasingly coming from improvements in the software needed to run the equipment. According to the United Nations Conference on Trade and Development (UNCTAD), communications equipment was the second-most widely traded good globally in 2020, representing nearly US$2 trillion in value.1 The industry tends to be somewhat regionalized, with US firms having the greatest presence in the United States and Europe and a smaller footprint in Asia, where Chinese vendors are dominant. Notable industry trends include the deployment of 5G networks, a shift to hybrid office environments, supply chain bottlenecks, and cloud hyperscale (the ability to scale data center capacity as demand is added to the system), as well as the continuing migration of enterprises (businesses) to the cloud. Economic factors with the greatest impact on sales growth and profitability include business confidence (which is an important driver of IT budgets), commodity, labor, and component costs (important to gross margins). In its infancy, the communications equipment industry grew strongly and generated extremely high profit margins. As the industry matured, however, growth rates and profitability have fallen as many of the products have become commoditized. Important metrics that investors should track include revenue, margin, and earnings growth, cash flow, capital allocation (R&D, share repurchases, dividends and acquisitions), subscription revenue growth for communication software segment, and gross margins. Valuation measures such as P/E and EV/EBITDA as well as discounted cash flow analysis are commonly used to compare valuations between companies in this industry.
Electronic Components
The electronic component industry produces a wide variety of products, including optical network equipment, semiconductor parts, sensors, digital displays, connectors, cables, power supplies, inductors, transformers, and capacitors, just to name a few. These components are used in a multitude of devices, such as appliances, airplanes, automobiles, computers, and mobile phones. Many of the products created by this industry are commoditized (do not differ significantly between companies in terms of functionality). Like other commoditized industries, pricing power is limited, and manufacturers rely on scale and strong supply chains and distribution networks to remain competitive. Economic factors with the greatest impact on earnings and sales growth include business confidence (an important driver of IT budgets), industrial production, capacity utilization, ISM purchasing manager survey, as well as commodity, labor, and component costs (important for gross margins). Similar to the communication equipment industry, profit margins for electric components have been below average; however, growth rates for the industry remain strong, as end market demand for electric components has remained robust. Important company metrics that investors should track include revenue and operating margins by product or segment, capital expenditures, product or segment market share, fab (fabrication plant) utilization, product shipments and order backlog (where available), as well as demand for consumer electronics. Standard valuation measures such as P/E, P/CF, and EV/EBITDA or discounted cash flow analysis are commonly used to assess company valuations in this industry.
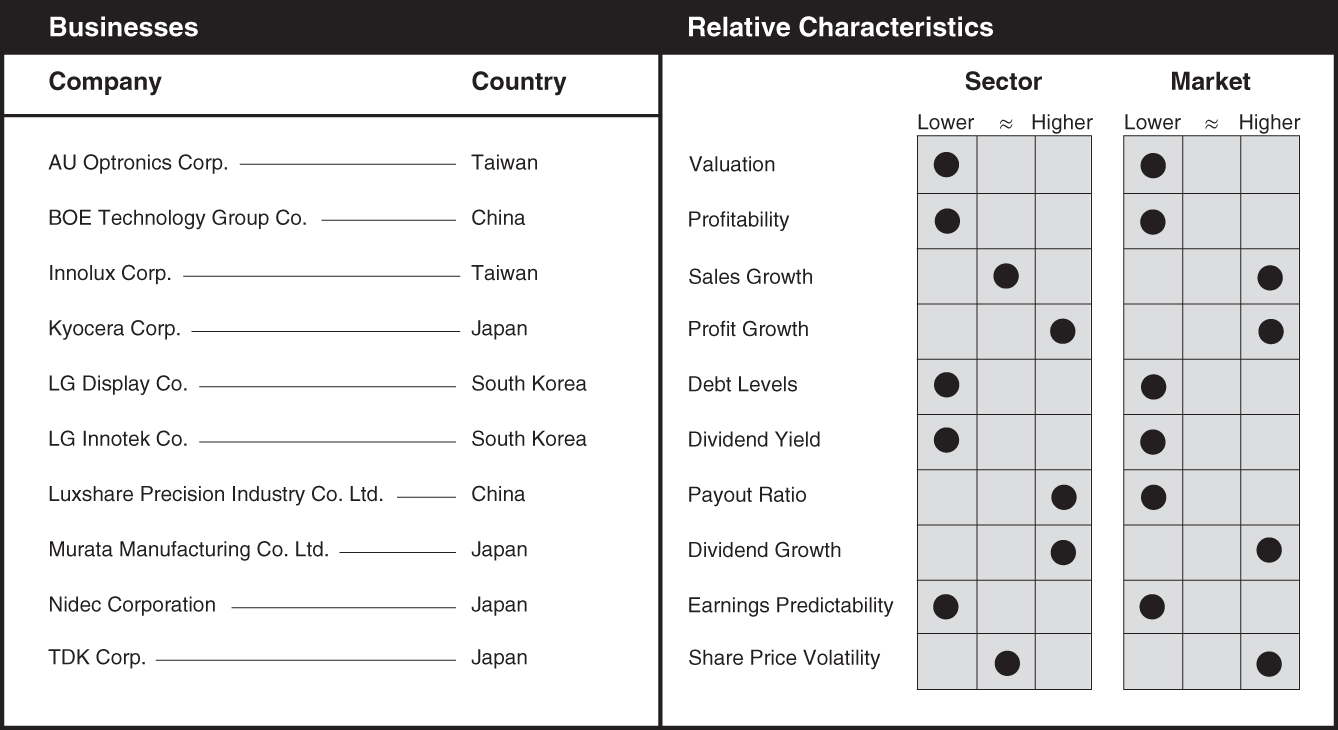
Data source: Bloomberg, as of March 18, 2022.
Fintech and Payment Processing
The fintech and payment processing industry is a rapidly evolving segment of the technology sector. Fintech (financial technology) companies provide systems and software that allow businesses and individuals to complete financial transactions. High barriers to entry allowed credit card companies, such as Visa and Mastercard, along with payment processors like Global Payments, to dominate this industry for years. However, technological improvements have made it easier for new entrants to introduce disruptive solutions and compete for market share. These disruptive technologies, combined with inexpensive, readily available capital, have enhanced competition and structurally impaired return on investment for the industry's incumbents. There are significant differences in both interchange economics (fees received for processing transactions) and the regulatory treatment of fintech companies, across countries. The industry has experienced a shift in consumer preferences away from using cash to cards and online transactions, a trend that has served to disrupt the financial service offerings of banks. Economic factors with the greatest influence on sales growth and profitability include nominal GDP growth, personal consumption expenditures, e-commerce growth, cross-border volume growth, international travel, interest rates, changes in employment levels, and loan delinquency rates. Strong global economic growth in recent years is reflected in the industry's above-average profit margins and its strong sales and earnings growth, while high reinvestment requirements have restricted the ability of these companies to pay dividends. Important metrics that investors should monitor include TPV, take rate, user growth, and EBITDA margins. Common measures used to compare valuations between companies in this industry include P/E, P/CF, and EV/EBITDA.

Data source: Bloomberg, as of March 18, 2022.
IT Consulting

Data source: Bloomberg, as of March 18, 2022.
The information technology (IT) consulting industry helps companies advance into the digital era, designing and implementing complex technological solutions that improve organizational efficiencies. Some of these solutions include intelligent systems, cloud technologies, automation, application development, systems integration, analytics, and cybersecurity. End market customers are found in every segment of the world economy, including healthcare, financial services, manufacturing, telecommunications, media, and retail. IT consulting companies have benefited from both a strong desire to improve business productivity across many industries, as well as the increasing complexity of corporate IT infrastructure and the high costs of in-house management. Economic factors that affect their customers can impact IT consulting businesses, since a reduction in IT spending (especially if it is outsourced) is a quick way for companies to cut costs in periods of economic weakness. To illustrate, reduced demand for automobiles may prompt auto OEMs to reduce capital expenditures by postponing or eliminating IT projects. Projects that are mission-critical or that deliver significant operational efficiencies are less prone to cutbacks. Although their sales and profit growth has lagged, these companies have grown their dividends more than the market in recent years. Important metrics that investors should monitor include labor availability, employee count, utilization rates, revenue per employee, revenue, and margins by business segment, adjusted operating margins, and gross margin growth. Standard valuation measures such as P/E, P/CF, and EV/EBITDA are commonly used to compare valuations between companies in this industry.
Semiconductors
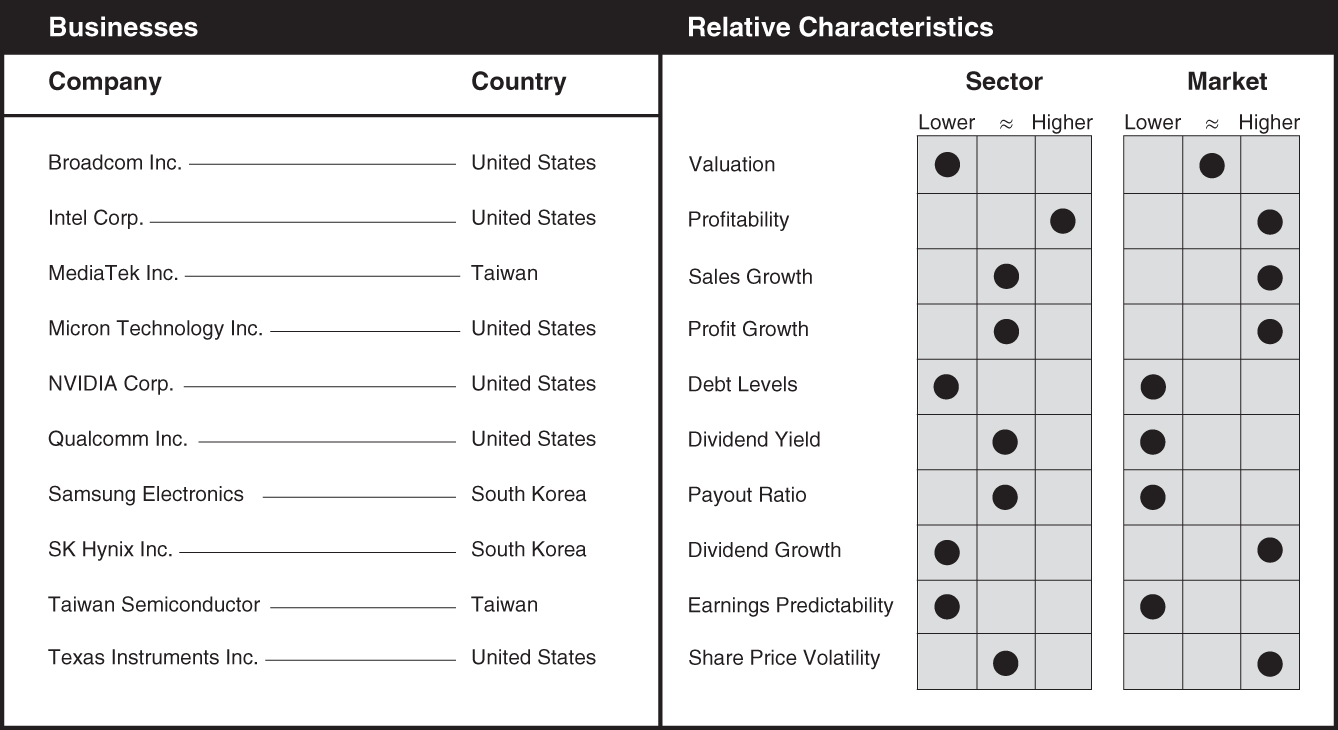
Data source: Bloomberg, as of March 18, 2022.
Companies in the semiconductor industry design and manufacture computer chips, including NAND (flash memory), DRAM (temporary data storage in computers and other devices), graphic chips (GPUs), core processors (CPUs), and logic controllers, among others. Many of the semiconductors produced today are designed to serve a specific purpose. Once designed, computer chips are manufactured in a fab. Accordingly, companies that outsource the manufacturing process of the chips they design are referred to as fabless semiconductor companies. Manufacturing semiconductors is highly capital intensive and requires advanced machinery and knowledge. New fabs being constructed today cost upwards of US$10 billion each to build. For this reason, there are very few semiconductor companies that focus only on fabrication, with Taiwan Semiconductor being one example. Most successful semiconductor companies design chips that improve on previous designs, making them smaller, faster, or consume less energy. Recent supply chain problems and rising geopolitical tensions have resulted in a trend toward onshoring or nearshoring production, which is driving investment in domestic manufacturing capacity. Other important themes include increased electric vehicle (EV) production, data center growth, artificial intelligence (AI), machine learning (ML), as well as the Internet of Things (IoT). These trends are serving as long-term structural tailwinds for the industry. Natural disasters such as earthquakes have the potential to disrupt the chip supply if they occur where fabs are located. Economic factors with the biggest influence on sales growth and profitability include commodity prices, freight, and logistics costs. Economies of scale are critical for fabs, but less so for fabless companies who can maintain high margins through continual design innovations. The industry is still growing quickly and generates above-average profit margins. However, these companies tend to have lower dividend yields than the market because significant reinvestment is required to stay competitive. Important financial metrics that investors should track include inventory levels, gross margin, and lead times. Semiconductor companies can usually be valued using the P/E multiple, but for younger, faster-growing companies that need to reinvest the vast majority of their cash flows, a P/CF ratio or discounted cash flow analysis would be more appropriate. A useful source for information on the industry is the Semiconductor Industry Association website at www.semiconductors.org.
Semiconductor Equipment
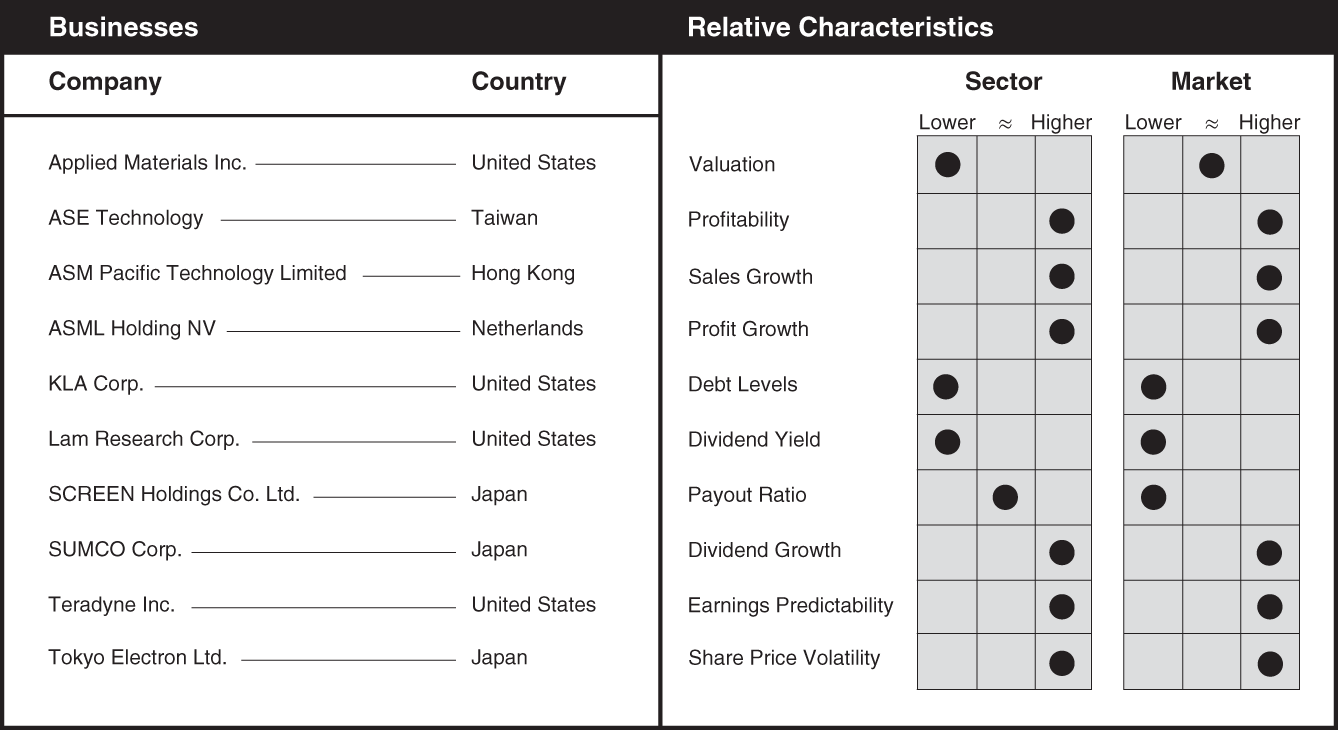
Data source: Bloomberg, as of March 18, 2022.
Semiconductor equipment companies build the tools needed to design, manufacture, package, and ship semiconductor chips. These goods are at the forefront of advanced technology, where billions of circuits as small as two nanometers in width are etched into thin layers of wafers made from silicon using a process known as extreme ultraviolet lithography. In fact, all aspects of semiconductor manufacturing, even packaging, require technological expertise and advanced manufacturing capabilities. The high growth rate of the semiconductor industry feeds into the equipment industry. This is especially true today, with a worldwide shortage of semiconductor chips leading to calls for greater local production of semiconductors (onshoring). This means that more fabs are being built around the globe, which should keep industry demand strong for years to come. As is the case with semiconductors the growth in electric vehicles (EVs), data centers, artificial intelligence (AI), machine learning (ML), and the Internet of Things (IoT) creates a strong backdrop for semiconductor equipment demand. Economic factors influencing sales growth and profitability for the industry include commodity prices, as well as freight and logistics costs. Demand for semiconductors, and by extension semiconductor equipment, is cyclical and share prices can be volatile. Like semiconductors, semiconductor equipment companies have generated profit margins and growth rates above that of the market. Important metrics that investors should monitor include inventory levels, gross margin, fab capital expenditure budgets, lead times, and chip pricing. Valuation ratios such as P/E, P/CF, and EV/EBITDA can be used to compare valuations between companies in this industry.
Software

Data source: Bloomberg, as of March 18, 2022.
Software companies offer a broad range of computing-based platforms that give electronic devices functionality. The software industry can be divided into two broad categories, system software and application software. Systems software refers to the underlying software needed to operate a device, while application software acts as a second layer of functionality that is focused on a specific use. Since software development is carried out primarily by people rather than machinery, capital investment is lower than for hardware manufacturers, resulting in higher levels of profitability. A key industry trend has been the prioritization of software spending on digital transformation, cloud computing, artificial intelligence (AI), machine learning (ML), and automation. Economic factors that have the greatest impact on sales growth and profitability for the industry include GDP growth, employment growth, wage growth, and corporate IT budgets across the economy. Software companies selling primarily to small and mid-sized businesses are typically more sensitive to the economic cycle and to trends in new business formations, while enterprise software (which generates revenue from large businesses) is more resilient. Enterprise software has little to no supply chain disruption risk, and in some cases, software is viewed as an inflation hedge since it makes employees more productive, reducing the need to hire additional staff. Important metrics for companies in the software industry include subscriber numbers, net revenue, customer retention rate, average revenue per user (ARPU), billings, changes in remaining performance obligations (RPO), and annual recurring revenue (ARR). Software companies can usually be valued using the P/E ratio, but for younger, faster-growing companies that need to reinvest their cash flows, a P/CF ratio or discounted cash flow analysis would be more suitable.
Technology Hardware
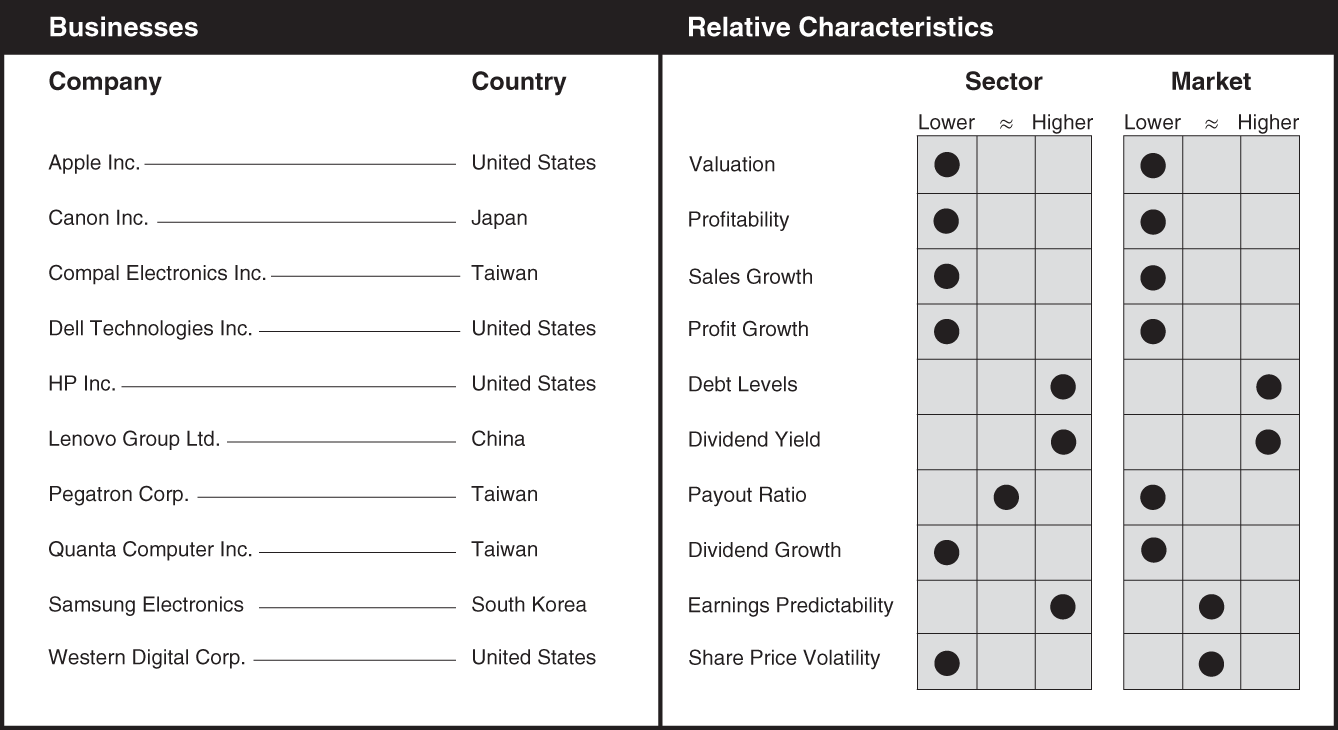
Data source: Bloomberg, as of March 18, 2022.
Technology hardware companies build mobile devices, laptops, personal computers, and hard-disk drives, among many other products. Hardware refers to the physical components that make up a device while software refers to the programming or coding that is needed for the device to function. Trends affecting the industry include the buildout of cloud infrastructure, enterprise data management, and the rapid development of artificial intelligence (AI) and machine learning (ML). Economic factors that have the greatest impact on industry sales growth and profitability include GDP growth, employment growth, and corporate IT budgets across the global economy. Profitability varies significantly within the industry, where businesses that distinguish their products (often through added layers of software that improve functionality) can generate higher profit margins. Other segments of the hardware industry produce goods that are commoditized, meaning that the products are similar regardless of who manufactures them. In these instances, profit margins tend to be lower and overall profits of the firm are determined more by the number of units sold. In both cases, though, supply chain management as well as manufacturing efficiency and scale are primary determinants of a company's success. Important metrics for investors to track include customer inventory levels, cost inflation, product and replacement cycles, new product deployments by competitors, capex budgets, capacity additions in the industry, operating profits and margins, gross margins, and revenue growth by segment or product line. Standard valuation measures such as P/E, P/CF, and EV/EBITDA can be used to compare valuations between companies in this industry.
Note
- 1. United Nations Conference on Trade and Development, “Key Statistics and Trends in International Trade 2021,” https://unctad.org/system/files/official-document/ditctab2022d3_en.pdf, accessed April 3, 2022.