Financial strength
Interest cover
Over-trading is among tradesmen as over-lifting is among strong men; such people, vain of their strength…at last lift at something too heavy for them, over-strain their sinews, break some ofnature’s bands and are cripples ever after.
DANIEL DEFOE (1660–1731)
By ‘financial strength’ we mean a company’s ability to withstand operating setbacks. In the previous chapter we looked at the short-term position. The long-term situation is even more important. To arrive at an assessment for this we look at a company’s total borrowings, and we relate them to its trading cash flow. The first measure we use is referred to as ‘interest cover’.
Interest cover
This ratio is of fairly recent vintage. It is unique in that it is a measure derived solely from the profit and loss account.
![]()
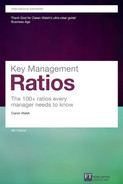
The ‘interest’ charge is divided into the ‘EBIT’ figure to give the ‘cover’ expressed as ‘so many times’.
Previous ratios looked only at the amount of borrowing. This ratio measures a company’s ability to service those borrowings.
Three factors determine its value:
- The operating profit
- The total amount borrowed
- The effective rate of interest.
A highly profitable company can have very adequate interest cover even though the balance sheet may appear to be over-borrowed.
The level of interest rates in an economy will impinge significantly on this ratio, which may partly explain why low-interest economies seem to accept more highly leveraged balance sheets.
![]()
The term ‘financial leverage’ is used to reflect the relationship between profit and the fixed interest charge. If financial leverage is high, that is, if interest is a high part of pre-interest profits, a small change in operating profit will be greatly magnified in its effect on return to the shareholders. A highly leveraged company does well in boom times, but quickly falls into difficulty in recession.
We can see in figure 10.1 that the average for the US Consolidated Company Inc. is 10.9 times. UK research has shown that most successful companies operate at a value of approximately 5.5 times. A prudent value for a company is 5 times.
Figure 10.1 Interest cover applied to data from (A) the US Consolidated Company Inc., (B) UK top companies, 2000

‘Debt to equity’ ratio (D/E)
The ‘debt to equity’ ratio is one of the most fundamental measures in corporate finance. It is the great test of the financial strength of a company. Although used universally, it unfortunately turns up under many different names and with different methods of calculation. This causes some confusion which we will try to remove in this chapter.
The purpose of the ratio is to measure the mix of funds in the balance sheet and to make a comparison between those funds that have been supplied by the owners (equity) and those which have been borrowed (debt). This distinction is illustrated in figure 10.2.
The idea seems a very simple one. Nevertheless difficulties arise in two areas:
- ‘What do we mean by debt?’
- ‘How exactly will we express the calculation?’
![]()
We will first consider different meanings given to the term ‘debt’. In figure 10.3 you will see the three interpretations in common use:
- long-term loans only
- long- and short-term loans (i.e., all interest-bearing debt)
- long-term loans plus all current liabilities (i.e., total debt)
Note that the first two definitions concentrate on formal interest-bearing debt, i.e., that sourced from banks or other financial institutions. In bank calculations, these are the definitions most commonly used. The final definition includes trade creditors plus all accruals, such as dividends, tax and other miscellaneous amounts.
![]()
The reason bank analysts use the more restricted view of debt is understandable. Their claims usually rank ahead of trade and other creditors. (Note that, at this point, we leave out the important question of creditors with statutory preference.) From the banks’ point of view, the only debt that matters is that which ranks equal to or ahead of their own position.
However, from the companies’ viewpoint, debt due to a supplier is just as real and as important as that due to a bank. There are therefore good arguments for including all debt in the calculation of the debt to equity ratio.
Figure 10.2 The debt to equity ratio

Figure 10.3 Different definitions of debt

Debt/equity – methods of calculation
As stated previously, one kind of debt is as important as another from a management point of view. For that reason, we will use the broadest definition – long-term loans plus current liabilities – for the remainder of this book. This done, we will examine the various ways in which the ratio can be calculated.
First we should emphasize that it matters little which method of calculation we use. Different methods simply give different numbers that mean the same thing. We can measure length in either inches or centimetres and the different numbers express the same length. So also we express the relationship between equity and debt in different ways. The true ratio is the same irrespective of how it is expressed.
This point is worth noting. There are a relatively small number of independent financial ratios that are absolutely fundamental; this is such a one. Sometimes it seems that there are dozens of business ratios of all kinds.
![]()
Figure 10.4. shows three methods for expressing the ‘debt to equity’ ratio:
Method 1 – debt over equity
This is the classic approach and it is used widely, i.e., all formal interest bearing debt is expressed as a ratio to equity. When a debt to equity value is quoted for a company, then, in the absence of evidence to the contrary, it should be assumed that this method has been adopted.
Method 2 – equity over total funds
An approach that is not so common. The answer is almost the reciprocal of the third method shown below and one which is more often encountered.
Method 3 – total debt over total funds
This approach is favoured by the author, i.e., all debt in the balance sheet, whether interest bearing or not, is expressed as a percentage of total funds. It gives an instant picture of the funding side of the total balance sheet. The numbers are easily extracted from the most complex set of accounts.
![]()
(The thorny question of how to treat deferred tax and other miscellaneous funds is being ignored for the present. While these items can give rise to nice academic debates, in practice they do not cause serious difficulties. They are usually insignificant in terms of the total balance sheet – see appendix 1.)
Figure 10.4 Different methods of expressing the debt to equity ratio

Debt/equity – why it is important
![]()
We place a lot of emphasis on this ratio because, if it goes wrong, the company has a real long-term problem; one which may become terminal.
The greater the debt, the greater the risk. All debt in the balance sheet gives third parties legal claims on the company. These claims are for interest payments at regular intervals, plus repayment of the principal by the agreed time. The principal is repaid either by periodic instalments or a single lump sum at the end of the loan period.
Therefore when a company raises debt, it takes on a commitment to substantial fixed cash out-flows for some time into the future. The company does not have a guaranteed cash in-flow over the same period. Indeed the in-flow may be most uncertain. A fixed cash out-flow combined with an uncertain cash in-flow gives rise to financial risk. It follows that the greater the loan, the greater is the risk.
Why, then, do companies take on debt and incur this extra risk? The answer lies in the relative costs. Debt costs less than equity funds. By adding debt to its balance sheet, a company can generally improve its profitability, add to its share price, increase the wealth of its shareholders and develop greater potential for growth.
![]()
Debt increases both profit and risk. It is the job of management to maintain a proper balance between the two.
Where should the line be drawn? The increased return to the equity shareholder that results from debt leverage can rarely be forsaken altogether even though some companies do just that. Most companies must take a view on the degree of uncertainty of future cash receipts and arrange their level of debt in line with this uncertainty.
We find that companies in business sectors with very predictable income streams, e.g. property leasing, incur high levels of debt. Companies in highly volatile sectors, e.g. mine exploration, fund mainly from equity.
![]()
We find geographical as well as sectoral differences in companies’ approach to debt (see figure 10.5). In the US as well as in the UK the approach is more conservative than we find in the EU. In the former locations it is unusual for debt/total assets to exceed 60 per cent. In the latter we often encounter ratios of 70 per cent and over.
Figure 10.5 Analysis of debt/total assets ratio by country and by sector

Much has been written exploring the reasons for these variations. The general conclusion seems to be that they arise because of attitudinal, cultural and historical, rather than financial, factors.
Leverage
This subject is covered in greater depth in chapter 13, but it is appropriate here to consider the impact of different debt to equity ratios on shareholders’ returns.
![]()
In figure 10.6, section A, we see a company for which the mix of funds has not yet been decided. It has assets of $100,000, sales of $120,000 and an operating profit of $15,000. The effects of different levels of gearing or leverage on the shareholders are illustrated in sections B and C. (Note: For simplicity, tax is ignored and the interest rate is set at 10 per cent.)
In section B, just one level of leverage is analyzed to show you how the figures work. Option 1 in the first row illustrates a situation with $100,000 equity and no debt. Accordingly there is no interest charge. The total profit of $15,000 is applied to the shareholders’ investment of $100,000. The ROE is 15 per cent.
In the second row, the funding mix has changed to $80,000 equity and $20,000 debt. The interest charge at 10 per cent is $2,000. This is deducted from the profit of $15,000 to leave $13,000 for the shareholders. Because the equity investment is now $80,000 the ROE is 16.25 per cent ($13,000/$80,000 × 100).
As a result of introducing 20 per cent debt into the company, the ROE has increased from 15 per cent to 16.25 per cent. This is financial leverage in action.
In section C, the leverage has been extended in steps all the way up to 90 per cent. With each additional slice of debt, the ROE increases until it reaches 60 per cent at the 90 per cent level of debt. Extraordinarily high levels of return can thus be achieved from very highly leveraged companies. The price that is paid for these high returns is the additional exposure to risk.
Summary
![]()
The debt/equity or leverage decision is one of great importance to management. There is a risk return trade-off. The impulse to achieve high returns for the shareholders must be restrained by the company’s risk profile. Even a very well managed company can suffer an unexpected deterioration in its financial position either from a default on the part of a major debtor or a general worsening of business conditions. Such a deterioration can be very difficult to recover from. It is prudent to keep some liquidity in reserve to guard against such an eventuality.
Figure 10.6 Effects of different levels of leverage
