Growth
Growth
Commerce defies every wind, outrides every tempest and invades every zone.
GEORGE BANCROFT (1800–1891)
Growth
![]()
Growth to a company is like medicine is to a patient – beneficial up to a certain level, but dangerous and possibly fatal when that level is exceeded. There is a need for balance between profits, assets and growth (see figure 14.1). Any imbalance between these factors will impact strongly on cash flow. Given the opportunities and corresponding dangers of growth, particularly in times of high inflation, it is wise to consider whether there is some way in which we can specify for a company what level of growth it can safely absorb. This chapter illustrates one particular method that many companies have found useful.
![]()
To assist in our analysis, we will take the case of the CABCO Construction company shown in figure 14.2. This is a company that is suffering from severe problems of growth.
We see that it has been growing, in terms of sales, at approximately 15 per cent per annum. However, it has a rapidly deteriorating financial position. The current ratio has dropped from 2.3 to 1.4 times over the four years and the debt to total assets ratio has risen from 37 per cent to 61 per cent over the same period. The liquidity ratios were very strong in 1997 but have sunk to their lowest acceptable level by 2001. The most worrying aspect of the case is the speed at which the liquidity position has deteriorated.
Performance, as measured by return on equity, was low but improved significantly in 2001. It made a passable return of almost 20 per cent before tax to its shareholders, but it is now close to a liquidity crisis. Accordingly, management must take urgent action to stop the downward trend and change the direction in which the company is going.
This chapter is concerned with the problem of identifying and quantifying the options open to management, but, more importantly, it will extract general rules relating to company growth and how it can be handled.
Figure 14.1 Growth and the need for balance

Figure 14.2 CABCO Construction Ltd – summary accounts for years 1997, 1999, 2001

![]()
In figure 14.3 the CABCO balance sheets for 1997 and 2001 are shown roughly to scale. The total assets of the 2001 balance sheet are 70 per cent greater than that for 1997. From the size of the individual balance sheet boxes we see that the major expansion is in both current assets and current liabilities. An explosion in the value of current assets has been financed almost entirely by an increase in current liabilities. Because of this the company has drifted from a strong liquidity base into an unstable, high-risk financial position. If the drift continues, bankruptcy is the likely result – or at least a change of ownership and control.
The immediate problem is an excess of short-term borrowings. They cannot be increased and, if possible, they should be reduced. Possible courses of action to which management has already given consideration are:
- reducing investment in current assets in absolute terms or at least as a proportion of sales
- introducing long-term funds in the form of loans or equity.
![]()
Because of industry custom and the situation of the business, management were of the opinion that current assets could not be reduced relative to sales, so attention was, therefore, concentrated on the possibility of finding additional long-term funds. The questions they had to answer were:
- ‘How much?’
- ‘What form – equity or loan?’
- ‘If loan, what term of years?’
When cash flow forecasts were produced, it quickly became evident that a long-term loan would not solve the problem as such borrowed money could not be repaid. Instead, more and more borrowings would be required because of the negative cash flow that this company generated each year. By negative cash flow is meant that sufficient funds are not being generated internally to fund the assets required by the operations.
Companies in such a heavily negative cash flow position have a form of financial diabetes. They have a perpetual cash haemorrhage because the values of certain operating parameters are out of balance. It is necessary to identify and quantify the factors behind this condition.
Figure 14.3 CABCO Construction Ltd – balance sheet movements over four years

Analysis
![]()
Figure 14.4 extracts some of the basic figures for 2001. The following are the critical values:
| Sales | $2,280 |
| Current assets | $1,521 |
| Retained earnings | $44 |
It will be shown that it is the interrelationships between these three values, combined with the company’s rate of growth that has given rise to its present financing problem. These three values, with a growth rate of 15 per cent collectively, give rise to a strong negative cash flow.
- The relationship of current assets to sales is 0.67
($1,521/$2,280): each $1 of sales requires 67¢ to carry it. For every increase of $1,000 sales next year, $670 of extra current assets will be needed. This will require $670 of extra funds in the balance sheet.* - The relationship of retained earnings to sales is 0.02
($44/$2,280): each $1 of sales generates 2¢ of retained earnings which goes into balance sheet funds. But each extra $1 sales requires 67¢. Therefore $33 of sales in any year are needed to fund $1 of extra sales the following year.*
This ratio of $1 extra sales for every $33 existing sales is the self-financing ratio and it gives a growth rate of 3 per cent. This rate of 3 per cent is the rate of growth in current assets the company can fund from its retained earnings. The company has been growing at 15 per cent over the last 4 years. The excess growth of 12 per cent has been funded by borrowing. In this company, all the borrowing has been short term, hence the financing problem.
Current sales are $2,280. If 12 per cent of this has to be funded externally next year at the rate of 67¢ for each $1 sale, the company will have to borrow an extra $180. The following year it will need to borrow $180 plus 15 per cent and so on, indefinitely.
There is a fundamental problem here that arises from the fact that the relationships identified above are out of balance. This problem is analyzed in the next section.
Figure 14.4 CABCO Construction Ltd – critical asset, profit and growth relationships

Growth equilibrium
We use the term ‘growth equilibrium’ to identify the rate of growth that a company can sustain from its operating cash flow. It means that cash is in equilibrium in the sense that it is driven neither into surplus nor deficit as a result of growth.
![]()
A growth equilibrium equation applicable to CABCO is given in figure 14.5. The values for ‘R’, ‘T’ and ‘G’ have been identified in figure 14.4 and these are combined together to produce the equilibrium factor ‘E’ (Section A).
When E = 1, cash flow is neutral; values greater than 1 indicate a positive cash flow and vice versa.*
The values for CABCO give a result of one over five, 20 per cent (Section B). This is the fraction of the growth that is self-funded. It tells us that 80 per cent is funded from outside sources. The heavy borrowing that the company has experienced derives from this fact.
The model has identified the three powerful cash flow drivers in this company:
- current assets to sales
- retained earnings to sales
- growth in sales.
The company requires very high levels of inventory and accounts receivable to support sales. As sales expand rapidly these do likewise, thereby creating a great demand for cash. Retained profits are not adequate to meet this need.
The model enables management to focus on the fundamental issues facing this company. These relate to profit, current assets and growth. Management must take steps to balance the relationship between these three so that the equilibrium value (‘E’) is increased from .02 up to 1.0.
Some scenarios are illustrated in figure 14.6.
Growth equilibrium – scenarios
As stated above, management can focus on the essential elements of the problem. The three variables must be brought into balance so that the resulting equilibrium value ‘E’ is increased to at least 1.0. This is the position where the company does not have to seek any further outside funds.
![]()
In figure 14.6 three single-value scenarios are worked out, one each for:
- Growth
- Retained profit
- The current assets/sales ratio.
Figure 14.5 CABCO Construction Ltd – growth equilibrium equation

Figure 14.6 CABCO Construction Ltd – growth equilibrium calculation

Each one shows the change in that variable alone that would be required to achieve equilibrium. It is not likely that any one of these in isolation would be the most practical solution. A strategy involving elements of all three would be more likely to bring results. The final combination strategy is shown as an illustration.
This version of the growth model is built up from the relationships that exist between current assets, retained earnings and growth in a particular company.
It gives valid results for a company in the situation of CABCO Construction Ltd. This company is heavily current-assets-based and very heavily borrowed. The version is also useful, with slight amendments, for trading companies and rapidly growing small businesses.
However for companies with a more regular asset structure and with normal debt potential, a model with a more general application is needed. Such a model is introduced in the next section.
General model of growth equilibrium
The model used in figures 14.5 and 14.6 suited the limited situation where the company was a low user of fixed assets and it was also very highly borrowed. The limitations of that first model were that:
![]()
- it looked at current assets only rather than total assets
- it ignored the fact that most companies can supplement retained earnings with funds from other sources.
Figure 14.7 illustrates the changes that are required in order to make the model more generally applicable.
First: include all the assets in the balance sheet that will be affected by growth.
Second: allow for funding by a mix of both loans and equity. Each $1 of retained earnings will support borrowings in proportion to target D/E.
These steps are illustrated in figure 14.7.
Section A: Current assets only are included in the model.
Section B: Fixed assets are taken into account.
Section C: LTL and CL are removed on the other side to leave that section of the balance sheet called OF (owners’ funds).
![]()
The final growth equilibrium equation (RE/OF) in figure 14.7 tells us that the self-funding rate of growth for a company is calculated by expressing the retained earnings as a percentage of owners’ funds (using the opening balance sheet for the period). Growth in excess of this rate will require extra equity or will cause a weakening in ratios.
Figure 14.7 Adjustments to growth equilibrium model

![]()
The assumptions that lie behind this formula are important. They are that growth in sales will be matched exactly by growth in both current and fixed assets. It is further assumed that profits, interest, tax and dividends will grow likewise. Finally, it is assumed that a constant debt to equity ratio will apply.
![]()
It is not necessary to emphasize that a company cannot be managed by formulae. What formulae can do, however, is provide a shorthand approach that will quickly identify potential problems.
Self-funding growth – international standards
![]()
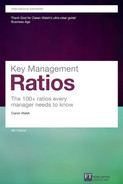
Figure 14.8 shows two charts relating to the international scene.
Chart A is derived from research done with top UK companies in 2000, and chart B relates to research on international companies.
Both indicate that large international companies have sustainable growth rates of between 10 and 20 per cent, except Japan with approximately 7 per cent. These are all very high numbers. With inflation as low as 3 to 4 per cent it suggests that they have the capacity to expand in real terms at well over 8 per cent. If their actual growth is less then they will simply accumulate cash in the balance sheet.
Given that the developed economies, in stable times over the long term, grow at 4 per cent maximum, these companies are significantly outgrowing the economy. One can see why so many of them are involved in takeover activity. We have seen that these companies are also very profitable and many of them find it difficult to acquire companies that will not dilute their profit performance.
Some have found another outlet for surplus cash which is to buy back their own shares in the marketplace. This is a phenomenon that can now be observed with many large profitable companies.
Application to acquisitions
Many groups acquire fast-growing businesses in order to sustain or enhance the growth rate of the parent. The cash flow characteristics of such acquisitions are of crucial importance.
A company that has heavy asset requirements, and that grows rapidly, will need substantial funds to keep its balance sheet in good condition. If the company is very profitable, these funds may be generated internally. However, if it has only medium or low profits, then funds will have to be provided by the parent company. The total cost of such a company over a number of years could be many times its original purchase price.
Figure 14.8 Self-funding growth rate (%)

![]()
The most valuable business to own or buy is one with high growth and high profits. The least valuable one is not a low growth, low profit company. Such a company is not worth very much, but it is not dangerous. The worst company is one with high growth and low profits. If such a company also has a high asset to sales ratio, then it has, within itself, all the makings of a financial disaster.
* In figure 14.4, we use the symbol ‘T’ to denote the first ratio, ‘R’ the second and ‘G’ the growth percentage.
* Many readers will have valid questions at this stage about the underlying assumptions in the model. However, this is an early and primitive, but useful, version of a more generalized growth model that will be developed later in the chapter.