There are several third-party plugins listed in the official Chart.js documentation, and one of them, called chartjs-plugin-style, adds a few styling options for charts; these options include bevels, shadows, and glows. To use it, you can install the plugin via npm or download the JavaScript file from nagix.github.io/chartjs-plugin-style that can be imported on to your page:
<script src="../JavaScript/chartjs-plugin-style.min.js"></script>
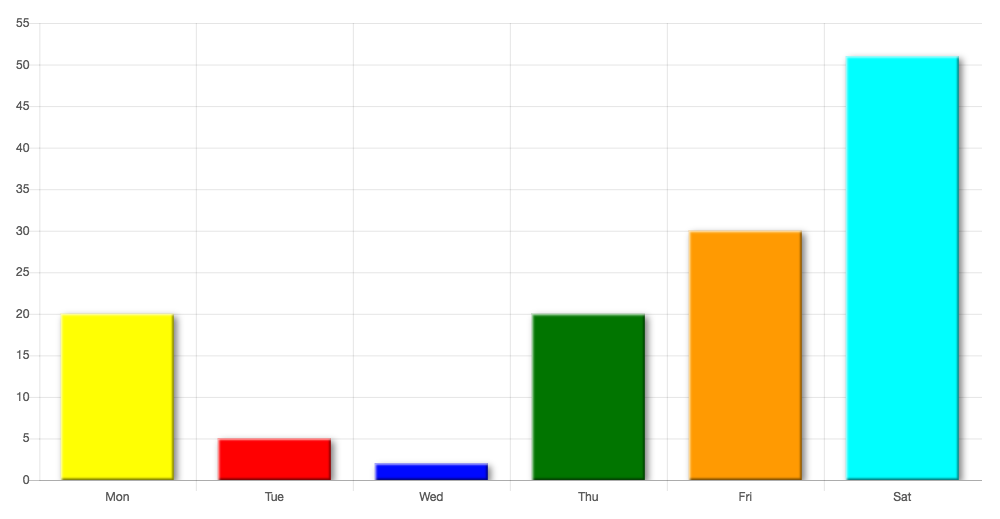
Now you can use new properties in your datasets to add bevels, shadows, and glows. The following example configures bevels and adds shadows to a simple bar chart. The names of the properties should be self-explanatory:
const data = {
    labels: ["Mon", "Tue", "Wed", "Thu", "Fri", "Sat"],
    datasets: [
        {
            label: 'Week 1',
            data: [20, 5, 2, 20, 30, 51],
            backgroundColor: ['yellow','red','blue','green','orange',
            'cyan'],
            bevelWidth: 3,
            bevelHighlightColor: 'rgba(255, 255, 255, 0.75)',
            bevelShadowColor: 'rgba(0, 0, 0, 0.5)',
            shadowOffsetX: 5,
            shadowOffsetY: 5,
            shadowBlur: 10,
            shadowColor: 'rgba(0, 0, 0, 0.5)',
        }
    ]
};

new Chart('canvas', { type: 'bar', data: data,
                      options: {legend: {display: false}} });
The final result is shown next. You can also mix it with generated colors, palette functions, and patterns. Try it out with different types of charts! The code is in Colors/colors-6-shadows.html: