- Microservices: Building Scalable Software
- Table of Contents
- Microservices: Building Scalable Software
- Microservices: Building Scalable Software
- Credits
- Preface
- 1. Module 1
- 1. A Solution Approach
- Evolution of µServices
- Monolithic architecture overview
- Limitation of monolithic architecture versus its solution with µServices
- Summary
- 2. Setting Up the Development Environment
- 3. Domain-Driven Design
- 4. Implementing a Microservice
- 5. Deployment and Testing
- 6. Securing Microservices
- 7. Consuming Services Using a Microservice Web App
- 8. Best Practices and Common Principles
- Overview and mindset
- Best practices and principals
- Microservices frameworks and tools
- Netflix Open Source Software (OSS)
- Build – Nebula
- Deployment and delivery – Spinnaker with Aminator
- Service registration and discovery – Eureka
- Service communication – Ribbon
- Circuit breaker – Hystrix
- Edge (proxy) server – Zuul
- Operational monitoring – Atlas
- Reliability monitoring service – Simian Army
- AWS resource monitoring – Edda
- On-host performance monitoring – Vector
- Distributed configuration management – Archaius
- Scheduler for Apache Mesos – Fenzo
- Cost and cloud utilization – Ice
- Other security tools – Scumblr and FIDO
- Netflix Open Source Software (OSS)
- References
- Summary
- 9. Troubleshooting Guide
- 1. A Solution Approach
- 2. Module 2
- 1. Demystifying Microservices
- The evolution of microservices
- What are microservices?
- Microservices – the honeycomb analogy
- Principles of microservices
- Characteristics of microservices
- Microservices examples
- Microservices benefits
- Supports polyglot architecture
- Enabling experimentation and innovation
- Elastically and selectively scalable
- Allowing substitution
- Enabling to build organic systems
- Helping reducing technology debt
- Allowing the coexistence of different versions
- Supporting the building of self-organizing systems
- Supporting event-driven architecture
- Enabling DevOps
- Relationship with other architecture styles
- Relations with SOA
- Relations with Twelve-Factor apps
- A single code base
- Bundling dependencies
- Externalizing configurations
- Backing services are addressable
- Isolation between build, release, and run
- Stateless, shared nothing processes
- Exposing services through port bindings
- Concurrency to scale out
- Disposability with minimal overhead
- Development and production parity
- Externalizing logs
- Package admin processes
- Microservice use cases
- Summary
- 2. Building Microservices with Spring Boot
- Setting up a development environment
- Developing a RESTful service – the legacy approach
- Moving from traditional web applications to microservices
- Using Spring Boot to build RESTful microservices
- Getting started with Spring Boot
- Developing the Spring Boot microservice using the CLI
- Developing the Spring Boot Java microservice using STS
- Developing the Spring Boot microservice using Spring Initializr – the HATEOAS example
- What's next?
- The Spring Boot configuration
- Changing the default embedded web server
- Implementing Spring Boot security
- Enabling cross-origin access for microservices
- Implementing Spring Boot messaging
- Developing a comprehensive microservice example
- Spring Boot actuators
- Configuring application information
- Adding a custom health module
- Documenting microservices
- Summary
- 3. Applying Microservices Concepts
- Patterns and common design decisions
- Establishing appropriate microservice boundaries
- Designing communication styles
- Orchestration of microservices
- How many endpoints in a microservice?
- One microservice per VM or multiple?
- Rules engine – shared or embedded?
- Role of BPM and workflows
- Can microservices share data stores?
- Setting up transaction boundaries
- Service endpoint design consideration
- Handling shared libraries
- User interfaces in microservices
- Use of API gateways in microservices
- Use of ESB and iPaaS with microservices
- Service versioning considerations
- Design for cross origin
- Handling shared reference data
- Microservices and bulk operations
- Microservices challenges
- The microservices capability model
- Summary
- Patterns and common design decisions
- 4. Microservices Evolution – A Case Study
- Reviewing the microservices capability model
- Understanding the PSS application
- Death of the monolith
- Microservices to the rescue
- The business case
- Plan the evolution
- Migrate modules only if required
- Target architecture
- Target implementation view
- Summary
- 5. Scaling Microservices with Spring Cloud
- Reviewing microservices capabilities
- Reviewing BrownField's PSS implementation
- What is Spring Cloud?
- Setting up the environment for BrownField PSS
- Spring Cloud Config
- What's next?
- Setting up the Config server
- Understanding the Config server URL
- Handling configuration changes
- Spring Cloud Bus for propagating configuration changes
- Setting up high availability for the Config server
- Monitoring the Config server health
- Config server for configuration files
- Completing changes to use the Config server
- Feign as a declarative REST client
- Ribbon for load balancing
- Eureka for registration and discovery
- Zuul proxy as the API gateway
- Streams for reactive microservices
- Summarizing the BrownField PSS architecture
- Summary
- 6. Autoscaling Microservices
- 7. Logging and Monitoring Microservices
- 8. Containerizing Microservices with Docker
- Reviewing the microservice capability model
- Understanding the gaps in BrownField PSS microservices
- What are containers?
- The difference between VMs and containers
- The benefits of containers
- Microservices and containers
- Introduction to Docker
- Deploying microservices in Docker
- Running RabbitMQ on Docker
- Using the Docker registry
- Microservices on the cloud
- Running BrownField services on EC2
- Updating the life cycle manager
- The future of containerization – unikernels and hardened security
- Summary
- 9. Managing Dockerized Microservices with Mesos and Marathon
- Reviewing the microservice capability model
- The missing pieces
- Why cluster management is important
- What does cluster management do?
- Relationship with microservices
- Relationship with virtualization
- Cluster management solutions
- Cluster management with Mesos and Marathon
- Implementing Mesos and Marathon for BrownField microservices
- A place for the life cycle manager
- The technology metamodel
- Summary
- 10. The Microservices Development Life Cycle
- Reviewing the microservice capability model
- The new mantra of lean IT – DevOps
- Meeting the trio – microservices, DevOps, and cloud
- Practice points for microservices development
- Understanding business motivation and value
- Changing the mindset from project to product development
- Choosing a development philosophy
- Using the concept of Minimum Viable Product
- Overcoming the legacy hotspot
- Addressing challenges around databases
- Establishing self-organizing teams
- Building a self-service cloud
- Building a microservices ecosystem
- Defining a DevOps-style microservice life cycle process
- Automating the continuous delivery pipeline
- Development
- Continuous integration
- Automated testing
- Different candidate tests for automation
- Automated sanity tests
- Regression testing
- Automated functional testing
- Automated acceptance testing
- Performance testing
- Real user flow simulation or journey testing
- Automated security testing
- Exploratory testing
- A/B testing, canary testing, and blue-green deployments
- Other nonfunctional tests
- Testing in production
- Antifragility testing
- Target test environments
- Different candidate tests for automation
- Continuous deployment
- Monitoring and feedback
- Automated configuration management
- Microservices development governance, reference architectures, and libraries
- Summary
- 1. Demystifying Microservices
- 3. Module 3
- 1. Microservices Architecture
- 2. Microservices in Node.js – Seneca and PM2 Alternatives
- 3. From the Monolith to Microservices
- 4. Writing Your First Microservice in Node.js
- 5. Security and Traceability
- 6. Testing and Documenting Node.js Microservices
- 7. Monitoring Microservices
- 8. Deploying Microservices
- A. Bibliography
- Index
Debugging a Node.js application is very similar to debugging any other application. IDEs like WebStorm or IntelliJ provide a traditional debugger where you can install breakpoints and stop the execution whenever the application hits the given line.
This is perfect if you buy a license for one of the IDEs, but there is a free alternative that will have a very similiar result for the users of Google Chrome, node-inspector.
Node-inspector is an npm package that pretty much enables the Chrome debugger to debug Node.js applications.
Let's see how it works:
- First of all, we need to install node-inspector:
npm install –g node-inspectorThis should add a command to our system called
node-inspector. If we execute it, we get the following output:
That means our debug server has started.
- Now we need to run a node application with a special flag to indicate that it needs to be debugged.
Let's take a simple Seneca act as an example:
var seneca = require( 'seneca' )() seneca.add({role: 'math', cmd: 'sum'}, function (msg, respond) { var sum = msg.left + msg.right respond(null, {answer: sum}) }) seneca.add({role: 'math', cmd: 'product'}, function (msg, respond) { var product = msg.left * msg.right respond( null, { answer: product } ) }) seneca.act({role: 'math', cmd: 'sum', left: 1, right: 2}, console.log) seneca.act({role: 'math', cmd: 'product', left: 3, right: 4}, console.log) - Now, in order to run it on the debug mode, execute the following command:
node index.js --debug-brkThe way to access the debugger is through the URL
http://127.0.0.1:8080/?port=5858:
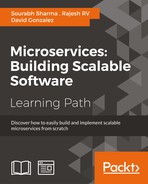
I am sure this image is very familiar to every developer in the world: it is the Chrome debugger showing our code. As you can see in the first line, the one highlighted in blue, the application stopped in the first instruction so that we can place the breakpoints by clicking the line numbers, as shown in the following image:

As you can see in the preceding image, we have installed a breakpoint in line 9. Now we can use the control panel to navigate through the code and values of our variables:

The controls on the top speak for themselves if you ever debugged an application:
- The first button is called play and it allows the application to run to the next breakpoint
- Step over executes the next line in the current file
- Step into goes into the next line, getting deeper in the call stack so that we can see the call hierarchy
- Step out is the reverse of step into
- Disable breakpoints will prevent the program from stopping at the breakpoints
- Pause on exceptions, as its name indicates, will cause the program to stop on exceptions (it is very useful when trying to catch errors)
If we click on play, we can see how the script will stop in line 9 in the following image:

As a good debugger, it will let us inspect the value of our variables by hovering the cursor over the variable name.
-
No Comment