
The Lissajous figures are determined by four parameters: A, B, a, and b. Let's set A and B to 1 for simplicity:
- Initialize
twith thelinspace()function from-pitopiwith201points:a = 9 b = 8 t = np.linspace(-np.pi, np.pi, 201)
- Calculate
xwith thesin()function andnp.pi:x = np.sin(a * t + np.pi/2)
- Calculate
ywith thesin()function:y = np.sin(b * t)
- Plot as shown in the following:
plt.plot(x, y) plt.title('Lissajous curves') plt.grid() plt.show()The result for
a=9andb=8is as follows: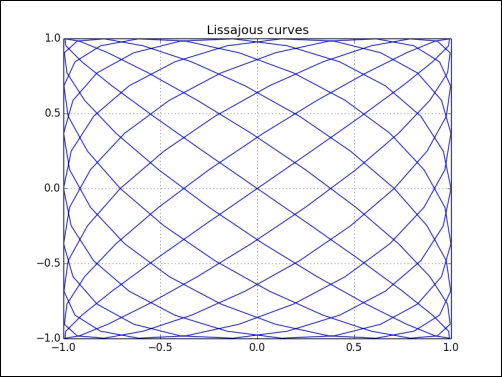
We plotted the Lissajous curve with the aforementioned parametric equations where A=B=1, a=9, and b=8. We used the sin() and linspace() functions, as well as the NumPy pi constant (see lissajous.py):
import numpy as np
import matplotlib.pyplot as plt
a = 9
b = 8
t = np.linspace(-np.pi, np.pi, 201)
x = np.sin(a * t + np.pi/2)
y = np.sin(b * t)
plt.plot(x, y)
plt.title('Lissajous curves')
plt.grid()
plt.show()..................Content has been hidden....................
You can't read the all page of ebook, please click here login for view all page.