
Chapter 9
Program Management Tools
Program management tools support the practices and various processes used to effectively manage a program. They are enabling devices for the primary players on a program—the program manager, the project managers, the executive leadership team, and the governance body.
The tools presented in this chapter do not represent a comprehensive suite of program management tools. Rather, they are a key subset of tools we have found to be most impactful and widely implemented within best practice organizations. These tools are both strategic and operational in nature and include:
- The Benefits Map
- Program-level Work Breakdown Structure
- The Program Map
- Complexity Assessment
- The P-I Matrix
- The Program Strike Zone
- Indicators and Dashboards
When used properly, program management tools are a useful aid for decision making. Each of the tools presented provides important information needed to make critical program-related decisions by the primary program management players identified above. Their function is to help establish and maintain alignment between business strategy and program execution, and to facilitate effective program execution in order to realize the business benefits intended.
The Benefits Map
Business benefits are the outcomes of a program that provide value to the organization in return for the investment made in the program. The benefits map documents the expected benefits that are to be realized from the investment. It specifically charts the path from the organization's business strategy to the distinct benefits that are to be derived from the output of a program and each of its constituent projects.1 The information provided by the benefits map supports the cost/benefit analysis for a program and should become part of the program business case.
Tool Description
The benefits map can be depicted in visual form to provide a useful means to demonstrate alignment of project deliverables, to program objectives, to the business success factors for a program, to the expected business results as displayed in Figure 9.1.
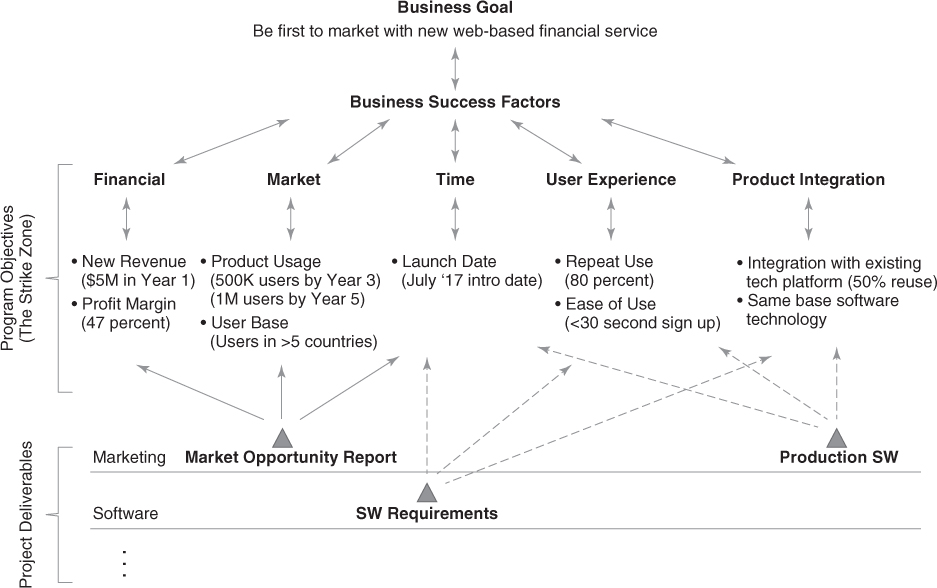
Figure 9.1 Example of program benefits map.
As demonstrated in the figure, the benefits map provides traceability between project outcomes and deliverables to the benefits intended from the output of the program. This is critical information to first establish the overall vision and scope for a program, then communicate how each of the constituent projects contribute to the goals of a program, and finally trace the execution of the program and projects to final delivery of business benefits.
Like many program-based tools, this tool is used to assist in characterizing how specific program objectives are met. However, benefits maps can become complex and confusing due to the one-to-many relationships between project deliverables and outcomes to the program objectives. The critical component in building an effective benefits map is to ensure each project deliverable or outcome is mapped to a program objective, and every objective to the business success factors. For more complex programs, it is recommended that the mapping be performed and represented in tablature form to establish order, reduce confusion, and maintain greater value than effort in creating the map.
Utilizing the Tool
Along with the program work breakdown structure and the program architecture, the benefits map is a useful tool for establishing the overall scope of a program and for demonstrating the alignment between project outcomes and deliverables to the objectives of a program. The benefits map can also be used to communicate to senior leaders, the overall program team, and other program stakeholders how the strategy of the organization and program are melded together, and how each program benefit will be realized.
The benefits map is intended to be used throughout the life of the program to analyze consequences caused by adjustments and changes as they occur to the original program vision and scope. The first use of the benefits map normally occurs as part of the business case development process where a high-level mapping of benefits to program objectives to strategic intent is established. Further detail is then added during detailed planning when the full comprehension of program scope and traceability of project outcomes to business benefits is necessary.
In organizations with established governance policies and a set of related processes, the benefits map is often used as one of their key monitoring and tracking devices for the program.
Benefits of Use
There are several advantages to be gained by both senior management of an organization and the program team through the use of the benefits map. It helps to create better clarification and understanding of the program vision and scope, and establishes direct alignment between program objectives, project outcomes, and the business benefits to be realized.
The benefits map also provides a systematic process to assess program benefits as part of the program's cost/benefit analysis, which is a critical element of the business case of a program.
Finally, it enables focused tracking and monitoring of progress toward realization of the benefits as part of the program governance process, and establishes an effective means for evaluating success of a program from a benefits realization perspective.
Program-Level Work Breakdown Structure
The purpose of the Program-level Work Breakdown Structure (PWBS) is to translate the elements of the whole solution being created and delivered by the program into tangible work outcomes. It is a comprehensive characterization of program scope, including scope of the constituent projects.
It specifies what is to be done, not how or when. If something is not included in the PWBS, it is not needed to achieve the business results desired and therefore should not be included as part of the program effort.
Tool Description
The PWBS is one of three key elements of program management that determines the total scope of the program. The other two elements are the program architecture and the benefits map.
Normally, a PWBS consists of three or four levels of detail as illustrated in Figure 9.2. Level one describes the whole solution, which the program is chartered to create. Level two identifies the physical and nonphysical elements documented in the whole solution. Most often this level identifies the projects and project enablers that make up the program. The information for level two is derived directly from the program architecture. Levels three and four display the deliverables or outcomes that result from the work of the projects and enabling representatives involved on the program. Project deliverables constitute tangible work output (final evaluation report), whereas a project outcome identifies the completion of work (evaluation complete). The deliverables and outcomes defined by the PWBS form the basis of the deliverables and outcomes used in the benefits map (Figure 9.1).

Figure 9.2 Example of a PWBS.
Just like the project-level WBS, the PWBS does not include the element of time or sequencing of activities. It simply focuses on the identification of the deliverables and outcomes generated by the projects and functional enablers.
Utilizing the Tool
The PWBS is used to decompose the program's output into more manageable components that will serve as the starting point for developing the work breakdown structures for each of the projects within the program. It is normally first established as part of the detailed scope definition, but after the program architecture has been established.
As demonstrated in Figure 9.2, different branches of the PWBS may have varying degrees of detail. That is, greater depth of deliverables may be required for some projects as compared to others. Complexity of the program and each of its projects is the determining factor on the appropriate level of work decomposition.
A common error that occurs when developing a PWBS is mixing both deliverables and tasks. A PWBS should only include deliverables or work outcomes, not tasks. The PWBS does not eliminate the need for a detailed work breakdown structure for each of the constituent projects on the program. In practice, both are required.
Most program teams find that the PWBS is a useful tool to be used between the program manager and the project managers for coordination, communication, problem resolution, and ensuring that all activities are identified and synchronized as planned. It is particularly helpful during conversation regarding interfaces between projects and other internal and external functions involved with program mapping.
Benefits of Use
The PWBS is a critical tool for properly defining the scope of a program and for managing program complexity. The tool offers two key advantages to the program manager. It comprehensively characterizes the total scope of the program, and provides the starting point for the project managers on the program to prepare their individual project work breakdown structures.
The PWBS also establishes the foundation for mapping the interdependencies between the project teams within a program, and serves as an aid in communication and coordination of deliverables and outcomes between the program manager and other members of the integrated program team.
The Program Map
The program manager is responsible for managing the interfaces between the projects within a program. The program map is an essential program management tool that helps the program manager (and project teams) visualize the interfaces over the life of a program.
Its purpose is to identify critical cross-project interdependencies with respect to deliverables and time. The crux of the program map is to show the big picture view of the cross-project deliverables and help the program manager and program team fully understand the dependencies that exist on the program.
Tool Description
The structure of the program map, as well as the deliverables for each project, is derived directly from the PWBS described earlier. This forms a tight connection between the program architecture, PWBS, and the program map.
Each deliverable or outcome identified in the PWBS is displayed on the program map in the correct sequence and point in time. The use of arrows between deliverables depicts the interdependencies between the project teams and their respective deliverables. A simple example of a program map is illustrated in Figure 9.3.

Figure 9.3 Example of program map.
In this example, “Pwr Contl SW” is a deliverable generated by the software development project team that is “delivered” to the enclosure project team for the development of the enclosure. In turn, the “Enclosure Design Files” deliverable is generated by the enclosure project team and delivered to the manufacturing project team. This mapping of deliverables shows the critical interdependency between the software, enclosure, and manufacturing project teams of the program.
The criticality of the interdependencies between the project teams on a program is easily demonstrated with this tool. In the above example, failure to complete any of the deliverables on the part of the software or enclosure project teams will have a devastating effect on the work of the manufacturing team. In fact, it will have a devastating effect on the entire program, thus the need to visualize the interdependency of deliverables on a program.
Utilizing the Tool
For any program—small, medium, or very large—the program map is highly recommended to fully understand the deliverables and interdependencies between the project teams on the program. The best time to create the program map is during the beginning of the planning cycle, but only after the program scope and requirements have been defined. A work session (or workshop) approach for creating the program map yields an information-rich exchange, cross-project discussion, face-to-face interactions, and reciprocal iterations that have no equal when it comes to developing a quality program map.
If the facilitated approach is used to develop the map, one work day is a typical time duration, although very large programs can take multiple days. If a cross-project work session is not used, it is recommended that a full work week be allotted to complete a program map for small to medium-sized programs, and multiple work weeks for large programs.
It is important to note that a key input to the program mapping exercise is the program decision points that are identified as part of the program governance system. Once the dates for the program decision points are identified, they become the guiding schedule constraints for the mapping process. A word of caution to the program manager: even though a timeline is developed as an outcome of the program mapping exercise, this timeline should not be taken as the program schedule. A more detailed analysis of risks, resources, and budget is required before creating the program schedule. The program map simply serves as a sequence of events over time, not the actual schedule.
Benefits of Use
As stated previously, the program map helps the program manager and program team fully understand the dependencies that exist on the program. Use of the tool also offers the following benefits:
- It provides clarity and visibility to the program manager and team for the critical cross-project interdependencies that must be managed.
- It provides an integrated display of the planned deliverables and work outcomes of all project teams within the program.
- It provides a high level view of program execution.
- It serves as the basis for developing a program timeline.
Due to the necessary investment of time and program resources to develop a program map, the program manager must decide when sufficient information is available and reasonably stable to create the map. This will minimize the number of iterations of the map.
Program Complexity Assessment
Complexity is an attribute of all programs. Designs have become more complex as features and integrated capabilities increase; the process to develop and manufacture the solutions is requiring more partners, suppliers, and others throughout the value chain; the ability to integrate multiple technologies with end user wants requires not only accuracy regarding requirements delivery, but also requires speed and agility to change; and the current global, highly distributed business environment requires work to occur in multiple sites across multiple time zones. Therefore, the ability to characterize and profile the degree of complexity associated with a program has become essential for both executive leaders and their program managers.
The information gained from the use of a complexity assessment tool helps to balance the portfolio of programs from a complexity perspective. Further, it aids in the determination of the skill set and experience level required of the program team; it guides the implementation of key program processes such as change management, risk management, and contingency reserve determination; and it helps the program manager adapt his or her management style relative to the level of complexity of the program.
Tool Description
The structure of the program complexity assessment features several parts. First, the tool includes various dimensions as defined by a business. Each dimension of complexity is assessed on an anchor scale (second part), and when the complexity scores of each dimension are connected, a line called the complexity profile (third part) is obtained. The complexity profile is a graphical representation of a program's multifaceted complexity. An example of a program complexity assessment is illustrated in Figure 9.4.

Figure 9.4 Example of program complexity assessment.
Every industry has discrete characteristics, every business within an industry is unique, and every program within a business has unique attributes. This means that a firm has to customize the complexity assessment tool for its use.2 Program managers often start this work by determining the complexity dimensions that are specific to the organization. For example, technical complexity may be directly related to the technical aspect of the product, service, or other capability under development, or from the knowledge and capability of the existing resources of the firm. Structural complexity also has a number of subfactors that involve the organizational elements of a firm. Business complexity involves the business environment in which the firm operates.
Examples of variations in dimensions with respect to technical, structural, and business complexity are shown in Table 9.1.
Table 9.1 Example technical, structural, and business complexity dimensions
| Technical Complexity | |
| Low Complexity | High Complexity |
| Feature upgrade to an existing product | New product architecture and platform design |
| Development of a single module of a system | Development of a full system |
| Use of existing and developed technologies | Use of new and undeveloped technologies |
| Structural Complexity | |
| Low Complexity | High Complexity |
| Team is co-located | Team is a virtual team |
| Mature processes and practices | Ad hoc processes and practices |
| High performing team | Low level of team cohesion |
| Single-site development | Multi-site development |
| Single-geography development | Multi-geography development |
| Single-cultural team | Multi-cultural team |
| Single-company development | Multi-company development |
| Business Complexity | |
| Low Complexity | High Complexity |
| Selling into traditional and mature markets | Selling into new and emerging markets |
| Receptive customers and/or stakeholders | Unreceptive customers and/or stakeholders |
| Flexible time-to-money requirements | Aggressive time-to-money requirements |
| Existing end-user usage models | New end-user usage models |
Utilizing the Tool
Typically, the program complexity assessment tool is prepared during the program definition and planning work cycles—that is, very early in the program. However, this tool should be used dynamically and updated periodically in high-velocity environments where the program scope and business climate may frequently change. It is advantageous if the senior management team of an organization that manages the portfolio of programs uses this tool to approve the overall level of complexity for each program as it may directly influence their decisions on the skill level and experience of personnel required for each of their programs.
As stated earlier, each organization should create a customized version of the assessment tool that is specific to the complexity dimensions they are dealing with. Once the complexity dimensions are identified, each dimension is then assessed based upon the scale established. For example, in Figure 9.4, speed to market is assessed as a level-2 complexity (fast and competitive). Once all complexity dimensions are assessed, connect the obtained scores for each dimension to produce the complexity profile that helps to visually depict the overall program complexity. The profile in Figure 9.4, for instance, indicates that the program is of medium complexity, with all dimensions at levels 2 and 3, except team members who are experienced (the least complex) and a globally distributed team (the most complex).
The senior management team and program manager can quickly get a feel for the level of complexity of each program within the organization. However, care should be taken to prevent the inclusion of too many complexity dimensions. In this case, the simpler the structure of the tool, the more effective its use will be.
Benefits of Use
The program complexity assessment tool's value is multifold. First, knowing the program complexity helps balance the portfolio of programs with an appropriate mix of low-, medium-, and high-complexity programs (investments). Further, the complexity assessment aids in the planning process, indicating how to adapt one's management style to the level of complexity of the program.
The program complexity assessment tool also helps the senior management team determine the level of skill and experience needed, thus aiding in the selection of the program manager and the key leadership positions on the team to successfully define and execute the program. Additionally, the tool may influence how much contingency buffer to build into the program budget and schedule—the more complex the program, the bigger the buffer. Finally, the tool can help identify the categories of risk and the level of robustness you will need in your risk management plan.
The P-I Matrix
The P-I (Probability-Impact) matrix is a tool used to identify program risks, assess their probability and potential impact, and to provide a representation of risk severity to facilitate effective risk-based planning and decision making.3 The P-I matrix is used by the program manager as part of the risk management process and practices discussed in Chapter 7 for managing program risk throughout the life of the program.
Tool Description
The P-I matrix is normally presented in a matrix format with the vertical axis reflecting the probability of a risk event occurring and the horizontal axis displaying the projected impact if the risk event occurs. The higher an identified program risk is on the probability axis and the further to the right on the horizontal axis, the greater the severity of risk to the program.
The values for probability range from very unlikely (1) to nearly certain to occur (5), while the values for impact range from very low (1) to very high (5).4 The position of a program risk on the matrix determines its estimated severity value through the sum of the combined values assigned for its probability and impact. Figure 9.5 illustrates an example P-I matrix.

Figure 9.5 Example of P-I Matrix with low, medium, and high severity.
The matrix is usually divided into red, yellow, and green zones, which represent high-, medium-, and low-severity risks respectively, based on the organization's thresholds for risk severity. The position of a risk in the matrix determines its ranking or severity. The higher the value of a square, the higher its rank and the more severe its potential impact to the program. To be effective, the matrix must be realistic (as to the severity of the risk), timely, and brought to life by the joint effort of the program and project managers who own the P-I matrix.
Utilizing the Tool
One of the challenges for a program manager is to identify the risk events that have both the highest impact on the program and those that are most likely to occur. Therefore, the impact, probability, and severity of each program-level risk need to be analyzed. In this assessment, we tend to use a numeric probability scale. For example, on a five-level scale, the ratings are 1 = very unlikely, 2 = low likelihood, 3 = likely, 4 = highly likely, and 5 = nearly certain. Consequently, one will qualitatively assess each risk's probability of occurrence. When this is completed, the next step is to assess the potential impact of each risk, again on a discrete scale. For example, a scale rating such as 1 = very low, 2 = low, 3 = medium, 4 = high, and 5 = very high may be used. To illustrate, let's assume a risk that will be assessed as having a program schedule slip impact. The scale can define the levels of impact, as shown in Table 9.2.
Table 9.2 Example five-level scale of risk impact on schedule
| Scale | 1 | 2 | 3 | 4 | 5 |
| Very low | Low | Medium | High | Very high | |
| Risk Impact on Schedule | Slight Schedule Delay | Overall Program delay 5 % | Overall program delay 5–14% | Overall program delay 15–25% | Overall program delay >25% |
After all program-level risks are assessed in this manner, a formula can be used to combine the probability and impact of each risk to establish a measure of severity. Although nonlinear formulas can be employed, linear formulas such as severity = [(probability + N) × impact] are easier to apply. For example, N can be equal to two, meaning that impact is twice as important as probability in establishing risk severity. In this case, the assessed probability and impact for each risk would be entered in the formula, severity = [(probability + 2) × impact], and the obtained value would be entered into the P-I matrix. This is the formula utilized for the risk severity calculations in Figure 9.5.
Some larger programs commonly focus on the top ten highest-ranked risks. In contrast, some smaller programs decide to manage the top three risks, arguing the lack of resources prohibit taking on a larger number of risks. Both approaches are dangerous. So, what is a reasonable way out? The answer is in the P-I matrix—respond to the highest-ranked risks in the matrix, down to an agreed upon severity level.5 For example, focus on handling risks down to risk score of 11 (see Figure 9.5) and treat other risks as noncritical. With this approach, one neither squanders resources nor disregards significant risks. It should be noted that noncritical does not mean not important. Rather, it means that scarce program resources are not immediately needed to address the risk event but may be needed in the future.
It is important to keep in mind that program planning and execution tools and the information and analysis derived are not static. The environment during the time span of a program is constantly changing as is the risk associated with a program. Therefore risk must be constantly evaluated.
Benefits of Use
The P-I matrix helps sift through the myriad of uncertainties to pinpoint and highlight the program areas of highest risk—both before work has begun and throughout the life of a program.6 This offers an opportunity to focus program resources and to identify effective ways of reducing risk events in a proactive manner, rather than being confronted by them if they turn into problems later in the program. In addition, the matrix generates information for more reasonable contingency planning and effective program decision-making (Chapter 7).
It is impossible to predict all possible risk events. Therefore, best practice organizations include the use of schedule and budget contingency based upon a risk analysis. The amount of contingency can be derived from risk impact information contained in the P-I matrix.
The Program Strike Zone
The program strike zone is used to identify the critical business success factors for a program, to help a program manager and his or her executive management team track progress toward achievement of the key business results anticipated, and to set the boundaries within which a program manager and team can operate without direct management involvement. The program strike zone name is analogous to a baseball pitcher seeking the “sweet spot” for throwing a successful strike. In the business world, the program manager is attempting to hit the sweet spot of business success through successful delivery of a program's output capability.
The tool fosters a “no surprises to management” philosophy and behavior by increasing the flow of relevant information between the program team and executive management. This assists in providing an efficient means for elevating critical issues and barriers outside the span of control of the program manager for decision making and resolution by senior management. Additionally, the program strike zone provides a mechanism for stopping a program if it is no longer aligned to the objectives of the company.
Tool Description
The program strike zone is an effective tool for ensuring the program is planned with the correct set of success criteria, and that the program stays within the success criteria boundaries throughout the life of a program.
As shown in Figure 9.6, elements of the program strike zone include the critical business success criteria for the program, target and control (threshold) values, and a high-level status indicator. Some organizations also include an “actual” element that provides indication of where a program is operating with respect to the target and threshold limits.

Figure 9.6 Example of program strike zone.
The business success factors will be unique to every organization, and are derived directly from strategic management and portfolio management processes (Chapter 3). The strike zone is most effective when the business success factors identified are kept to a critical few (usually 5–6), as this focuses the program and senior management's attention on the highest priority contributors to the success of the program.
The threshold limits are negotiated values between the program manager and the executive sponsor. They establish the empowerment boundaries within which a program team is free to operate without senior management intervention.7
The status indicators give a high-level indication of how the program is operating within the target and threshold values. A green status indicator signifies progress is as planned, yellow status indicates a “heads-up” to management of a potential problem, and red requires management intervention in order to proceed.
Utilizing the Tool
The program strike zone provides many uses to program managers, the executive sponsor of a program, and to the program governance body. Program managers use it to formalize the critical business success factors for the program, to negotiate and establish the team's empowerment boundaries with executive management, to communicate overall program progress and success, and to facilitate various trade-off decisions throughout the program cycle.
Executive managers use the program strike zone to ensure that a new program's definition supports the intended business objectives, and to establish control limits in order to ensure that the program team's capabilities are in balance with the complexity of the program. When used properly, it provides senior managers a forward-looking view of program alignment to the business objectives. When problems are encountered, the tool's structure is intended to provide an early warning of trending problems, followed by a clear identification of “show-stopper” conditions based on the level of achievement of the critical business success factors. If a program is halted, senior executives can either reset the critical business success factor target or thresholds, modify the scope of the program to bring it within the current targets, or in the worst case, cancel the program to prevent further investment of resources.
Executive managers and the program governance body set the boundary conditions (targets and thresholds) of the program strike zone within which the program manager can operate, thereby empowering the program manager to make decisions and manage the program without direct senior management involvement. For example, if a program manager and team are well seasoned and experienced, senior executives may choose to “open up” the difference between the target and threshold values, which effectively gives the program manager a higher degree of empowerment. Conversely, if a relatively inexperienced program manager and team are involved, or a program is highly complex and risky, senior executives may choose to tighten the difference between target and threshold values. This in effect establishes stricter governance control over a program.
As long as the program progresses within the strike zone of each critical business success factor, the program is considered on target and the program manager remains fully empowered to manage the program through its life cycle. However, if the program does not progress within the strike zone of each critical business success factor, the program is not considered on target and the executive managers must directly intervene.
Benefits of Use
In practice, the value of the program strike zone is achieved through the direct communication and interaction between the program manager and the executive sponsor of the program in setting the vision and key success parameters. These parameters are then recorded in the strike zone and become the management and tracking focus for keeping the program aligned to its business and operational objectives.
Use of the tool fosters a “no surprises to senior management” behavior by increasing the flow of relevant information between the program team and executive management. This results in an efficient means of elevating critical issues and barriers to success for rapid decision-making and resolution.
When used appropriately, it enables empowerment of the program manager and team by establishing the boundaries for authority, responsibility, and accountability. Too often we hear program managers tell us that they have all the responsibility for driving program success, but lack the authority. The program strike zone is the best tool we are familiar with to balance both sides of this equation.
Bill Shaley, a senior program manager for a leading telecom company, described the program culture within his company this way: “Managing a program is like having a rocket strapped to your back with roller skates on your feet, there's no mechanism for stopping when you're in trouble.” Sound familiar? The program strike zone is such a mechanism. The strike zone is designed to stop a program, either temporarily or permanently, if the threshold limits are breached, at which point the program is evaluated for termination or reset for continuation.
Indicators and Dashboards
The program manager spends a great deal of time reporting the status of their program to various stakeholders. Regardless of whether the status report is formal or informal in nature, the message should remain constant. The means by which this is accomplished is by consistent, comprehensive, and accurate information collected from the project team leaders and the remainder of the IPT members.
The following tools are used to effectively communicate business and operational status and progress at the various levels of a program.
The Project Indicator
The project indicator is used to establish cross-project reporting of project-level status during IPT core team communications. Program managers must be specific on what elements of the projects they want reported, the metrics to be used, and the level of detail to include. By working with the project managers in developing a consistent format for the indicators and a constant set of metrics to report, the program manager will receive a comprehensive yet concise report on project status in a standardized format. This will enable the program manager to efficiently evaluate operational progress on each of the projects and to consolidate the information for reporting program-level progress to senior management and the program governance board.
Tool Description
A project indicator is a brief, one- to two-page report that shows pertinent project status and trend information. An example is illustrated in Figure 9.7 for a software development project that is part of a larger program.

Figure 9.7 Example of project indicator.
The project indicator format and data to be used is agreed upon between the project and program manager. There are certain elements in a project indicator that will be unique to each project, such as software bug tracking in this example, and other elements that will be common for all projects, such as status, schedule, and risks.
Utilizing the Tool
The IPT core team should engage in a review of status for each of the projects on the program on a regular basis. For many programs, this is normally performed weekly, but in some cases it might even be performed on a daily basis, such as in an agile software environment.
Reporting the status and updates through the project indicator facilitates the flow of information within the program and keeps the team focused on the top priorities for achieving the program objectives. It also provides important information on which projects within the program require focused attention on the part of the program manager.
The Program Indicator
In most organizations, the program manager is required to provide status to senior management on a regular basis. The program indicator is used by the program manager to summarize the overall status of a program based upon the input and discussion with the IPT core team. The tool gives the program manager a high-level view of the total program and helps the program manager to determine if the program remains successfully on track or if there are potential barriers and issues that must be addressed.
Depending upon how formal reporting is accomplished within the organization, the program indicator is useful in an organizational program review meeting where each program currently funded within the organization will be reviewed by senior management (Chapter 7).
Tool Description
It is effective to have a common program indicator format for use on all programs for consistency and comparability of information. The reporting format should include all critical program elements that are important to senior management so that they can quickly determine progress on programs and which ones need more of their focus and attention. An example program indicator is displayed in Figure 9.8.

Figure 9.8 Example of program indicator.
Much like the project indicator, the program indicator is brief and limited to one or two pages. It is meant to give a concise but comprehensive description of current program status, key issues and changes that have been encountered, performance against business success factors, and the management of critical risk events.
Utilizing the Tool
The program indicator is normally used as a formal report that is distributed to senior management and program governance members as part of program review meetings. It can be used effectively with the program strike zone and program dashboard to communicate both business and operational program status. The objective for the program manager is to communicate both strategic and operational information regarding the program to the executive level, and to use the forum to gain executive assistance when needed.
Benefits of Use
The program indicator provides the project managers on a program a consistent format and data model for determining the current status of their program, understanding the most critical challenges their program team is facing, and a gross-level indication of how their program is trending against plan.
The program indicator also serves as a key communication vehicle between the program manager and the senior executives that highlights key cross-project issues that need to be elevated to senior leadership for resolution.
The Executive Dashboard
An executive dashboard is a business management tool used to visually communicate the health and status of a program from a business perspective. Creation of the program dashboard is a function of the program management office, while the primary users are the executive sponsors and the program governance board. These are busy stakeholders who need a summary level view of a program without having to troll through details in search of pertinent information. The purpose of the executive dashboard is to generate discussion at the executive level of an organization and to drill down into only those areas within a program that require attention.8
Tool Description
An executive dashboard is normally a brief and concise one-page report that provides at-a-glance information on program health and status. Graphical devices such as green/yellow/red indicators and trend charts are often used to communicate information clearly and succinctly (Figure 9.9).

Figure 9.9 Example of executive dashboard.
Executive dashboards should be designed to communicate a program's core metrics for health, status, and success. A program's intended business outcomes and an indication of a program's progress toward achieving the critical business success factors should always be included. If used, a program strike zone will provided detailed status of business success factor health, including the green, yellow, and red indications. This information can then be summarized and included in the executive dashboard.
An indication of the overall program risk level and progress toward management of the critical risk events is valuable information for determining program health. Detailed information on risk severity can be found in the P-I matrix and other tools that can be summarized and included in the executive dashboard.
Consideration should also be given to the inclusion of information on changes in program scope, quality management, program dependencies, resources, and customer or organizational readiness to receive the program output.
Utilizing the Tool
The executive dashboard is used by the executive sponsor or the program governance board to build awareness of status and drive critical decisions related to the program. In general, the dashboard is designed to provide answers to the following questions:
- Is the program properly aligned to business strategy?
- Is the program on target to achieving the business success criteria?
- Are there deviations from the original plan and success metrics?
- Are there critical risks and issues affecting the program?
- Have there been significant changes in the program or program environment?
- Does the program team need anything from senior management?
Based upon the information contained in the dashboard, the stakeholders may decide to intervene to provide advice and coaching, provide staffing or other types of support, or change program requirements as needed. If program objectives are compromised or potentially compromised, more serious actions may need to be taken including termination of a program.
Executive dashboards are updated at regular intervals depending upon an organization's reporting cycle. Normally we see the dashboards updated on a monthly basis, but depending on the program, updates can also occur biweekly or quarterly.
Benefits of Use
The value of the executive dashboard is in the direct communication and interaction between the program manager and the executive sponsor of the program in understanding the health and status of a program from a business perspective. The dashboard format provides the opportunity for executive stakeholders to quickly understand the current situation relative to a program and identify areas that need immediate attention and improvement. It also increases the visibility of risks and issues faced by the program team, thereby increasing the opportunity for early intervention and proactive management of the program's success factors.
Using the Right Tool for the Job
Like all tools, program management tools are not meant to be a panacea that will automatically make someone a better program manager. Becoming a better program manager is accomplished through experience and continuous building of skills and competencies. Rather, tools are designed to help a program manager become more effective and efficient in performing the key program management practices. Using the right tool for the right job, however, is a necessary factor in gaining the desired assistance from a tool.
Each tool described in this chapter has a primary purpose and usage. The benefits map is used to establish alignment between project outcomes and deliverables to the business benefits of a program, while the complexity assessment is used to characterize and profile the complexity associated with a program.
The PWBS is used to develop a comprehensive characterization of program scope by decomposing the program's output into more manageable components that will serve as the starting point for developing the work breakdown structures for each of the projects within the program. Along with the PWBS, the program map is used to visualize the big picture view of the project deliverables and outcomes over time, and help the program manager manage the cross-project interdependencies that exist on the program.
The program strike zone is used to identify the critical business success factors for a program and the P-I matrix is used to identify the various risks to hitting the criteria. It is used to assess probability and potential impact of program-level risk and provides a representation of risk severity to facilitate effective program decision making.
Project and program indicators are used to aggregate information on the current state of each project on a program as well as the program holistically. Program dashboards are used to provide a high-level summary of current state of all programs within a portfolio and help to focus attention on issues and needs as they surface on a program.
In addition to the tools described in this chapter, we have included other tools throughout this book which also have specific usages. The alignment matrix (Chapter 3) is used to establish the alignment of program objectives to the strategic business goals driving the need for the program. The program business case (Chapter 6) is used to describe and detail the business opportunity and obtain the funding and resources needed to execute a program. Stakeholder maps and stakeholder assessment tools (Chapter 7) are used to develop a concise and targeted stakeholder strategy.
As stated previously, the tools introduced in this book are not meant to be a comprehensive inventory of tools that are available for use by a program manager. Additional tools and tool templates can be found on the Program Management Academy website: http://wiley.programmanagement-academy.com.