CHAPTER 7
Mergers and Acquisitions Questions
- 1) What is the difference between a merger and a consolidation?
A merger is the combination of two or more business entities in which only one entity remains. A consolidation is a combination of more than one business entity; however, an entirely new entity is created.
- 2) What is the difference between a horizontal and vertical transaction?
A horizontal transaction is between business entities in the same industry, where as a vertical transaction is between business entities operating at different levels within an industry's supply chain.
- 3) What are a few examples of acquisitions?
- Acquisition of assets
- Leveraged buyout
- Management buyout
- 4) What are three major ways to facilitate an acquisition?
- Acquisition of assets
- Acquisition of equity
- 338(h)10 election
- 5) What are examples of other restructurings?
- Share buyback
- Workforce reduction
- Debt reconsolidation
- 6) What are the key variables impacting EPS in a debt and equity raise, respectively?
- Interest rate on debt
- Price per share on equity
- 7) Is an equity raise or a debt raise typically more dilutive to EPS? What are the exceptions to the common rule?
Equity is typically more dilutive to EPS than debt. If the stock price is overvalued, raising equity can be less dilutive than raising debt. Or if the interest rate is higher than the cost of equity, raising debt can be more dilutive than raising equity.
- 8) Walk me through an accretion/dilution analysis.
An accretion/dilution analysis assesses the EPS impact of the combination of two entities. First, one needs to obtain the purchase price, and then the sources and uses of funds need to be analyzed. The uses of funds are comprised of the purchase price plus potentially paying down the target company's net debt and transaction fees. The sources of funds will be some combination of equity, debt, or cash on hand. Once we know the sources and uses of funds, we can begin combining the two entities by adding together each target and acquirer line item from revenue down to net income except for items relating to the target company's net debt (if we are assuming we are paying down the target company's net debt) and the target company's shareholders' equity (because we are paying off the shareholders). So, we do not include the target company interest expense and target company shares and dividends on the income statement. In addition, we need to consider four major transaction adjustments: (1) post-merger cost savings, (2) the amortization of new intangible assets if we have been able to allocate a portion of the purchase price above book value toward new intangible assets, (3) new interest expense if we have raised debt to fund the transaction, and (4) new shares if we have raised equity to fund the transaction. We can then calculate a new EPS and compare with the original company's EPS in order to assess accretion dilution.
- 9) Name the four major transaction adjustments in an accretion/dilution analysis.
- Post-merger cost savings (synergies)
- Amortization of identifiable intangible assets
- New interest on raised debt
- New shares and dividends on raised equity
- 10) Name four major components of purchase price over book value.
- Goodwill
- New intangible assets
- Asset step-up
- Deferred tax adjustments
PRACTICE QUESTIONS
Use the space available to answer the following examples. The answers are at the end of the chapter.
- 11) If $250MM of long-term debt is raised at 10% interest rate, what is the impact to the income statement, cash flow statement, and balance sheet? Assume a 40% tax rate. Ignore effects of interest income.
Income Statement Cash Flow Balance Sheet - 12) If $250MM of common equity is raised at $10 per share, what is the impact to the income statement, cash flow statement, and balance sheet? Ignore effects of interest income.
Income Statement Cash Flow Balance Sheet - 13) If $1,750MM of long-term debt is raised at a 7% interest rate, what is the impact to the income statement, cash flow statement, and balance sheet? Assume a 35% tax rate. Ignore effects of interest income.
Income Statement Cash Flow Balance Sheet - 14) If $1,750MM of common equity is raised at $25 per share, what is the impact to the income statement, cash flow statement, and balance sheet? Ignore effects of interest income.
Income Statement Cash Flow Balance Sheet - 15) If $325MM of long-term debt is raised at a 15% interest rate, what is the impact to the income statement, cash flow statement, and balance sheet? Assume a 40% tax rate. Ignore effects of interest income.
Income Statement Cash Flow Balance Sheet - 16) If $325MM of common equity is raised at $25 per share, what is the impact to the income statement, cash flow statement, and balance sheet? Ignore effects of interest income.
Income Statement Cash Flow Balance Sheet - 17) If an asset is purchased for $500MM, what is the impact to the income statement, cash flow statement, and balance sheet? Assume a 40% tax rate. Ignore effects of depreciation for the time being.
Income Statement Cash Flow Balance Sheet - 18) What is the impact of straight-line depreciation on the $500MM asset to the income statement, cash flow statement, and balance sheet? Assume a 10-year useful life and a 40% tax rate.
Income Statement Cash Flow Balance Sheet - 19) What is the impact of accelerated depreciation on the $500MM asset to the income statement, cash flow statement, and balance sheet? Assume a 25% accelerated rate, a 10-year useful life, and a 40% tax rate.
Income Statement Cash Flow Balance Sheet - 20) If the $500MM asset is sold for $400, what would be the impact on the income statement, cash flow statement, and balance sheet? Assume a 40% tax rate on the asset gain (loss).
Income Statement Cash Flow Balance Sheet - 21) If an asset was purchased for $1,750MM, what is the impact to the income statement, cash flow statement, and balance sheet? Ignore effects of depreciation for the time being.
Income Statement Cash Flow Balance Sheet - 22) What is the impact of straight-line depreciation on the $1,750MM asset purchase to the income statement, cash flow statement, and balance sheet? Assume a 25-year useful life and a 35% tax rate.
Income Statement Cash Flow Balance Sheet - 23) What is the impact of accelerated depreciation on the $1,750MM asset purchase to the income statement, cash flow statement, and balance sheet? Assume a 20% accelerated rate and a 35% tax rate.
Income Statement Cash Flow Balance Sheet - 24) If the $1,750MM asset is sold for $2,000MM, what would be the impact on the income statement, cash flow statement, and balance sheet? Assume a 35% tax rate on the asset gain (loss).
Income Statement Cash Flow Balance Sheet - 25) $175MM is raised to fund the purchase of an asset, $125MM is raised in equity, and $50MM is raised in debt. What is the impact of the debt raise to the income statement, cash flow statement, and balance sheet? Assume a 10% interest rate and a 40% tax rate. Ignore effects of interest income.
Income Statement Cash Flow Balance Sheet - 26) If the $125 equity is raised at $10 per share, what is the impact to the income statement, cash flow statement, and balance sheet? Ignore effects of interest income.
Income Statement Cash Flow Balance Sheet - 27) Now, what is the impact of the $175MM asset acquisition to the income statement, cash flow statement, and balance sheet? Assume a 40% tax rate. Ignore effects of depreciation for the time being.
Income Statement Cash Flow Balance Sheet - 28) What is the impact of straight-line depreciation on the $175MM asset purchase to the income statement, cash flow statement, and balance sheet? Assume a 25-year useful life and a 40% tax rate.
Income Statement Cash Flow Balance Sheet - 29) What is the impact of accelerated depreciation on the $175MM asset purchase to the income statement, cash flow statement, and balance sheet? Assume a 20% accelerated rate and a 40% tax rate.
Income Statement Cash Flow Balance Sheet - 30) If the $175MM asset is sold for $150MM, what would be the impact on the income statement, cash flow statement, and balance sheet? Assume a 40% tax rate on the asset gain (loss).
Income Statement Cash Flow Balance Sheet - 31) $425MM is raised to fund the purchase of an asset, $275MM is raised in equity, and $150MM is raised in debt. What is the impact of the debt raise to the income statement, cash flow statement, and balance sheet? Assume a 5% interest rate and a 40% tax rate. Ignore effects of interest income.
Income Statement Cash Flow Balance Sheet - 32) If the $275 equity is raised at $25 per share, what is the impact to the income statement, cash flow statement, and balance sheet? Ignore effects of interest income.
Income Statement Cash Flow Balance Sheet - 33) Now, what is the impact of the $425MM asset acquisition to the income statement, cash flow statement, and balance sheet? Assume a 40% tax rate. Ignore effects of depreciation for the time being.
Income Statement Cash Flow Balance Sheet - 34) What is the impact of straight-line depreciation on the $425MM asset purchase to the income statement, cash flow statement, and balance sheet? Assume a 25-year useful life and a 40% tax rate.
Income Statement Cash Flow Balance Sheet - 35) What is the impact of accelerated depreciation on the $425MM asset purchase to the income statement, cash flow statement, and balance sheet? Assume a 20% accelerated rate and a 40% tax rate.
Income Statement Cash Flow Balance Sheet - 36) If the $425MM asset is sold for $475MM, what would be the impact on the income statement, cash flow statement, and balance sheet? Assume a 40% tax rate on the asset gain (loss).
Income Statement Cash Flow Balance Sheet - 37) We have evaluated and would like to acquire a public company. The company is trading at $15 per share and has a total of 200MM diluted shares outstanding. We have negotiated a 25% purchase premium. The company has an LTM EBITDA of $500MM, $125MM of net debt outstanding. We will also assume $5MM of transaction fees. The net debt cannot carry over to the acquirer so it must be paid down. What are the total uses of funds?
- 38) We have evaluated and would like to acquire a private business, so we look to public comparable companies (if they exist) to assess a proper value. We assume the comparable company analysis results in a range of 7.0× to 9.0× EBITDA. The company has an LTM EBITDA of $100MM and $75MM of net debt outstanding. If we assume $2MM of transaction fees and an 8.0× EBITDA purchase price, what are the total uses of funds?
- 39) Company A is looking to acquire Company B through a combination of cash and shares. Specifically, Company B is being acquired for $1 per share and in addition each Company B share will be exchangeable for 0.5× Company A shares. Company A trades at $10 per share. Company B trades at $5 per share and has 100MM diluted shares outstanding. What is the purchase price of the transaction?
- 40) Company A is looking to acquire Company B through a combination of cash and shares. Specifically, Company B is being acquired for 0.75× Company A shares. Company A trades at $16 per share. Company B trades at $10 per share and has 250MM diluted shares outstanding. The acquirer will also pay down Company B net debt. Company B has $150MM in long-term debt, $50MM in short-term debt, and $10MM in cash. If we assume 2% of the purchase price will go to transaction fees, what are the total uses of cash?
- 41) Company A is looking to acquire Company B through a combination of cash and shares. Specifically, Company B is being acquired for $2 per share and in addition each Company B share will be exchangeable for 1.5× Company A shares. Company A trades at $10 per share. Company B trades at $20 per share and has 100MM basic shares outstanding. Company B also has 10MM stock options exercisable at a strike price of $15. What is the total purchase price of the transaction?
PRACTICE CASES
These next few examples are designed to be 45-minute cases and answered on paper. I have provided blank pages to work out answers on your own. The solutions are provided at the end of the chapter.
- 42) Company A is looking to acquire Company B through a combination of cash and shares. You have been assigned to determine the accretion or dilution to Company A's earnings. Company B is being acquired for $1 per share, and in addition each Company B share will be exchangeable for 0.5× Company A shares. In addition, Company A has no cash on hand; it will raise additional funds in debt to pay down Company B's obligations and to fund transaction fees upon acquisition. Some key assumptions are noted below:
Key Market Data
Company A Company B Price $12 $6 Shares 250MM 100MM Options 10MM 20MM @ Strike Price $15 $6 Balance Sheet Items: Company A has $125MM debt, $0MM cash, and a book value of $500MM. Company B has $175MM debt, $0MM cash, and a book value of $700MM. Income Statement Items: Company A EBIT is expected to be $100MM. Company B EBIT is expected to be $20MM. Key Assumptions: 7% interest on debt 40% tax rate 1% of total EBIT cost savings Intangible asset allocation is 25% and amortized over 15 years. Fees 1% of purchase price - 43) Company A is looking to acquire Company B through a combination of cash and shares. You have been assigned to determine the accretion or dilution to Company A's earnings. Company B is being acquired for $2 per share and in addition each Company B share will be exchangeable for 0.25× Company A shares. In addition, Company A has no cash on hand; it will raise additional funds in debt to pay down Company B's obligations and to fund transaction fees upon acquisition. Some key assumptions are noted below:
Key Market Data
Company A Company B Price $8 $2 Shares 100MM 50MM Options 25MM 10MM @ Strike Price $15 $3 Balance Sheet Items: Company A has $250MM debt and a book value of $500MM. Company B has $100MM debt and a book value of $150MM. Income Statement Items: Company A EBIT is expected to be $250MM. Company B EBIT is expected to be $50MM. Key Assumptions: 9% interest on LTD 40% tax rate 3% of total EBIT cost savings Intangible asset allocation is 25% and amortized over 15 years. Fees 2% of purchase price - 44) Company A is looking to acquire Company B at a 20% premium above Company B's current share price. You have been assigned to determine the accretion or dilution to Company A's earnings. One-third of the uses will be funded in debt. Company's B's net debt will be retired upon acquisition. Some additional key assumptions are noted below:
Key Market Data
Company A Company B Price $12 $5 Shares 250MM 150MM Options 15MM 50MM @ Strike Price $15 $4 Balance Sheet Items: Company A has $200MM LTD, $50MM STD, $0MM cash, and a book value of $1.5Bn. Company B has $150MM LTD, $10MM STD, $5MM cash, and a book value of $800MM. Income Statement Items: Company A EBIT is expected to be $200MM. Company B EBIT is expected to be $50MM. Key Assumptions: 7% interest on LTD 5% interest on STD 1% interest income on investments 40% tax rate 1% of total EBIT cost savings Intangible asset allocation is 25% and amortized over 15 years. Fees 1% of purchase price - 45) Company A is looking to acquire Company B at an exchange ratio of 0.75× Company A shares. You have been assigned to determine the accretion or dilution to Company A's earnings. Company B's debt will not be paid down upon acquisition. Some additional key assumptions are noted below:
Key Market Data
Company A Company B Price $16 $10 Shares 750MM 250MM Options 15MM 50MM @ Strike Price $20 $11 Balance Sheet Items: Company A has $100MM LTD, $25MM STD, $0MM cash, and a book value of $2Bn. Company B has $150MM LTD, $50MM STD, $10MM cash, and a book value of $750MM. Income Statement Items: Company A EBIT is expected to be $600MM. Company B EBIT is expected to be $250MM. Key Assumptions: 8% interest on LTD 5% interest on STD 1% interest income on investments 35% tax rate 1% of total EBIT cost savings Intangible asset allocation is 20% and amortized over 15 years. - 46) Company A is looking to acquire Company B at a 15% premium above Company B's current share price. You have been assigned to determine the accretion or dilution to Company A's earnings. One-third of the useswill be funded in debt. Company B's net debt will be retired upon acquisition. Some additional key assumptions are noted below:
Key Market Data (MM)
Company A Company B Price $40 $20 Shares 135MM 425MM Options 15MM 75MM @ Strike Price $60 $20 Balance Sheet Items: Company A has $1250MM LTD, $20MM STD, $0MM cash, and a book value of $1.5Bn. Company B has $50MM LTD, $10MM STD, $5MM cash, and a book value of $800MM. Income Statement Items: Company A Revenue is expected to be $900MM Company B Revenue is expected to be $1,500MM. Company A COGS is 40% of Revenue and also has $140MM of Operating Expenses Company B COGS is 35% of Revenue and also has $75MM of Operating Expenses Key Assumptions: 10% interest on LTD 7% interest on STD 1% interest income on investments 40% tax rate Cost savings is 2% of total Operating Expenses. Intangible asset allocation is 25% and amortized over 15 years. Fees 1% of purchase price - 47) A company is being acquired at a purchase price of $250MM. The company has a book value of 150MM. 20% of the purchase price over book can be allocated to intangible assets and amortized over 10 years. What is the value of goodwill, intangible assets, and intangible asset amortization per year?
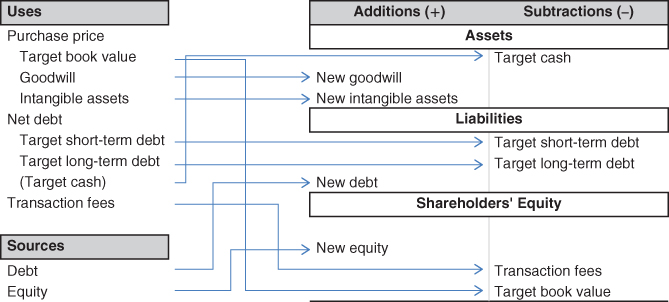
- 48) Please draw the appropriate transaction adjustments in this chart:
Uses Additions (+) Subtractions (−) Purchase price Assets Target book value Goodwill Intangible assets Net debt Liabilities Target short-term debt Target long-term debt (Target cash) Transaction fees Shareholders' Equity Sources Debt Equity
ANSWERS
- 11) If $250MM of long-term debt is raised at a 10% interest rate, what is the impact to the income statement, cash flow statement, and balance sheet? Assume a 40% tax rate. Ignore effects of interest income.
Income Statement Cash Flow Balance Sheet Interest Expense −$25
Tax +$10
Net Income −$15Net Income −$15
Long-term Debt +$250
Cash +$235Cash +$235
Long-term Debt +$250
Retained Earnings −$15 - 12) If $250MM of common equity is raised at $10 per share, what is the impact to the income statement, cash flow statement, and balance sheet? Ignore effects of interest income.
Income Statement Cash Flow Balance Sheet New shares 25MM Common stock +$250
Cash +$250Cash +$250
Common stock +$250 - 13) If $1,750MM of long-term debt is raised at a 7% interest rate, what is the impact to the income statement, cash flow statement, and balance sheet? Assume a 35% tax rate. Ignore effects of interest income.
Income Statement Cash Flow Balance Sheet Interest Expense −$122.5
Tax +$42.875
Net Income −$79.625Net Income −$79.625
Long-term Debt +$1,750
Cash +$1,670.375Cash +$1,670.375
Long-term Debt +$1,750
Retained Earnings −$79.625 - 14) If $1,750MM of common equity is raised at $25 per share, what is the impact to the income statement, cash flow statement, and balance sheet? Ignore effects of interest income.
Income Statement Cash Flow Balance Sheet New shares 70MM Common stock +$1,750
Cash +$1,750Cash +$1,750
Common stock +$1,750 - 15) If $325MM of long-term debt is raised at a 15% interest rate, what is the impact to the income statement, cash flow statement, and balance sheet? Assume a 40% tax rate. Ignore effects of interest income.
Income Statement Cash Flow Balance Sheet Interest Expense −$48.75
Tax +$19.5
Net Income −$29.25Net Income −$29.25
Long-term Debt +$325
Cash +$295.75Cash +$295.75
Long-term Debt +$325
Retained Earnings −$29.25 - 16) If $325MM of common equity is raised at $25 per share, what is the impact to the income statement, cash flow statement, and balance sheet? Ignore effects of interest income.
Income Statement Cash Flow Balance Sheet New shares 13MM Common stock +$325
Cash +$325Cash +$325
Common stock +$325 - 17) If an asset is purchased for $500MM, what is the impact to the income statement, cash flow statement, and balance sheet? Assume a 40% tax rate. Ignore effects of depreciation for the time being.
Income Statement Cash Flow Balance Sheet No Change Net Income $0
Asset purchase −$500
Cash −$500Cash −$500
PP&E +$500
Retained Earnings −$0 - 18) What is the impact of straight-line depreciation on the $500MM asset to the income statement, cash flow statement, and balance sheet? Assume a 10-year useful life and a 40% tax rate.
Income Statement Cash Flow Balance Sheet Depreciation −$50
Tax +$20
Net Income −$30Net Income −$30
Depreciation +$50
Cash +$20Cash +$20
PP&E −$50
Retained Earnings −$30 - 19) What is the impact of accelerated depreciation on the $500MM asset to the income statement, cash flow statement, and balance sheet? Assume a 25% accelerated rate, a 10-year useful life, and a 40% tax rate.
The impact is actually the deferred tax liability, assuming accelerated depreciation is allowable for tax purposes. At a 25% rate, the accelerated depreciation would be $125MM. To calculate deferred taxes we need to subtract the straight-line depreciation from the accelerated and multiply by the tax rate, or ($125 – 50) × 40% = $30MM.
Income Statement Cash Flow Balance Sheet No change Net Income +$0
Deferred Tax +$30
Cash +$30Cash +$30
Deferred Tax +$30 - 20) If the $500MM asset is sold for $400MM, what would be the impact on the income statement, cash flow statement, and balance sheet? Assume a 40% tax rate on the asset gain (loss).
Income Statement Cash Flow Balance Sheet After tax loss on sale −$60
Net Income −$60Net Income −$60
Adjustment: loss on sale +$100
Asset sale +$400
Cash +$440Cash +$440
PP&E −$500
Retained Earnings −$60 - 21) If an asset was purchased for $1,750MM, what is the impact to the income statement, cash flow statement, and balance sheet? Ignore effects of depreciation for the time being.
Income Statement Cash Flow Balance Sheet No change Net Income $0
Asset purchase −$1,750
Cash −$1,750Cash −$1,750
PP&E +$1,750
Retained Earnings $0 - 22) What is the impact of straight-line depreciation on the $1,750MM asset purchase to the income statement, cash flow statement, and balance sheet? Assume a 25-year useful life and a 35% tax rate.
Income Statement Cash Flow Balance Sheet Depreciation −$70
Tax +$24.5
Net Income −$45.5Net Income −$45.5
Depreciation +$70
Cash +$24.5Cash +$24.5
PP&E −$70
Retained Earnings −$45.5 - 23) What is the impact of accelerated depreciation on the $1,750MM asset purchase to the income statement, cash flow statement, and balance sheet? Assume a 20% accelerated rate and a 35% tax rate.
At a 20% rate, the accelerated depreciation would be $350. To calculate deferred taxes we need to subtract the straight-line depreciation from the accelerated and multiply by the tax rate, or ($350 – 70) × 35% = $98.
Income Statement Cash Flow Balance Sheet No change Net Income +$0
Deferred Tax +$98
Cash +$98Cash +$98
Deferred Tax +$98 - 24) If the $1,750MM asset is sold for $2,000MM, what would be the impact on the income statement, cash flow statement, and balance sheet? Assume a 35% tax rate on the asset gain (loss).
Income Statement Cash Flow Balance Sheet After tax gain on sale +$162.5
Net Income +$162.5Net Income +$162.5
Adjustment: gain on sale −$250
Asset sale +$2,000
Cash +$1,912.5Cash +$1,912.5
PP&E −$1,750
Retained Earnings +$162.5 - 25) $175MM is raised to fund the purchase of an asset. $125MM is raised in equity, and $50MM is raised in debt. What is the impact of the debt raise to the income statement, cash flow statement, and balance sheet? Assume a 10% interest rate and a 40% tax rate. Ignore effects of interest income.
Income Statement Cash Flow Balance Sheet Interest Expense −$5
Tax +$2
Net Income −$3Net Income −$3
Long-term Debt +$50
Cash +$47Cash +$47
Long-term Debt +$50
Retained Earnings −$3 - 26) If the $125 equity is raised at $10 per share, what is the impact to the income statement, cash flow statement, and balance sheet? Ignore effects of interest income.
Income Statement Cash Flow Balance Sheet New shares 12.5MM Common stock +$125
Cash +$125Cash +$125
Common stock +$125 - 27) Now, what is the impact of the $175MM asset acquisition to the income statement, cash flow statement, and balance sheet? Assume a 40% tax rate. Ignore effects of depreciation for the time being.
Income Statement Cash Flow Balance Sheet No change Net Income $0
Asset purchase −$175
Cash −$175Cash −$175
PP&E +$175
Retained Earnings $0 - 28) What is the impact of straight-line depreciation on the $175MM asset purchase to the income statement, cash flow statement, and balance sheet? Assume a 25-year useful life and a 40% tax rate.
Income Statement Cash Flow Balance Sheet Depreciation −$7
Tax +$2.8
Net Income −$4.2Net Income −$4.2
Depreciation +$7
Cash +$2.8Cash +$2.8
PP&E −$7
Retained Earnings −$4.2 - 29) What is the impact of accelerated depreciation on the $175MM asset purchase to the income statement, cash flow statement, and balance sheet? Assume a 20% accelerated rate and a 40% tax rate.
At a 20% rate, the accelerated depreciation would be $35. To calculate deferred taxes we need to subtract the straight-line depreciation from the accelerated and multiply by the tax rate, or ($35 – 7) × 40% = $11.2.
Income Statement Cash Flow Balance Sheet No change Net Income +$0
Deferred Tax +$11.2
Cash +$11.2Cash +$11.2
Deferred Tax +$11.2 - 30) If the $175MM asset is sold for $150MM, what would be the impact on the income statement, cash flow statement, and balance sheet? Assume a 40% tax rate on the asset gain (loss).
Income Statement Cash Flow Balance Sheet After tax loss on sale −$15
Net Income −$15Net Income −$15
Adjustment: loss on sale +$25
Asset sale +$150
Cash +$160Cash +$160
PP&E −$175
Retained Earnings −$15 - 31) $425MM is raised to fund the purchase of an asset. $275MM is raised in equity, and $150MM is raised in debt. What is the impact of the debt raise to the income statement, cash flow statement, and balance sheet? Assume a 5% interest rate and a 40% tax rate. Ignore effects of interest income.
Income Statement Cash Flow Balance Sheet Interest Expense −$7.5
Tax +$3
Net Income −$4.5Net Income −$4.5
Long-term Debt +$150
Cash +$145.5Cash +$145.5
Long-term Debt +$150
Retained Earnings −$4.5 - 32) If the $275 equity is raised at $25 per share, what is the impact to the income statement, cash flow statement, and balance sheet? Ignore effects of interest income.
Income Statement Cash Flow Balance Sheet New shares 11MM Common stock +$275
Cash +$275Cash +$275
Common stock +$275 - 33) Now, what is the impact of the $425MM asset acquisition to the income statement, cash flow statement, and balance sheet? Assume a 40% tax rate. Ignore effects of depreciation for the time being.
Income Statement Cash Flow Balance Sheet No Change Net Income $0
Asset purchase −$425
Cash −$425Cash −$425
PP&E +$425
Retained Earnings $0 - 34) What is the impact of straight-line depreciation on the $425MM asset purchase to the income statement, cash flow statement, and balance sheet? Assume a 25-year useful life and a 40% tax rate.
Income Statement Cash Flow Balance Sheet Depreciation −$17
Tax +$6.8
Net Income −$10.2Net Income −$10.2
Depreciation +$17
Cash +$6.8Cash +$6.8
PP&E −$17
Retained Earnings −$10.2 - 35) What is the impact of accelerated depreciation on the $425MM asset purchase to the income statement, cash flow statement, and balance sheet? Assume a 20% accelerated rate and a 40% tax rate.
At a 20% rate, the accelerated depreciation would be $85. To calculate deferred taxes we need to subtract the straight-line depreciation from the accelerated and multiply by the tax rate. Or ($85 – 17) × 40% = $27.2.
Income Statement Cash Flow Balance Sheet No change Net Income +$0
Deferred Tax +$27.2
Cash +$27.2Cash +$27.2
Deferred Tax +$27.2 - 36) If the $425MM asset is sold for $475MM, what would be the impact on the income statement, cash flow statement, and balance sheet? Assume a 40% tax rate on the asset gain (loss).
Income Statement Cash Flow Balance Sheet After tax gain on sale +$30
Net Income +$30Net Income +$30
Adjustment: loss on sale –$50
Asset sale +$475
Cash +$455Cash +$455
PP&E −$425
Retained Earnings +$30 - 37) $3,880MM. The purchase price is $15 × (1 + 25%) × 200MM = $3,750MM. Since this is a public company we need to be responsible for the net debt. It is stated that the net debt cannot carry over to the acquirer, so the acquirer needs to allocate additional funds to pay it down. So we add the additional $125MM in net debt plus the $5MM in transaction fees to get to a purchase price of $3,880MM.
- 38) $802MM. The purchase price is 8 × $100MM. Since this is based on an EBITDA multiple, this already includes the value of the net debt, so we do not add the $75MM of debt to this. We do, however, add $2MM in transaction fees to get to total uses of $802MM.
- 39) The purchase price is $600MM. One Company B shareholder would receive $1 plus 0.5× Company A shares. If Company A is trading at $10 per share, then a Company B shareholder would be receiving 0.5 × $10 or $5. So in total each Company B shareholder would be receiving $6 ($5 + $1). With 100MM outstanding shareholders, the total purchase price would be $600MM.
- 40) $3,250. One Company B shareholder would receive 0.75× Company A shares. If Company A is trading at $16 per share, then a Company B shareholder would be receiving 0.75 × $16 or $12 per share. With 250MM outstanding shareholders, the total purchase price would be $3,000MM ($12 × 250MM). So the transaction fees will be 2% of $3,000MM or $60. With a net debt responsibility of $190MM ($150 + 50 – 10), the total uses will be $3,250 ($3,000 + $60 + $190).
- 41) $1,720. One Company B shareholder would receive $2 plus 1.5× Company A shares. If Company A is trading at $10 per share, then a Company B shareholder would be receiving 1.5 × $10 or $15 in addition to the $2 in cash for a total of $17. It is stated that Company B has 100MM basic shares outstanding. They have an additional 10MM in stock options exercisable at $15 per share. At a $17 per share purchase price, those options are in the money, so we need to use the Treasury Method to create a total diluted share count. If 10MM shares are exercised at the strike price of $15, $150MM in funds will be generated. At the $17 purchase price, there would be approximately 8.82MM shares ($150/$17) less the original 10MM shares exercised, leaving approximately 1.18MM shares, or a total diluted share count of 101.18MM. The total purchase price would be approximately $1,720MM ($17 × 101.18MM). For more information on the Treasury method, please see the book Financial Modeling and Valuation.
- 42) I will explain the answer to this first example and paste the solution. This is an analysis designed to be done on paper with a calculator as opposed to in Excel. You'll be surprised how much more difficult it is to do this on paper when already used to Excel, so this is where practice helps.
Structure is key to these cases, so keep in mind the accretion/dilution process. First we need to determine the purchase price. As per the question, Company B (the target) is being bought out for $1 per share and 0.5× Company A (the acquirer) shares. So each Company B shareholder would receive $1 in cash and one half of a Company A share. Company A's shares are worth $12, so half a share is worth $6. Each Company B shareholder will then receive $7 ($1 + 0.5 × $12).
So we now need to determine how many Company B shareholders exist to get the total purchase price. The table shows 100 Company B shares outstanding, but we need to consider the total diluted share count. Company B has 20 options exercisable at $6. Since the purchase price per share of $7 is above the strike price of the options, the options will dilute upon acquisitions. We use the Treasury method to calculate the diluted shares. I will run through the calculation here. Twenty options exercise at $6 per share (the strike price) to give $120 in capital. The $120 will fund the purchase of shares at $7, resulting in 17.143 options ($120/$7). Twenty original options less 17.143 results in 2.857 shares. So the total diluted share count is 102.857. We multiply this by the acquisition price per share to get the total purchase price: 102.857 × $7 = $720MM.
Note if you are getting slight differences in calculations, it may be due to rounding. Although I'm presenting these numbers in three decimal places, I did not round while calculating the results on a calculator.
With the purchase price we can calculate uses of cash. It was noted in the example that the target's debt will be retired upon acquisition. It was also noted that fees will be calculated at 1% of the purchase price.
Uses Purchase Price $720,000,000 Net Debt 175,000,000 Transaction Fees $7,200,000 Total Uses $902,200,000 The sources are based on a combination of debt and equity. We know the equity component, as there is a portion of the purchase price exchanged in shares: 0.5× Company A shares to be exact. In the purchase price, we calculated that exchange to have a value of $6 ($12 × 0.5×). We can multiply $6 by the total diluted shares outstanding (102.857MM) to get the value of equity raised by the acquirer of $617.142MM. As it was stated that Company A has no existing cash on hand, the other $1 that made up the purchase price ($1 × 102.857) will be funded in Company A debt. It was also stated in the example the target company's net debt and fees will also be funded in acquirer debt. So the total debt raised by the acquirer is $102.857MM + $175MM + $7.2MM or $285.057MM.
Sources Debt 285,057,143 Equity 617,142,857 Cash 0 Total Sources 902,200,000 Now that we have the purchase price, sources, and uses, we can move on to analyzing the accretion/(dilution) impact. We first want to assess Company A's stand-alone EPS. EBIT was given in the example. The interest expense is calculated by applying the given 7% interest rated to the $125MM balance of acquirer debt. The EPS is $0.22.
Income Statement Company A EBIT 100,000,000 Interest Exp 8,750,000 Interest Income 0 EBT 91,250,000 Tax 36,500,000 Net Income 54,750,000 Shares 250,000,000 EPS $0.22 We can now begin the pro-forma analysis. Both Company A's and B's EBITs are added together, giving us $120MM. We now need to make adjustments to the EBIT for potential synergies and amortization of identifiable intangible assets. It was given that synergies will be assumed at 1% of combined EBIT, or $1.2MM. Remember, synergies are a reduction in expenses, so they will increase EBIT.
It was also stated that 25% of the purchase price – book value will be allocated to intangible assets and amortized over 15 years. The Company B book value is $700MM. So, the purchase price over book value is $20MM ($720MM − $700MM). 25% of $20MM is $5MM and, amortized over 15 years, gives annual amortization of $0.333MM.
So the adjusted EBIT is $120.867MM ($125 + $1.2 − $0.333).
We now need to work down from EBIT to net income. Since we've paid down the target company debt, there will be no target (Company B) interest. We will simply pull over the Company A interest expense, which we calculated previously as $8.75MM. However, there will be new interest as Company A has raised $285.057MM in debt to fund the acquisition. So at an assumed 7% interest rate, we need to include $19.954 of additional interest expense.
We can now adjust for taxes to get a pro-forma net income of $55.298MM.
Pro Forma EBIT 120,000,000 Adj: Synergies −1,200,000 Adj: Amortization 333,333 Interest Expense 8,750,000 Interest Income 0 Adj: New Interest 19,954,000 EBT 92,162,667 Tax 36,865,067 Net Income 55,297,600 Now that we have pro-forma net income we need to calculate the new number of shares to get a pro-forma EPS. Company A had an original share count of 250MM. As per the sources, it has raised $617.142MM of equity to fund the acquisition. We assume Company A will raise shares at its current share price of $12.00. So the company will raise an additional 51.429MM ($617.142/$12) shares to meet the acquisition costs. The additional 51.429 shares will give a pro-forma share count of 301.429MM.
Finally, the new net income divided by new shares will give the final EPS of $0.18, or a dilution of 16.23% to the original acquirer EPS of $0.22 ($0.18/$0.22 – 1). Again, some of these numbers I've rounded in this writeup, so direct calculator calculations may provide slightly different numbers. If you do not round the calculations, you will get these exact numbers. The Excel tables are extended into the thousands so you can better match the actual calculations.
Shares 250,000,000 Adj: New Shares 51,428,571 Total Shares 301,428,571 New EPS $0.18 Accretion/(Dilution) = (16.23%) - 43) Answer:
Purchase Price:
Purchase Price Target Basic Shares 50,000,000 Target Options 10,000,000 Option Strike Price 3 Purchase Price Options Exercised 30,000,000 Purchase Price per Share 4 Shares Repurchased 7,500,000 Diluted Shares 2,500,000 Total Diluted Shares 52,500,000 Purchase Price $210,000,000 Sources and Uses:
Uses Sources Purchase Price $210,000,000 Debt 209,200,000 Net Debt 100,000,000 Equity 105,000,000 Transaction Fees $4,200,000 Cash 0 Total Uses $314,200,000 Total Sources 314,200,000 Company A Financials:
Income Statement Company A EBIT 250,000,000 Interest Exp 22,500,000 Interest Income 0 EBT 227,500,000 Tax 91,000,000 Net Income 136,500,000 Shares 100,000,000 EPS $ 1.37 Pro-Forma Results:
Pro-Forma EBIT 300,000,000 Adj: Synergies −9,000,000 Adj: Amortization 1,000,000 Interest Expense 22,500,000 Interest Income 0 Adj: New Interest 18,828,000 EBT 266,672,000 Tax 106,668,800 Net Income 160,003,200 Pro-Forma Shares 100,000,000 Adj: New Shares 13,125,000 Total Shares 113,125,000 New EPS $1.41 Accretion/(Dilution) 3.62% - 44) Answer:
Purchase Price:
Purchase Price Target Basic Shares 150,000,000 Target Options 50,000,000 Option Strike Price 4 Options Exercised 200,000,000 Purchase Price per Share 6 Shares Repurchased 33,333,333 Diluted Shares 16,666,667 Total Diluted Shares 166,666,667 Purchase Price $1,000,000,000 Sources and Uses:
Uses Sources Purchase Price $1,000,000,000 Debt 388,333,333 Net Debt 155,000,000 Equity 776,666,667 Transaction Fees $10,000,000 Cash 0 Total Uses $1,165,000,000 Total Sources 1,165,000,000 Company A Financials:
Pro-Forma Results:Income Statement Company A EBIT 200,000,000 Interest Exp 16,500,000 Interest Income 0 EBT 183,500,000 Tax 73,400,000 Net Income 110,100,000 Shares 250,000,000 EPS $0.44 Pro-Forma EBIT 250,000,000 Adj: Synergies −2,500,000 Adj: Amortization 3,333,333 Interest Expense 16,500,000 Interest Income 0 Adj: New Interest 27,183,333 EBT 205,483,333 Tax 82,193,333 Net Income 123,290,000 Shares 250,000,000 Adj: New Shares 64,722,222 Total Shares 314,722,222 New EPS $0.39 Accretion/(Dilution) −11.05% - 45) Answer:
Purchase Price:
Purchase Price Target Basic Shares 250,000,000 Target Options 50,000,000 Option Strike Price 11 Options Exercised 550,000,000 Purchase Price per Share 12 Shares Repurchased 45,833,333 Diluted Shares 4,166,667 Total Diluted Shares 254,166,667 Purchase Price $3,050,000,000 Sources and Uses:
Uses Sources Purchase Price $3,050,000,000 Debt 0 Net Debt 0 Equity 3,050,000,000 Transaction Fees 0 Cash 0 Total Uses $3,050,000,000 Total Sources 3,050,000,000 Company A and Company B Financials: Remember, as Company B's debt will not be paid down, it will be consolidated into the combined entity. As a result, it may make a bit more sense to see Company B's full financials:
Pro-Forma Results:Income Statement Company A Company B EBIT 600,000,000 250,000,000 Interest Exp 9,250,000 14,500,000 Interest Income 0 −100,000 EBT 590,750,000 235,600,000 Tax 206,762,500 82,460,000 Net Income 383,987,500 153,140,000 Shares 750,000,000 250,000,000 EPS $0.51 $0.61 Pro-Forma EBIT 850,000,000 Adj: Synergies −8,500,000 Adj: Amortization 30,666,667 Interest Expense 23,750,000 Interest Income −100,000 Adj: New Interest 0 EBT 804,183,333 Tax 281,464,167 Net Income 522,719,167 Shares 750,000,000 Adj: New Shares 190,625,000 Total Shares 940,625,000 New EPS $0.56 Accretion / (Dilution) 8.54% - 46) Answer:
Purchase Price:
Purchase Price Target Basic Shares 425,000,000 Target Options 75,000,000 Option Strike Price 20 Options Exercised 1,500,000,000 Purchase Price per Share 23 Purchase Price Shares Repurchased 65,217,391 Diluted Shares 9,782,609 Total Diluted Shares 434,782,609 Purchase Price $10,000,000,000 Sources and Uses:
Uses Sources Purchase Price $10,000,000,000 Debt 3,385,000,000 Net Debt 55,000,000 Equity 6,770,000,000 Transaction Fees $100,000,000 Cash 0 Total Uses $10,155,000,000 Total Sources 10,155,000,000 Company A Financials:
Income Statement Company A Revenue 900,000,000 COGS 360,000,000 (COGS % of Rev) 40% OpEx 140,000,000 EBIT 400,000,000 Interest Exp 126,400,000 Interest Income 0 EBT 273,600,000 Tax 109,440,000 Net Income 164,160,000 Shares 135,000,000 EPS $1.22 Pro-Forma Results:
Pro-Forma EBIT 1,300,000,000 Adj: Synergies −4,300,000 Adj: Amortization 153,333,333 Interest Expense 126,400,000 Interest Income 0 Adj: New Interest 338,500,000 EBT 686,066,667 Tax 274,426,667 Net Income 411,640,000 Shares 135,000,000 Adj: New Shares 169,250,000 Total Shares 304,250,000 New EPS $1.35 Accretion/(Dilution) 11.26% - 47)
- Goodwill? 80MM______________________________________
- Intangible assets? 20MM_______________________________
- Intangible asset amortization per year? 2MM________________
- 48) Answer: