
5
Test Workload Estimation
Correctly estimating the load and duration of the tests allows us to allocate the budget and the time necessary for their execution throughout the project. While it is true that improving quality throughout a project makes it possible to limit costs and lead times (e.g. by reducing the number of defects introduced and therefore the necessary corrections), this reduction is not always anticipated by the production teams or the management teams. The benefits often seem too distant and diffuse. The correct evaluation of the loads and durations of the tests will impact both the cost of the tests and the probable date of production and deployment of the solution.
5.1. Difficulty to estimate workload
It is always difficult to correctly estimate the test workload necessary to identify (all) the defects present in a system; this is all the truer in a system-of-systems and in systems already developed whose size and complexity were not measured. The workload will depend on different aspects:
– the type of system-of-systems to be assessed (web system, commercial, military, security-critical or not, etc.);
– the size of the system-of-systems (e.g. size in function points or lines of code, number of variables and combinations, number of paths, number of components, etc.);
– the complexity and criticality of the systems and the system-of-systems;
– the initial quality level of the inputs, that is, the existing systems, their documentation, etc.;
– the number of faults present in each component or subsystem and the capacity of the production teams to correctly and quickly correct these faults;
– the number of test environments to be considered, the complexity of setting up these environments and the test data required;
– complexity, etc. In addition to these criteria, it will be necessary to estimate the impacts of development models on the generation of failures elsewhere in the system-of-systems as well as the impacts of quality assurance and testing activities on the number of defects and when they are detected and corrected.
At the functional level, the number of valid paths and exception paths present at each test level (for each level of component integration) will influence both the number of test cases to be considered and the set of activities required as part of the test project (e.g. obtaining test data, rerunning tests in the event of failures, etc.).
5.2. Evaluation techniques
Evaluating test effort or workload may seem akin to searching for information in a crystal ball, coffee grounds or tea leaves. Many works have been devoted to the subject of estimating the costs and deadlines for producing software and the effort required to test them. Below are several practices, some good, some bad but frequently used.
A common and usual element is to take a safety margin in addition to the effort volumes initially estimated. These margins will often be removed by management to reduce costs and lead times.
More information can be found in the following books: McConnell (2006), Jones (2007) and Black (2008, 2009).
5.2.1. Experience-based estimation
As its name suggests, this estimation method uses the experience of the actors on other similar projects to identify the expected load on the current project. This method, as well as all similar methods (Planning Poker, Fibonacci sequence, etc.), can provide a correct estimate “all other things being equal”. However, the workload depends on very many elements which are generally not known at the time of the evaluation. We can mention:
– the completeness and level of quality of the requirements or user stories at the start of development and testing;
– the quality and formalism of requirements reviews, specification or architecture reviews, the effectiveness of code analyses and code reviews carried out before dynamic tests;
– the quality of the code that will be provided by the developers, which quality may vary according to the co-contractors in charge of the system-of-systems;
– the quality of the corrections (absence of regressions) and their speed of delivery, which will depend among other things on the quality and level of detail of the anomaly reports;
– the quality and completeness of unit tests and integration tests, including the various test techniques implemented during these tests;
– the use of estimation tools such as COCOMO II, CHECKPOINT, PRICE-S SEER and SLIM;
– the use of methods such as COCOMO and COCOMO 2;
– the number of test steps and the percentage of effort dedicated to testing, which increases the cumulative DRE (from 50% with one test step to 99.9999% after 17 test steps).
Of course, this means comparing against similar systems, both in terms of size and in terms of complexity.
5.2.2. Based on function points or TPA
Several variations exist in the calculation of function points (e.g. IFPUG version 4.1, SNAP, NESMA, etc.) and function points are the basis of the work of Capers Jones. Function points are interesting in that they free themselves from the verbosity of languages and focus on the functional aspect. SNAP function points additionally consider non-functional aspects. From the estimation of the number of function points (FPs), a first estimate of the number of test cases can be defined, varying from 2 to 13.75 test cases per function point (average of 5.55) according to Jones (2007).
A proposal has been made to associate test points with FPs according to various criteria. The method is called TPA for Test Point Analysis, and is as follows: from these test points, test activities are defined and by a mathematical formula converted into test work hours. Total test points are calculated by adding the dynamic test points and the product of the software function points with the static test points.
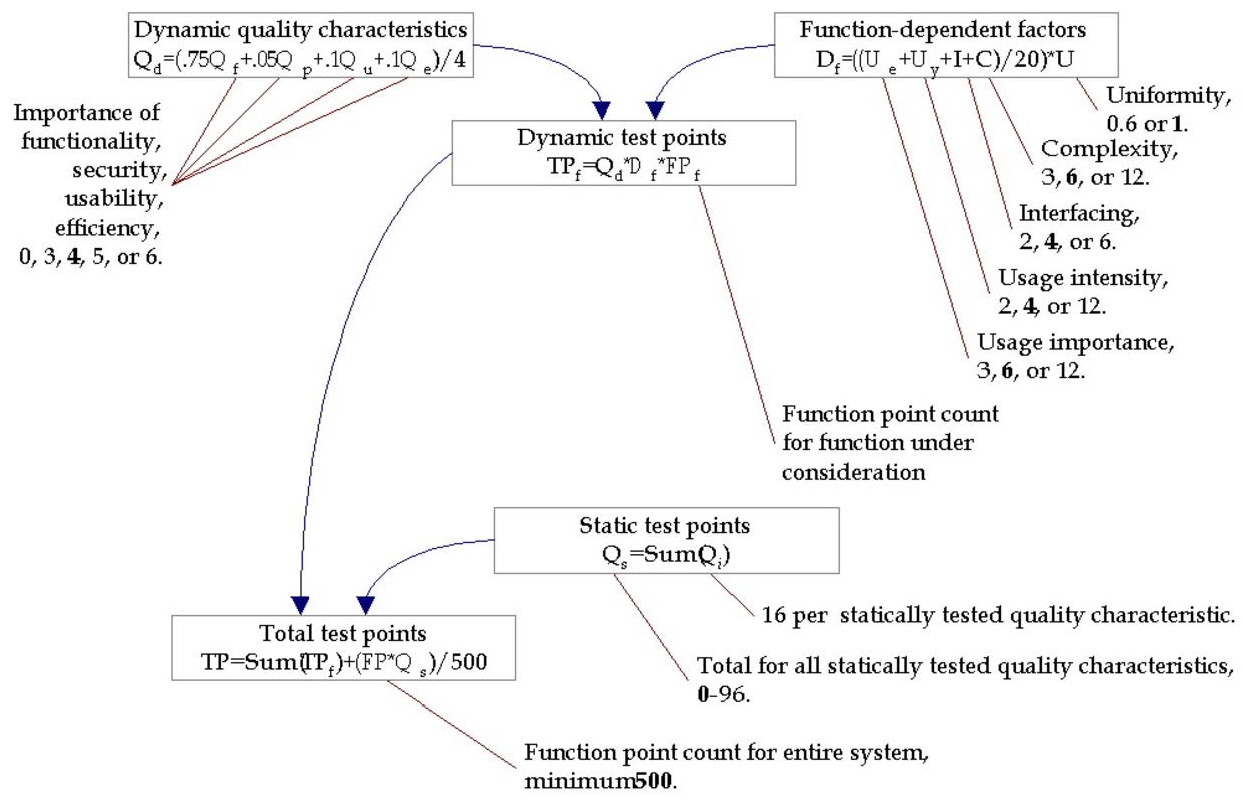
Figure 5.1 Test points calculation (TPA) © RBCS
Once the number of test points has been calculated, it will be possible to calculate the test load in hours.
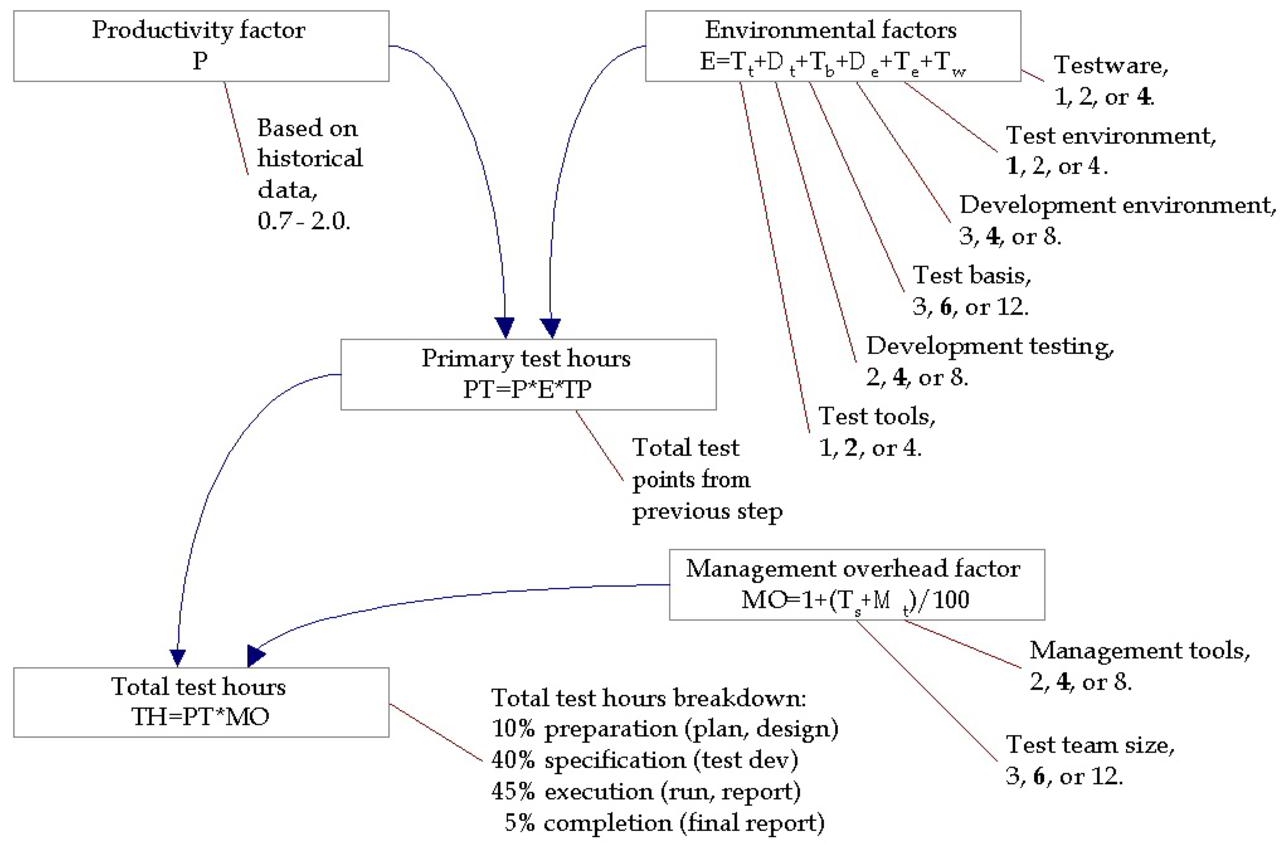
Figure 5.2 Converting to test hours © RBCS
As we realize, each value can vary between a minimum and a maximum (a suggested value – in bold – can be used) and the ratios between minimum and maximum can range from simple to fourfold. The workload could therefore, with the same initial data, vary very greatly.
As shown by the work of Capers Jones, the great variability of the types of software (web, information systems, CRM, governmental, military, etc.), as well as the sizes have a strong impact on the development costs. The size of the software (in function points) and their complexity will increase the number of faults (from 4 to 7 faults per function point, i.e., almost double) and therefore the effort to be implemented to correctly test the systems-of-systems produced. It is therefore important to take these elements into account and to identify that systems-of-systems projects, being by nature more complex and requiring more complex organizations, will require a greater testing effort than smaller projects. The use of multiple testing stages and the most efficient techniques is therefore recommended (e.g. with formal pre-design reviews and code inspections, nearly 80% of defects can be detected and testing efficiency is increased).
5.2.3. Requirements scope creep
Needs and requirements evolve over the life of projects. Historically, this evolution is 1.67% per month – see Jones (2017) – which likely drove the emergence of agility in that agility allows for faster response to demands of changing needs. This increase in requirements and needs has a much greater impact on large-scale projects – such as systems-of-systems – due to their size and the duration of their developments. For example, a project estimated at 1,000 function points reaches 1,200 function points after 12 months. The initially estimated costs are no longer relevant, and the progress will be automatically impacted.
This increase in requirements and needs does not stop at the delivery of the software but continues during the maintenance phases, leading to an increase in expenses, as well as an increase in defects present in the system with components that become unmaintainable and difficult to correct (injection of new defects during corrections of 1.7% to 25% depending on the complexity of the modules). Such an increase is shown in Figure 5.3. We can identify these components by watching the devs assigned to fixes swoon when these components are mentioned.
This constant increase in requirements impacts the provision of the developed system (delays in delivery), the effort (therefore cost), and therefore customer satisfaction, with its corollary of disputes between customer and service providers, between MOA and MOE. The impact can go – especially on large projects – to the cancellation of the project and therefore to significant financial losses.
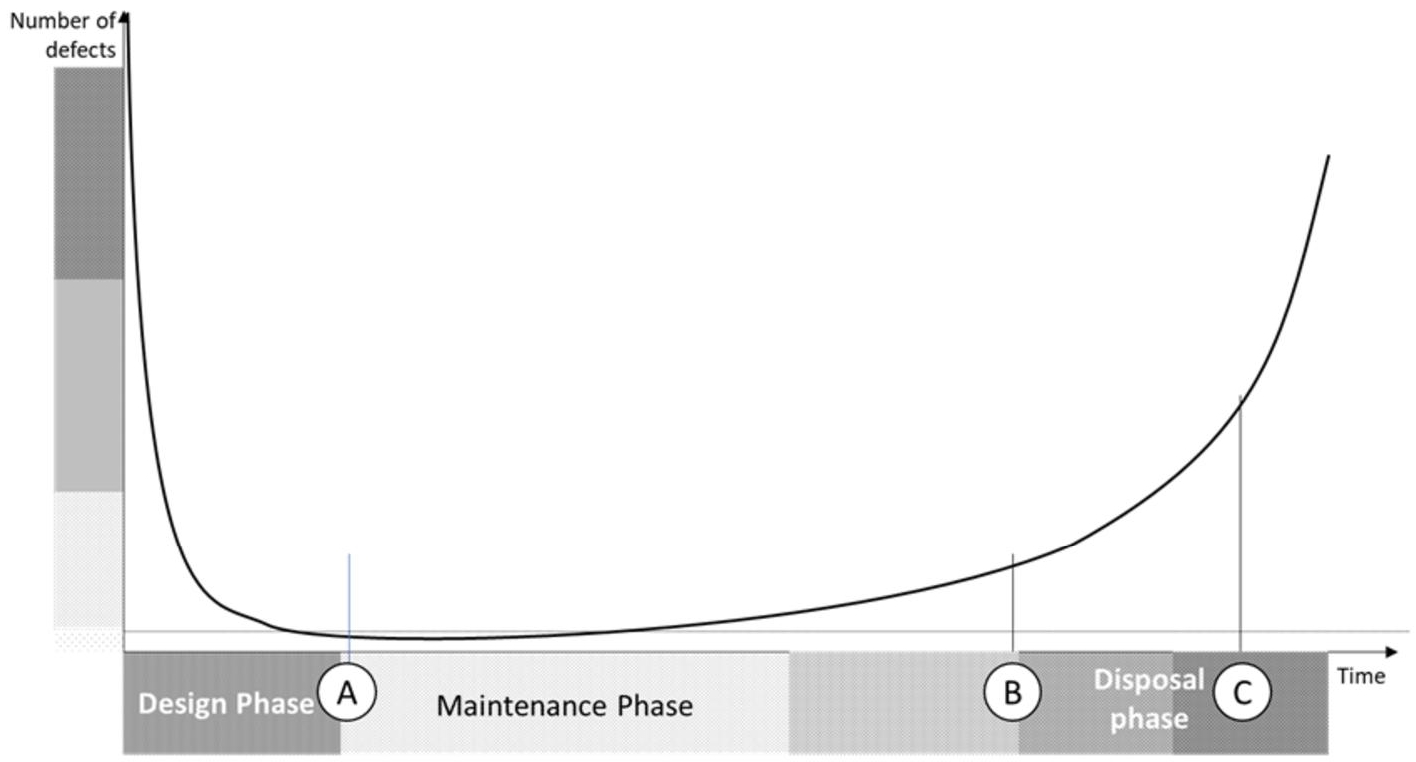
Figure 5.3 Bathtub curve
5.2.4. Estimations based on historical data
Building on information from previous projects, from within the same hierarchical or organizational structure, could be interesting and realistic. However, attention will need to be paid to differences in aspects of complexity, underperforming or overperforming teams, unmeasured data, etc. Some historical information is not kept – when it is negative or may reflect negatively on the organization or the people – which will tend to mask previous concerns.
We recommend only using historical information, such as statistical information from the industry, as guides or trends, rather than as “set in stone” data.
5.2.5. WBS or TBS
The principle of WBS (Work Breakdown Structure) and its extension to TBS (Test Breakdown Structure) divides each task of the project (or of the test project) into one or more tasks of smaller size, until obtaining individual tasks of small cut.
The interest is to be able – from high-level objectives – to define the list of tasks and activities to be implemented to achieve the defined objectives. This solution makes it possible to identify the activities that can be carried out in parallel and the activities on which other activities can depend.
The duration of the unit tasks must be evaluated by those who will perform them or by any other applicable method (experience, statistics, etc.).
5.2.6. Agility, estimation and velocity
In Agile methods, the estimation is the responsibility of the Dev teams and is carried out at each iteration (sprint). In general, the duration of the iterations and the size of the team remaining constant, the capacity to do (CAF or bandwidth) of the team is stable and the estimate of what can be done per iteration will limit the tasks that can be done per iteration.
Another important aspect is that since the load estimate is done for the next sprint only, the total load estimate – for the whole project – is not done. Agile habits consider that the components to be designed first are those that will bring the most value to the project (monetary or functional value, e.g., dependencies or architecture), so – if delays occur in the design and/or delivery of developments – the functional scope will be impacted. The estimation of what can be done – that is, the user stories that can be developed in the sprint – will be done in the form of “story points”, with the aim of selecting only the user stories whose sum remains below the team’s capacity to do (CAF) during the sprint.
Estimation techniques used, in addition to experience-based techniques, involve Planning Poker (estimating combining expert opinion, analogy to historical developments and splitting tasks as with a WBS to estimate them individually). Participants in these estimation meetings should include developers, testers, architects, analysts, database managers, etc. to combine the experiences and knowledge of each. The information given by the sessions of Planning Poker is never very precise, but this lack of precision is not important because the inaccuracies in more or less should be balanced on a sprint and on all the sprints of the project.
Workload monitoring (story points used to create user stories) makes it possible to measure velocity, that is, the team’s ability to do things during a sprint. Re-estimates can be considered at the end of the sprint when the team notes that it did not have the possibility to deliver what was planned (the story points were underestimated), or that it was able to deliver everything and that they still have time available (story points were overestimated). It may be tempting at this time to re-estimate the previous tasks in order to have a better basis for calculating the remaining tasks. However, the CAF in terms of story points depends on the sum of the tasks to be performed to reach the “done” state, so if some tasks have not been performed or have not been considered, the estimate will be incorrect.
It will therefore be absolutely necessary to check at the end of the iteration if the initial estimates correspond to what has been spent as a workload and if the expected level of quality has been achieved and all the expected deliverables have been provided (including documentation, operations manuals, automated test cases and evidence of traceability to and from requirements) as mentioned in Cohn (2006).
As Agile methodologies are varied (Scrum, XP, SAFe, etc.) and continue to evolve, the load assessment techniques will likely evolve over the coming years.
5.2.7. Retroplanning
Reverse planning is very often used in the industry when a delivery date has been set and testing (and development) activities must be planned to reach the target date.
This method of estimation often results in frustration for both parties: development teams because they do not have time to work properly, test teams because they are pressed between late deliveries – or questionable quality – on the part of the development and deadlines do not allow to ensure a sufficient level of quality before delivery.
Among the elements that come into play and influence – positively or not – the estimate via retroplanning are the aspects of optimism and not considering dependencies or constraints, which often result in illusory schedules. One of the often overlooked aspects is the need to multiply test campaigns (test stages) to achieve the desired level of quality.
In their book, Jones and Bonsignour (2012) remind us that on average with three campaigns, the cumulative DRE is approximately 70% and that it rises to 90% after eight campaigns or steps.
5.2.8. Ratio between developers – testers
The solution of relying on some ratio between developers and testers seems attractive, until we look at it. Indeed, in addition to the aspects of relative skills of each other which will influence the ratios, the complexity and the criticality of the components will have a significant impact as the ratio between the test and development teams.
Some ratios where the number of testers is obviously too low (e.g. 1 tester for 10 developers) seem unrealistic. Similarly, inverse ratios (e.g. 10 testers for one developer) seem unrealistic, except in the case of critical security systems where several levels of integration requiring tests at each level can justify this number.
5.2.9. Elements influencing the estimate
As noted in Black (2008) and in Jones (2007), many elements influence the estimation of an application’s test load, from a component, a system or a system-of-systems.
Among the factors to be considered, we have:
– process-related factors:
- the presence of quality assurance, review and testing activities in all project activities from day one,
- formal transfers of responsibilities between actors, with a clear definition of prerequisites and expectations (e.g. definition of done in Agile projects),
- a clear and well-managed change management process for project documents, requirements, design, implementation and testing of products, components and systems,
- the chosen software development and maintenance life cycle, including the level of maturity of the testing and design processes,
- corrections of anomalies carried out within a reasonable time and not leading to the reopening of these anomalies,
- reasonable budgets and deadlines, in relation to the expected level of quality, the size of the system to be tested and the available resources,
- delivery of quality components to be tested and synchronization of these deliverables,
- correct execution of all upstream test phases (unit tests, component tests, integration tests, etc.);
– material elements:
- availability of systems, subsystems, hardware, equipment and components to be tested,
- availability of test environments with the right versions of OS and applications,
- availability of test tools and test data;
– aspects related to people:
- organizational complexity of the tests within the various co-contractors and subcontractors,
- duplication of test effort according to test levels or test phases,
- skills of individuals in the business field,
- knowledge and practices of individuals in testing activities,
- experience of testers in test automation;
– aspects causing delays:
- complexity of the processes, the project, the technologies, the organization or the environments,
- number of stakeholders, the quality of the system or the project itself,
- number of subsystems, systems, components and products to be tested, as well as the geographical distances that may separate them (e.g. use of off-shore teams in other time zones),
- knowledge, learning and training needs of the test and project teams. We will also include turnover here,
- needs for new tools, new techniques, methodologies and/or technologies at each level of testing and the need to assimilate them,
- requirements of particular test tools, among others for the transverse automation of tests and their coordination on several components or systems,
- any detailed test case documentation requirements,
- problematic arrival of components (delays, incompleteness, etc.).
Capers Jones (2007) also mentions other elements such as:
– formal inspection or not of the requirements;
– number of test steps or level;
– use of prototyping techniques;
– analysis of the architecture of the system (and of the system-of-systems);
– essential complexity of the structure of the system-of-systems;
– presence of a verified and validated project plan;
– initial design and detailed design activities;
– formal design reviews (e.g. inspections);
– static analysis and code inspections;
– purchase of software and the reuse of code have already been formally validated;
– implementation of IVV activities (independent verification and validation);
– a good management of change control;
– a formal integration of the components;
– presence of user documentation (checked automatically);
– presence of formalized unit tests;
– presence of testing of valid functionalities and exceptions;
– presence of integration tests and/or system tests and/or acceptance test;
– use of beta test phases and independent test teams;
– involvement of quality assurance activities in design and testing activities;
– involvement of support for installation and training;
– presence of a real project management with periodic project reviews.
Given the multiplicity of activities that can influence test load estimates, we can realize that any estimate will be – at best – only a trend or an order of magnitude.
5.3. Test workload overview
The test load will need to be presented to stakeholders, so we will need to be able to justify the loads we are proposing. We must have verified and validated each of the tasks and the associated charges. Similarly, we will need to show how the test load should be understood, what it includes in terms of component and feature coverage, what features are covered, what will be automated and why, how the load will be distributed throughout test campaigns and their preparations and how anomalies will impact this test load. Some durations and loads will be estimates, and we must be able to show how these estimates were calculated (calculation formulas) and from what elements (analogy with other projects, etc.).
5.3.1. Workload assessment verification and validation
Workload assessment requires ensuring that:
– the load is correctly defined and estimated;
– the tasks covered by the load are those to be executed, without omissions;
– the load is verified (it corresponds to measurements or calculations);
– the load is validated (it is realistic and must allow the execution of the tasks).
The objective here is to ensure that there are no longer any gray areas or inaccuracies in the tasks associated with testing activities. Therefore, each task will have to identify its prerequisites, the data and documents needed as input, the expectations that will serve as a basis for comparing the results obtained, as well as the volume of resources and personnel required. It will also be necessary to identify all the factors that can have a negative effect on the task, such as holidays or illnesses, delays in delivery or dependencies between tasks.
Various methods exist to estimate the workload:
– Estimated by the person or persons who will be required to carry out the task. This solution is effective if the individuals have experience in this task, but the estimate may be distorted by particularities of this task (or its environment) compared to the tasks that serve as a reference for the comparison.
– Estimation based on industry averages or standards. This estimate often turns out to be incorrect if the benchmark for comparison is different from that of the project or system to be tested. Nevertheless, this makes it possible to compare a load evaluation defined by other means in order to estimate its consistency.
– Recursive estimation using means from several estimators (wideband Delphi). This way of estimating makes it possible to smooth out the differences in individual estimates and to obtain a more consensual evaluation.
5.3.2. Some values
The data below are based on function points (FP) and the work of Capers Jones; they can be used to check the validity of our estimates. Number of faults expected per function point according to software size (in FP).
| Potential defects introduced in the phase | Size of the software in FP | ||||
| 10 | 100 | 1.000 | 10.000 | 100.000 | |
| Requirements elicitation | 0.25 | 0.75 | 1.00 | 1.25 | 1.50 |
| Architecture | 0.05 | 0.10 | 0.25 | 0.50 | 0.75 |
| Design | 0.50 | 1.00 | 1.25 | 1.50 | 1.75 |
| Coding | 1.65 | 1.70 | 1.75 | 2.00 | 2.10 |
| Testing material | 1.25 | 1.50 | 1.85 | 2.00 | 2.10 |
| Documentation | 0.60 | 0.65 | 0.70 | 0.75 | 0.80 |
| Bad fixes | 0.30 | 0.40 | 0.48 | 0.56 | 0.63 |
| Total | 4.60 | 6.10 | 7.28 | 8.56 | 9.63 |
The number of defects per function point grows according to the size of the software. This increase in the number of defects to be found will impact the testing workload required to find all these defects. It is clear that some defects can be found early by reviews (e.g. defects in requirements or architecture) while others can only be identified when the software is in the testing phase (e.g. system tests). The techniques to be implemented and the volume of anomalies to be found will therefore vary throughout the project.
5.4. Understanding the test workload
When we detail the workload necessary for the tests, we arrive at a load often much higher than what was anticipated at the beginning of the project. It will therefore be necessary to justify the calculation of this load by demonstrating what is covered – or not – by the test workload.
5.4.1. Component coverage
Component coverage covers every component, from requirements to test cases. It must be seen both at the level of automated static analysis and at the level of inspections or reviews making it possible to validate the content of the component. As part of the coverage of software components and predominant software components, we would also like to have coverage of the dynamic aspects of these components.
5.4.1.1. Static coverage
Has each component undergone static analysis?
If they are requirements, user stories or specifications, have these been subject to formal inspections or reviews?
If it concerns architecture or technical diagrams, have these been the subject of technical reviews?
In the case of code or pseudo-code, have they been the subject of code analysis with recognized and well-configured analysis tools?
5.4.1.2. Dynamic coverage
In the case of predominant software components or software, what coverage has been achieved?
For critical components or software, has 100% coverage of instructions, decisions and MC/CD been achieved (e.g. as required for aeronautics by DO178C/ED12C for components that may cause catastrophic failures).
5.4.2. Feature coverage
Feature coverage may need to be demonstrated based on:
– the critical functionalities which must always be demonstrated both for the nominal cases and the exceptional cases;
– the functionalities in degraded mode, with identification of the modes (if there are several degraded modes) and the exceptions which generate them;
– the level of criticality and importance of each functionality described in the system-of-systems requirements.
It is not within the scope of a generic book to detail all the possible functionalities to be covered.
5.4.3. Technical coverage
The technical coverage can be defined from the quality characteristics of the chosen quality model (see Volume 1, Chapter 5). The following elements seem to us to be worth mentioning.
5.4.3.1. Security
This includes both the security of data and exchanges, including aspects of non-repudiation and non-disclosure, and the safety of people in the event of failure of one or more of the components of the system-of-systems.
The test load will vary according to the level of security or safety to be achieved as well as the number of points to be checked in the security checklists. It should be noted that the appearance of new security vulnerabilities (zero-day exploits) requires a significant update effort.
5.4.3.2. Performances
This will include, once the performance objectives have been defined for each of the components of the system-of-systems, the verification that these objectives have been correctly achieved. Load forecasting to measure performance coverage will therefore have to be done in the design phases and in the integration and test phases. The use of representative test environments will be required.
5.4.4. Test campaign preparation
Test campaign preparation activities are often underestimated, which can lead to:
– delays in the start of execution if the environments are not available or are incomplete, if the settings are not made or if the flows and interfaces are unavailable between the components to be tested;
– problems during execution, if test execution must stop and then start again because components are missing or are misconfigured.
5.4.5. Running test campaigns
Execution of test campaigns can only be carried out when all preparation tasks have been successfully completed and all components, products, equipment, subsystems and systems are correctly delivered, installed and connected. While it is possible to prepare the test activities in different orders, the execution can only start when everything is ready, otherwise we will end up with test teams waiting for days for the environments to be available.
Once the test environments for the campaign have been properly prepared and validated, the components to be tested have been correctly delivered, then the campaign should be able to run. It will be executed in phases (or steps) with several steps that will follow and repeat each iteration:
– testing of new functionalities or user stories, to ensure that they meet their requirements;
– retesting of the corrections provided in this iteration, to ensure that the defects have been correctly corrected;
– regression testing of all the features already delivered to ensure that the new delivery has no impact on those delivered previously. This regression testing activity will increase as the campaigns progress because the number of features already delivered will also increase and it is difficult to predict where regressions may appear.
These activities will require, at the beginning and at the end of the test campaign, to ensure that the test environments are restored.
5.4.6. Defects management
The management of defects and their corrections has a significant impact on test times and loads. Indeed, any defect discovered:
– Must be analyzed to make sure it is indeed a defect. This, as well as writing it to a defect management tool is often time-consuming.
– Must be understood by the development teams, who will have to correct it and then re-deliver the code, component, product or system, making sure to respect the configuration management criteria.
– May give rise to exchanges between test and production teams, if the requirements are ambiguous or contradictory. These exchanges will result in delaying the correction of the defect.
– Must be corrected by the production team as soon as possible so as not to delay the tests in progress.
– May lead to untimely termination of tests if dependencies exist towards this anomaly. For example, a record modification can only take place if the creation of the record has taken place. If this creation generates an anomaly, the modification will be blocked.
– Must be retested, ensuring that the environments, their data and their settings are suitable for retesting this defect.
– Must give rise to regression testing on other parts of the component, product, system or system-of-systems.
The burden of correcting defects is the responsibility of the design and production team(s). Defect fixes should be performed by the best developers, designers or implementers, as these individuals are the most effective at identifying potential bug impacts. However, these individuals are often assigned to the realization of other components and it is less competent people who are assigned to the correction of defects. This has a negative result on the quality and duration of corrections of corrections.
5.5. Defending our test workload estimate
Once the test workload has been defined, it is often necessary to defend deadlines and budgets (resource allocation).
It will be necessary to understand how the load was calculated, to identify the impacts of each task (including the impacts of not doing a task in terms of not detecting faults), the dependencies between the tasks and all the elements that will have or could have an impact on schedules. Among these, we have:
– the prerequisites of each test activity, for example, presence of clear and unambiguous requirements, availability of resources (personnel, material, data, etc.): it is impossible to run tests if the testers are not available or if the code is not provided;
– the quality of the input data, for example:
- designing a test based on a summary description of what the application must do will require revisiting this design later, with business and development representatives, to define a nominal operation and an identification of alternative or different operations,
- running a test that does not complete satisfactorily involves opening an anomaly report. This stops the workflow, takes time and can impact the quality of the test data used.
Statistical information is more readily available on development and test workloads performed in a V-cycle (sequential) fashion, as this mode of development has been in use for over 30 years. About statistics relating to developments and tests using Agile methods, given the great diversity of methods and the relatively short duration of the implementation of agile methods, statistical information to defend the test load is more difficult to obtain. According to Jones (2018), the implementation of hybrid approaches, with sequential approach (such as V-model) combined with Agile (such as SAFe), gives surprisingly positive results.
5.6. Multi-tasking and crunch
Two aspects are to be considered in the evaluation and re-evaluation of test loads:
– Multi-tasking where the same individual is assigned to do several tasks simultaneously, moving quickly from one to another. This mode of operation introduces inefficiency because the brain takes a few seconds or several minutes to remember all the ins and outs of the current task. As a result, the total sum of all ends of the same task will be higher than if the task had not been interrupted.
– The Crunch: this period of the project during the execution of the tests where one begins to suspect that the project team – or the subcontractors or the co-contractors – could not respect the deadlines, that the budget could be exceeded, that the system may not have the desired level of quality or that certain requirements may not be met. As mentioned in Black (2009), the test manager must manage changes in planning, configurations, dependencies that suddenly emerge, as well as the impression that each team decides not to do as we please without considering the needs of the overall project.
Good preparation, detailed planning, up-to-date configuration management, requirements tracking, test cases and their traceability to requirements, anomalies to test cases (and components and their versions), all these activities will allow us to limit the impact of the Crunch on our project. The desire to have accurate data contradicts the obligation to move the project forward. So it will be necessary to define a “sufficient” level of quality for any information or any anomaly report.
5.7. Adapting and tracking the test workload
As mentioned in Jones (2018), it is rare for a project – even a system-of-systems one – to start with 100% of the requirements defined (often only 50% of the requirements are defined at the time) from the beginning of the project. This implies that the test load cannot be considered completely defined either. One solution would be to:
– plan several test iterations (at least 6), in order to ensure that the defects will be correctly identified and corrected;
– plan formal reviews of specifications and code analyses in order to identify defects as early as possible;
– provide a fairly large margin of uncertainty (e.g. 20%). However, this margin will probably be the first to be removed.
Another solution for adapting the load is to have tasks as short as possible and to follow them closely. This detailed and daily monitoring frequently makes it possible to reorganize the tasks – and therefore the test load – according to availability and time constraints.