
CHAPTER 4
Financial Analysis
Financial analysis is the selection, evaluation, and interpretation of financial data, along with other pertinent information, to assist in assessing the risk and return associated with an investment. Financial analysis may be used to evaluate the efficiency of operations, the effectiveness of credit policies, and the creditworthiness of a company, among other things.
The analyst draws the financial data needed in financial analysis from many sources. The primary source is the data provided by the company itself in its annual report and required disclosures. The annual report and the 10-K filing include the income statement, the balance sheet, and the statement of cash flows, as well as footnotes to these statements.
Besides information that companies are required to disclose through financial statements, other information is readily available for financial analysis. For example, information such as the market prices of securities of publicly traded corporations can be found in the financial press and the electronic media daily. Similarly, information on stock price indices for industries and for the market as a whole is available in the financial press.
Another source of information is economic data, such as the Gross Domestic Product (GDP) and Consumer Price Index (CPI), which may be useful in assessing the recent performance or future prospects of a company or industry. Suppose you are evaluating a company that owns a chain of retail outlets. What information do you need to judge the company's performance and financial condition? You need financial data, but it doesn't tell the whole story. You also need information on consumer spending, producer prices, consumer prices, and the competition. This is economic data that is readily available from government and private sources.
Besides financial statement data, market data, and economic data, you also need to examine events that may help explain the company's present condition and may have a bearing on its future prospects. For example, did the company recently incur some extraordinary losses? Is the company developing a new product or acquiring another company? Current events can provide information that may be incorporated into financial analysis.
The analyst must select the pertinent information, analyze it, and interpret the analysis, enabling judgments about the current and future financial condition and operating performance of the company. In this chapter, we introduce you to financial ratios—the tool of financial analysis. In financial ratio analysis, we select the relevant information—primarily the financial statement data—and evaluate it. We also show how to calculate and interpret financial ratios and warn you of the pitfalls that occur when they are not used properly. We will be using financial statements of E. I. DuPont de Nemours and Company (DuPont) for illustration purposes throughout this chapter. We provide DuPont's 2009 and 2010 balance sheets in Exhibit 4.1 and DuPont's 2009 and 2010 income statements in Exhibit 4.2.
EXHIBIT 4.1 DuPont Balance Sheet (in millions)
| 2010 | 2009 | |
| Cash and cash equivalents | $4,263 | $4,021 |
| Short-term investments | 2,538 | 2,116 |
| Cash and equivalents and short-term investments | $6,801 | $6,137 |
| Receivables | 5,635 | 5,030 |
| Inventories | 5,967 | 5,380 |
| Current tax assets | 534 | 612 |
| Prepayments | 122 | 129 |
| Total current assets | $19,059 | $17,288 |
| Gross property plant and equipment | $29,967 | $28,915 |
| Accumulated depreciation | 18,628 | 17,821 |
| Net property plant and equipment | $11,339 | $11,094 |
| Long-term investments | 1,145 | 1,126 |
| Intangible assets | 5,321 | 4,689 |
| Deferred long-term assets | 2,772 | 3,240 |
| Other assets | 774 | 748 |
| Total assets | $40,410 | $38,185 |
| Accounts payable | 4,360 | 3,542 |
| Accrued expenses | 4,671 | 4,188 |
| Current debt | 132 | 1,505 |
| Current lease obligations | 1 | 1 |
| Other current liabilities | 225 | 154 |
| Total current liabilities | $9,389 | $9,390 |
| LT debt and leases | $10,137 | 9,528 |
| Deferred LT liabilities | 115 | 126 |
| Minority interests | 465 | 436 |
| Other liabilities | 11,026 | 11,490 |
| Total liabilities | $31,132 | $30,970 |
| Common share capital | $301 | $297 |
| Preferred share capital | 237 | 237 |
| Additional paid-in capital | 9,227 | 8,469 |
| Retained earnings | 12,030 | 10,710 |
| Accumulated other comprehensive income | –5,790 | –5,771 |
| Treasury stock | 6,727 | 6,727 |
| Foreign currency translation | 213 | 219 |
| Other equity | –213 | –219 |
| Total equity | $9,278 | $7,215 |
| Total liabilities and equity | $40,410 | $38,185 |
| Source of data: DuPont, 10-K filings. | ||
EXHIBIT 4.2 DuPont Income Statement (in millions)
| 2010 | 2009 | |
| Total revenue | $32,733 | $27,328 |
| Direct costs | 23,146 | 19,708 |
| Gross profit | $9,587 | $7,620 |
| Selling general and administration | 3,669 | 3,440 |
| Research and development | 1,651 | 1,378 |
| Restructuring, remediation, and impairment | –34 | 210 |
| Operating income | $4,301 | $2,592 |
| Interest income | –590 | –408 |
| Earnings before tax | $3,711 | $2,184 |
| Taxation | 659 | 415 |
| Minority interests | 21 | 14 |
| Net income | $3,031 | $1,755 |
| Source: DuPont 10-K filings. The statements have been simplified for ease of presentation. | ||
WHAT ARE FINANCIAL RATIOS AND HOW DO WE USE THEM?
Suppose we wish to evaluate the performance of DuPont. And suppose we gather information about its earnings over time, as we show in Exhibit 4.3. What does this tell us? We learn that DuPont's net income increased over time, with a shift after 1997 and a decline in 2009. But does this tell us anything about whether these earnings are good, considering the capital that the company employs? Not at all.
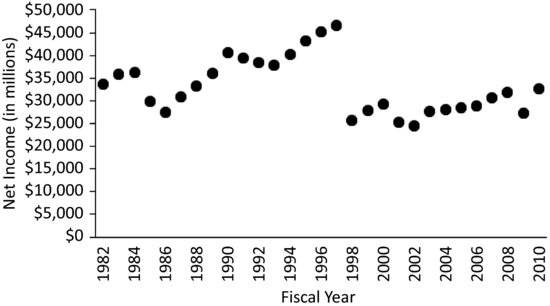
And though earnings are growing, is the profit margin constant or changing? We can't tell this from just looking at earnings. This is why in financial analysis we need to examine relations between and among the different accounts and then consider trends over time, how the company fares relative to competitors, and how company-specific events affect the performance and condition of the company.
A tool that we can use to help us examine relations between and among different financial accounts is financial ratio analysis. A financial ratio is simply an expression of the relation between two financial statement accounts and financial ratio analysis is the investigation of a company's condition and performance using one or more of these ratios. We use these ratios to get a measure of the relative value of one account to another. For example, we may want to know how much a company has invested in liquid assets. We can create a measure of this by comparing the current assets of the company—the liquid assets—to the total assets of the company. Or we could compare the current assets of the company with just the noncurrent assets of the company. Either way, we are getting a sense of the relative investment in liquid assets.
The value of a given financial ratio, however, is rarely informative. Financial ratios provide information when compared to other financial ratios and standards. For example, if we calculate the ratio of the company's current assets to its total assets, and arrive at 20%, is this good or bad? Does this mean that the company has sufficient liquid assets? We can't tell from this ratio alone. What else would we need to know to gauge whether this is sufficient liquidity for this company? We would want to know, for example, about the company's need for liquidity, whether the company is using its assets in the most effective manner, what is typical for a profitable company in this industry, how its investment in liquid assets has changed over time, and whether the company has debt covenants that require a specific minimum amount of liquid assets.
Once we calculate a financial ratio, we need to put it in perspective with the other aspects of the company's financial condition and performance, both over time and in comparison with other, leading companies in the same industry.
There are more financial ratios than there are different possible combinations of any two balance sheet, income statement, and statement of cash flow accounts. This means that there are too many to detail in this chapter. What we do in this chapter is focus on the most frequently used financial ratios that analysts use to capture the financial condition and performance of companies. Most of these ratios use balance sheet and income statement data, though a few require market data.
WHAT ARE THE DIFFERENT TYPES OF FINANCIAL RATIOS?
We can use financial ratios to examine the different dimensions of a company's financial condition and performance:
- Liquidity. How able is the company to satisfy its immediate obligations?
- Activity. Is the company getting the most use out of its asset deployment?
- Profitability. Is the company efficient in managing its expenses?
- Financial leverage. How reliant is the company on debt financing? Is the company expected to be able to satisfy its long-term obligations?
After looking at each of these dimensions, we take a look at return ratios, which bring these measures together in “bottom line” measures of a company's performance. In addition, we examine how we can use return ratios to evaluate how the different aspects of the company's financial condition and performance interact and affect the company's return on investment.
Liquidity Analysis
Liquidity in the context of financial analysis refers to a company's ability to satisfy its short-term obligations using assets that are most readily converted into cash. We refer to assets that may be converted into cash in a short period of time as liquid assets. These assets are listed in financial statements as current assets. Current assets are often referred to as working capital since they represent the resources needed for the day-to-day operations of the company's long-term, capital investments. Current assets are used to satisfy short-term obligations, or current liabilities. The amount by which current assets exceed current liabilities is the company's net working capital.
The Role of the Operating Cycle
How much liquidity a company needs depends on its operating cycle. The operating cycle is the duration between the time cash is invested in goods and services to the time that investment produces cash. For example, a company that produces and sells goods has an operating cycle comprising four phases, as we diagram in Exhibit 4.4.
EXHIBIT 4.4 The Operating Cycle
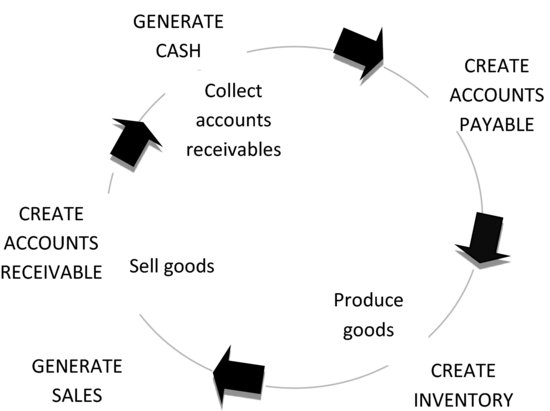
The operating cycle is the length of time it takes to convert an investment of cash in inventory back into cash through the collections on sales. Considering that not all purchases a company makes are paid immediately with cash, we can use another cycle metric, the net operating cycle, to capture the length of time it takes to convert an investment of cash in inventory and back into cash considering that some purchases are made on credit.
The number of days a company ties up funds in inventory is determined by the:
- Total amount of money represented in inventory.
- Average day's cost of goods sold.
The current investment in inventory—that is, the money “tied up” in inventory—is the ending balance of inventory on the balance sheet. The average day's cost of goods sold is the cost of goods sold on an average day in the year, which can be estimated by dividing the cost of goods sold found on the income statement by the number of days in the year.
We compute the number of days of inventory by calculating the ratio of the amount of inventory on hand (in dollars) to the average day's cost of goods sold (in dollars per day):

If the ending inventory is representative of the inventory throughout the year, the number-of-days-inventory tells us the length of time it takes to convert the investment in inventory into sold goods. Another way of looking at this metric is that it tells us how long the company can continue to generate sales with its existing inventory.
Why do we care about whether the year-end inventory is representative of inventory at any day throughout the year? Because, if inventory at the end of the fiscal year is lower than on any other day of the year, we have understated the number-of-days-of-inventory for the year. Most companies try to choose fiscal year-ends that coincide with the slower period of their business, which means that the ending balance of inventory is likely lower than the typical daily inventory of the year. To remedy this, we could look at quarterly financial statements and take averages of quarterly inventory balances to get a better idea of the typical inventory. However, for simplicity in this and other ratios, we make a note of this problem and deal with it later in the discussion of effective use of financial ratios.
We extend the same logic from the inventory turnover to estimate the number of days between a sale—when an account receivable is created—to the time it is collected in cash. If the ending balance of receivables at the end of the year is representative of the receivables on any day throughout the year, then it takes, on average, approximately the number-of-days-receivable to collect the accounts receivable, or “number-of-days-credit”:
What does the number-of-days-receivable tell us?
- Comparing the number-of-days-receivable with the company's credit policy, we can draw conclusions about whether the company is collecting on accounts consistent with their policy.
- Comparing the number-of days-receivable of the company with that of its competitors can tell us about whether the credit policy of the company—with respect to both credit granting and collections—is more or less generous than its customers.
Adding the number-of-days inventory and the number-of-days-receivable produces the operating cycle, which is the length of time it takes for the investment of cash in inventory to produce cash through collections of account. What does the operating cycle have to do with liquidity? The longer the operating cycle, the more current assets are needed (relative to current liabilities) because it takes longer to convert inventories and receivables into cash. In other words, the longer the operating cycle, the more net working capital required.
We also need to look at the liabilities on the balance sheet to see how long it takes a company to pay its short-term obligations. We can apply the same logic to accounts payable as we did to accounts receivable and inventories. How long does it take a company, on average, to go from creating a payable (buying on credit) to paying for it in cash? The number of days of payables:

First, we need to determine the amount of an average day's purchases on credit. If we assume all purchases are made on credit, the total purchases for the year would be the cost of goods sold, less any amounts included in this cost of goods sold that are not purchases.1
The operating cycle tells us how long it takes to convert an investment in cash back into cash (by way of inventory and accounts receivable):
![]()
The number of days of payables tells us how long it takes to pay on purchases made to create the inventory. If we put these two pieces of information together, we can see how long the company ties up cash. The difference between the operating cycle and the number of days of payables is the net operating cycle:
![]()
or, substituting for the operating cycle,
![]()
The net operating cycle is an estimate of how long it takes for the company to get cash back from its investment in inventory and accounts receivable, considering that purchases may be made on credit. By not paying for purchases immediately (that is, using trade credit), the company reduces its liquidity needs. Therefore, the longer the net operating cycle, the greater the company's required liquidity. We provide the components of the net operating cycle for DuPont for 2010 in Exhibit 4.5.
EXHIBIT 4.5 Net Operating Cycle Components for DuPont, 2010
Measures of Liquidity
Liquidity ratios provide a measure of a company's ability to generate cash to meet its immediate needs. The two most commonly used liquidity ratios are the current ratio and the quick ratio. The current ratio is the ratio of current assets to current liabilities. This ratio indicates a company's ability to satisfy its current liabilities with its current assets:
![]()
The quick ratio (a.k.a. acid test ratio) is the ratio of quick assets (generally current assets less inventory) to current liabilities. This ratio indicates a company's ability to satisfy current liabilities with its most liquid assets:
![]()
Generally, the larger these liquidity ratios the better the ability of the company to satisfy its immediate obligations. Is there a magic number that defines good or bad? Not really.
Consider the current ratio. A large amount of current assets relative to current liabilities provides assurance that the company will be able to satisfy its immediate obligations. However, if there are more current assets than the company needs to provide this assurance, the company may be investing too heavily in these non- or low-earning assets and therefore not putting the assets to the most productive use.
Another consideration is the operating cycle. A company with a long operating cycle may have more need for liquid assets than a company with a shorter operating cycle. We provide the current and quick ratios for DuPont for 2010 in Exhibit 4.6.
EXHIBIT 4.6 Liquidity Ratios for DuPont, 2010
Activity Ratios
Activity ratios are measures of how well assets are used. Activity ratios can be used to evaluate the benefits produced by specific assets, such as inventory or accounts receivable. Or they can be used to evaluate the benefits produced by all a company's assets collectively. The most common turnover ratios are the inventory turnover, the total asset turnover, and the accounts receivable turnover.
Inventory turnover is the ratio of cost of goods sold to inventory. This ratio indicates how many times inventory is created and sold during the period:
![]()
Ideally, the inventory amount in the denominator reflects the average inventory during the period. Because many companies have seasonality in their revenues and fiscal year ends are typically chosen to be at the lowest point of a company's operating cycle, the amount of inventory on a company's annual balance sheet is not representative of the inventory they tend to carry during the year. Therefore, we would want to use an average inventory amount in the calculation of this ratio.2 However, when we are on the outside looking in, as is often the case in financial analysis, we must use annual inventory or the average of the quarterly inventory to estimate this turnover ratio.
The inventory turnover is an estimate of how many times during the period that inventory is created or purchased and sold. If we are using annual cost of goods sold and an average annual inventory, the ratio is a measure of the number of times inventory is created and sold during the year.
Is any particular number for an inventory turnover ratio good or bad? No, because the appropriate turnover varies by product line. What is important is the interaction of turnover and profitability, which then influence the returns on the company's or owners' investment.
You will notice a relation between the inventory turnover and the number of days of inventory:
![]()
Suppose a company has cost of goods sold of $100 and an inventory of $10. Then,
- The inventory turnover is 10 times.
- The number of days inventory is $10/($100/365) = $10/$0.274 = 36.5 days.
- Inventory turnover × Number of days inventory = 10 × 36.5 = 365.
Accounts receivable turnover is the ratio of net credit sales to accounts receivable. This ratio indicates how many times in the period credit sales have been created and collected on:
![]()
The amount of sales on credit in the numerator is an estimate of the amount of sales that the company makes on credit to customers. This amount is not reported on financial statements, though an analyst may estimate this by evaluating the customs of trade credit in the particular industry. The denominator should reflect the average accounts receivable throughout the period.
The accounts receivable turnover is a measure of the number of times accounts receivables have been created—through the sale of goods on credit—and extinguished through customer payments during the period. In other words, this estimate helps us gauge how long it takes customers to pay, on average, during the period. If the turnover is, say, 12 times, we know that it takes customers approximately 30 days to pay on their accounts. This ratio is therefore quite useful in assessing a company's credit policy.
Total asset turnover is the ratio of revenues to total assets:
![]()
This ratio indicates the extent that the investment in total assets results in revenues. The resultant number is a multiplier of the revenues that are generated for the investment in total assets. For example, if assets are $100 million and revenues are $125 million, the total asset turnover is 1.25, meaning that $1.25 of revenues are generated per $1 of asset investment.
As with any other ratio, the total asset turnover cannot be judged in isolation, but rather must be considered in conjunction with other dimensions of the company's condition and performance, the trend of the ratio over time, and industry norms.
A turnover ratio may be constructed to evaluate the use of any set of assets by comparing the gross benefit to the assets employed. For example, if you wish to focus on a company's fixed assets, you can construct a fixed asset turnover as the ratio of revenues to net plant and equipment. We calculate several turnover ratios for DuPont and provide these ratios in Exhibit 4.7. The actual values for a given point in time are not very meaningful. What we would want to do in a thorough analysis is compare these turnovers over time for DuPont and compare these values with DuPont's competitors.
EXHIBIT 4.7 Activity and Turnover Ratios for DuPont, 2010

Profitability Analysis
Profitability ratios (also referred to as profit margin ratios) compare components of income with revenues. They give us an idea of what makes up a company's income and are usually expressed as a portion of each dollar of revenues. The profit margin ratios we discuss here differ only by the numerator. It is in the numerator that we reflect and thus evaluate performance for different aspects of the business:
- The gross profit margin is the ratio of gross income or profit to revenues. This ratio is a measure of how much of every dollar of revenues is left after costs of goods sold:

- The operating profit margin is the ratio of operating profit (a.k.a. earnings before interest and taxes, EBIT, operating income, income before interest and taxes) to revenues. This is a ratio that indicates how much of each dollar of revenues is left over after operating expenses:
- The net profit margin is the ratio of net income (a.k.a. net profit) to revenues, and indicates how much of each dollar of revenues is left over after all expenses:
Profit margins alone do not tell us much about the company's performance or its ability to generate profits in the future. Additional information that we would need include the trend in these profit margins over time, the company's turnover ratios and the trends in these ratios, and the industry norms.
Consider DuPont's profit margins, which we provide in Exhibit 4.8. The gross profit margin appears to be significant. However, DuPont is a chemical company whose costs of its goods are spread primarily between two items: cost of goods sold and the research and development expenses. Therefore, it is more appropriate in the analysis of DuPont to focus on the operating profit margin, rather than the gross profit margin.
EXHIBIT 4.8 Profit Margins for DuPont, 2010

Financial Leverage
A company can finance its assets either with equity or debt. Financing through debt involves risk because debt legally obligates the company to pay interest and to repay the principal as promised. On the other hand, equity financing does not obligate the company to pay anything; dividends are paid at the discretion of the board of directors.
There is always some risk, which we refer to as business risk, inherent in any operating segment of a business. But how a company chooses to finance its operations—the particular mix of debt and equity, its capital structure—may add financial risk on top of business risk. Financial risk is the extent that debt financing is used relative to equity. The greater the company's use of debt in its capital structure, the greater its risk.
We use financial leverage ratios to assess how much financial risk the company has taken on. There are two types of financial leverage ratios: component percentages and coverage ratios. Component percentages compare a company's debt with either its total capital (debt plus equity) or its equity capital. Coverage ratios reflect a company's ability to satisfy fixed obligations, such as interest, principal repayment, or lease payments.
Component Percentage Financial Leverage Ratios
The component-percentage financial leverage ratios convey how reliant a company is on debt financing:
- The debt-to-assets ratio is a measure of the proportion of assets that are financed with interest-bearing obligations (both short-term and long-term debt):
- The long-term debt-to-assets ratio is the proportion of the company's assets that are financed with long-term debt:
- The debt-to-equity ratio, also known as the debt ratio, indicates the relative uses of debt and equity as sources of capital to finance the company's assets, evaluated using book values of the capital sources:
- The equity multiplier, which is the ratio of total assets to shareholders' equity:
In the case of each of these leverage ratios, the greater this ratio, the greater the company's use of financial leverage.
One problem with looking at risk through a financial ratio that uses the book value of equity is that most often there is little relation between the book value and its market value. The book value of equity consists of the:
- Proceeds to the company of all the stock issued since it was first incorporated, less any treasury stock (stock repurchased by the company).
- Accumulation of all the earnings of the company, less any dividends, since it was first incorporated.
The book value generally does not give a true picture of the investment of shareholders in the company because:
- Earnings are recorded according to accounting principles, which may not reflect the true economics of transactions.
- Due to inflation, the dollars from earnings and proceeds from stock issued in the past do not reflect today's values.
The market value, on the other hand, is the value of equity as perceived by investors. It is what investors are willing to pay, its worth. So why bother with the book value of equity? For two reasons: First, it is easier to obtain the book value than the market value of a company's securities; second, many financial services report ratios using the book value rather than the market value.
We may use the market value of equity in the denominator, replacing the book value of equity. To do this, we need to know the current number of shares outstanding and the current market price per share of stock and multiply it to get the market value of equity.
Coverage Ratios
In addition to the financial leverage ratios that use information about how debt is related to either assets or equity, there are a number of financial leverage ratios that capture the ability of the company to satisfy its debt or fixed financing obligations. There are many ratios that accomplish this, but the two most common ratios are the times-interest-earned coverage ratio and the fixed charge coverage ratio.
The times-interest-earned coverage ratio, also referred to as the interest coverage ratio, compares the earnings available to meet the interest obligation with the interest obligation:
![]()
The assessment of the coverage of financial obligations may be expanded to include other obligations, for example, a fixed charge coverage ratio can be constructed to include any fixed charges such as lease payments and preferred stock dividends.3 For example, to gauge a company's ability to cover its interest and lease payments, you could use the following ratio:
![]()
Coverage ratios are often used in debt covenants to help protect the creditors because they require that interest be “covered,” along with a cushion. For example, requiring a two-times interest coverage ratio results in a cushion equal to the interest commitment.
Recapping
We provide several of the financial leverage measures for DuPont in Exhibit 4.9 for 2010. These ratios are just a part of the analysis of how reliant a company is on debt versus equity financing. For example, a debt-to-assets ratio of 0.254 is neither good nor bad; we would need to put this in perspective, considering DuPont's profitability, tax situation, trends, and business risk, among other factors. We do know that a little over 25% of its assets are financed with debt, and that DuPont can cover its interest obligation seven times over.
EXHIBIT 4.9 Debt Ratios for DuPont, 2010

Shareholder Ratios
The ratios we have explained up to this point deal with a company's performance and financial condition. These ratios provide information for managers (who are interested in evaluating the performance of the company) and for creditors (who are interested in the company's ability to pay its obligations). We will now take a look at ratios that focus on the interests of the owners—shareholder ratios. These ratios translate the overall results of operations so that they can be compared in terms of a share of stock.
Earnings per Share
Earnings per share (EPS) is the amount of income earned during a period per share of common stock:
![]()
There are two numbers of earnings per share that are currently disclosed in financial reports: basic and diluted earnings per share. These numbers differ with respect to the definition of available net income and the number of shares outstanding.
Companies provide information on EPS in their annual and quarterly financial statement information, as well as in their periodic press releases. Generally, EPS is calculated as net income, divided by the number of shares outstanding.
Companies must report both basic earnings per share and diluted earnings per share. These earnings per share calculations replace the previous requirement of simple, primary, and fully diluted EPS.
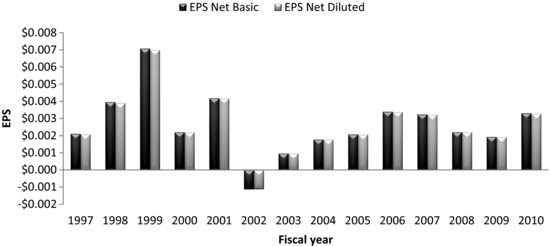
Basic earnings per share are net income, minus preferred dividends, divided by the average number of shares outstanding. Diluted earnings per share are net income, minus preferred stock dividends, divided by the number of shares outstanding considering all dilutive securities (e.g., convertible debt, options).4 Diluted earnings per share, therefore, gives the shareholder information about the potential dilution of earnings. For companies with a large number of dilutive securities (e.g., stock options, convertible preferred stock or convertible bonds), there can be a significant difference between basic and diluted EPS. You can see the effect of dilution—which is minimal—by comparing the basic and diluted EPS for DuPont in Exhibit 4.10.
EXHIBIT 4.10 DuPont's Earnings per Share, 1997-2010
Source of data: DuPont, 10-K filings various years.
Book and Market Values per Share
The book value equity per share is the amount of the book value (a.k.a. carrying value) of common equity per share of common stock, calculated by dividing the book value of shareholders' equity by the number of shares of stock outstanding. As we discussed earlier, the book value of equity may differ from the market value of equity quite substantially. The market value per share, if available, is a much better indicator of the investment of shareholders in the company.
We can also compare the book value and the market value of a company, forming either the market-to-book value ratio or the book-to-market value ratio. For example,
![]()
However, because the book value of equity is such a poor measure of the net assets of a company, this ratio may not be very informative. In the case of DuPont, for example, there are many valuable assets that it owns that are not reflected on the balance sheet (i.e., drug patents) and, hence, in the book value of equity.5
Price-Earnings Ratio
The price-earnings ratio (P/E or PE ratio) is the ratio of the price per share of common stock to the earnings per share of common stock:
![]()
The earnings per share typically used in the denominator are the sum of the earnings per share for the last four quarters. In this case, the P/E ratio is often referred to as the trailing P/E. In contrast, the leading P/E or projected P/E ratio is calculated using earnings per share estimated for the next four quarters.
The P/E ratio is sometimes used as a proxy for investors' assessments of the company's ability to generate cash flows in the future. Historically, P/E ratios for U.S. companies tend to fall in the 10 to 25 range. If the company has no or negative earnings, the P/E that you calculate is meaningless.
Dividend Ratios
A financial analyst is often interested in how much of a company's earnings are paid out to investors. There are two common measures that address this, the dividends per share and the dividend payout ratio. Dividends per share (DPS) are the dollar amounts of cash dividends paid during a period, per share of common stock:
![]()
This represents the amount paid out in cash during a given period, but does not reflect noncash distributions such as stock dividends.
Another gauge of dividends is the proportion of earnings that a company pays out in the form of cash dividends: the dividend payout. The dividend payout ratio is the ratio of cash dividends paid to earnings for a period:
![]()
The dividend payout ratio is the complement of the plowback ratio,
![]()
which captures the proportion of earnings that are reinvested into the company.
We often describe a company's dividend policy in terms of either its dividend per share or its dividend payout ratio. Some companies' dividends appear to follow a pattern of constant or constantly growing dividends per share. And some companies' dividends appear to be a constant percentage of earnings. We provide the dividends per share and dividend payout for DuPont Inc. in Exhibit 4.11 for the period 1990–2005. DuPont appears to maintain a constant dividend or a dividend that grows slightly in terms of the dividend per share. In terms of the dividend payout, DuPont has a typical payout around 49%, but the payment of dividends even in loss years (1992 and 2002) and the payment of dividends when earnings are low (1993 and 2003) result in a payout ratio that is not level through time.

ANALYSIS OF RETURN-ON-INVESTMENT RATIOS
Return-on-investment ratios allow us to compare benefits generated from investments. The benefit is represented in the numerator, and the resources affecting that benefit, such as the total assets of the company, are represented in the denominator.6 There are a number of return-on-investment ratios available for analysis. We look at three of these return ratios: operating return on assets, return on assets, and return on equity.
Return Ratios
The operating return on assets is the ratio of operating earnings to assets:7
![]()
It is a measure of the operating income resulting from the company's investment in total assets and is useful when comparing companies that are in the same line of business.
The return on assets is the ratio of net income to assets and indicates the company's net profit generated per dollar invested in total assets:
![]()
This is a measure of what the company receives, as a whole, from the investment it has made in assets.
The return on equity is the ratio of net income to shareholders' equity and represents the profit generated per dollar of shareholders' investment (i.e., shareholders' equity):
![]()
The difference between the return on assets and the return on equity is the investment that is considered; the return on equity is affected by the capital structure of the company:
The ratio of total assets to shareholders' equity is the equity multiplier, a measure of a company's use of financial leverage: the greater the use of debt, vis-à-vis equity, the greater the equity multiplier. Therefore, the greater the use of debt, the greater the difference between the return on assets and return on equity for a given fiscal period.
We can also be more specific in terms of the type of equity. For example, we can construct a return on common equity, which is the ratio of net income available to common shareholders to common shareholders' equity:
![]()
This return is the profit generated per dollar of common shareholders' investment (that is, common shareholders' equity).
We provide the calculated values of these return metrics in Exhibit 4.12 for DuPont. As we shall see shortly, we can relate these “bottom line” measures of performance to the different financial aspects of the company's financial performance and condition.
EXHIBIT 4.12 Return on Investment Ratios for DuPont, 2010

An additional return to consider is the return on invested capital. Simply put, it is income from operating activities, less related taxes, divided by invested capital. Invested capital is the sum of all of the sources of long-term funding of the company, including equity and interest-bearing debt. However, because the numerator and denominator of this return are not reported directly on the financial statements, we must first calculate these amounts using reported accounts, making some assumptions.
The numerator is the after-tax operating income, also referred to as net operating profit after taxes (NOPAT). One approach is to start with net income and then add nonrecurring costs, interest expense, and taxes paid on investment and interest income. We could also start with operating income and then subtract estimated taxes on operating income. We have to make some assumptions regarding the last item in this calculation, whether we calculate this starting with net income or operating income.8 Generally, we use the effective tax rate (given in a footnote to the financial statements).
Starting with operating income and using the effective rate of tax of 19%, as provided in DuPont's Note 5 to its 2010 financial statement, we calculate operating profit after taxes of:
| Operating income | $4,301 |
| Less: taxes on operating income, at 17.758% | 764 |
| Operating income after taxes | $3,537 |
The invested capital for DuPont is all permanent sources of capital,9
| Interest bearing short-term debt | $132 |
| Long-term debt | 10,137 |
| Shareholders' equity | 9,278 |
| Total capital | $19,547 |
The return on invested capital for DuPont in 2010 is therefore:
![]()
The return on invested capital is a measure of the company's ability to put all its financial capital to work, regardless of how the company chooses to finance its assets; generally, the greater the return on invested capital, the better the performance of the company.
The DuPont System
The DuPont system was developed by E.I. DuPont Nemours as a means of relating the company's performance to specific aspects of the management of the company. In its simplest form, this system is a method of breaking down the return ratio into its profit margin and turnover components.
Suppose the return on assets changes from 20% to 10%. We do not know whether this decreased return is due to a less efficient use of the company's assets—that is, due to lower activity—or to lower profit margins. A lower return on assets could be due to lower activity, lower margins, or both. Because we are interested in evaluating past operating performance to evaluate different aspects of the management of the company or to predict future performance, knowing the source of these returns is valuable information. The DuPont system allows us to break down the return ratios into components, identifying the sources of the changes in returns.
For example, we can break down the operating return on assets and the return on assets both into two components, margin and turnover:10

By looking at the components, turnover and profit margin, and their changes from year to year, we get a better idea of what is behind changes in returns from year to year. Similarly, the return on shareholders' equity can be broken down into three components:
We can break down any return ratio into its components, reducing the ratio to their smallest components. For example, the return on equity can be broken down into five components: asset turnover, operating profit margin, fixed financial charge burden, tax burden, and financial leverage, as we demonstrate in Exhibit 4.13 in equation form and in Exhibit 4.14 using DuPont's 2010 return on equity components.
EXHIBIT 4.13 The DuPont Breakdown of the Return on Assets
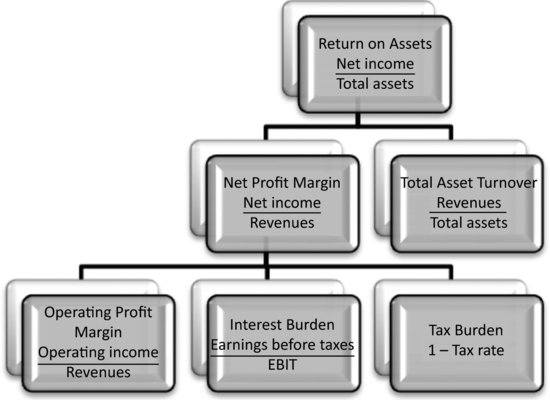
EXHIBIT 4.14 The Return on Equity For DuPont for 2010, Broken Down into Components Using the DuPont System

We can use the DuPont system to diagnose the source of change in returns over time. Consider Borders, a book retailer that operated Borders and Waldenbooks retail stores. Borders filed for bankruptcy on February 16, 2011.
We graph Borders' return on assets in Exhibit 4.15(A). As you can see, the company was generating losses beginning in 2006. What was the source of Border's woes? There is usually not just one source of a company's financial difficulties, but using the DuPont system allows us to get some idea of what led to Border's challenges.

Looking at its asset turnover and net profit margin for the 15 years leading up to bankruptcy, as we show in Exhibit 4.15(B), we can begin getting an idea of what led to its problems.
We can see in Exhibit 4.15(B) that the total asset turnover did not change much through 2007, and increased after that fiscal year. Looking at Border's net profit margin, as shown in Exhibit 4.15(C), we see that the changes in the net profit margin appear to have been a strong influence on Border's returns.
What does this mean? What we surmise from this analysis is that Border's difficulties are related to the management of expenses. If we wanted to get a more detailed look, we could break the net profit margin into components of the operation profit margin, the interest burden, and the tax burden to see why the net profit margin changed over time. We may also want to investigate further why the asset turnover changed dramatically after 2007, focusing specifically on Border's inventory turnover.
HOW CAN WE USE COMMON-SIZE ANALYSIS TO ANALYZE FINANCIAL STATEMENTS?
Common-size analysis is the analysis of financial statement items through comparisons among these items. In common-size analysis, we compare each item in a financial statement with a benchmark item:
- For the income statement, the benchmark is revenues. For a given period, each item in the income statement is restated as a percentage of revenues.
- For the balance sheet, the benchmark is total assets. For a given point in time, each item in the balance sheet is restated as a percentage of total assets.
To see how this works, consider DuPont's financial statements. We have restated the income statements for 2009 and 2010 in Exhibit 4.16, restating each income statement item as a percentage of revenues.11 In an analysis of this statement, we focus on the changes from year to year, looking for explanations for changes in company-specific events, economic, and market events.
EXHIBIT 4.16 DuPont, Common-Size Income Statement, 2009–2010 (Stated as Percentage of Revenues)
| Common-Size Statement Stated as Percentage of Revenues | ||
| 2010 | 2009 | |
| Revenues | 100.000% | 100.000% |
| Cost of goods sold | 70.712% | 72.117% |
| Gross profit | 29.288% | 27.883% |
| Selling, general, and administrative expenses | 11.209% | 12.588% |
| Research and development expenses | 5.044% | 5.042% |
| Restructuring, remediation, and impairment | −0.104% | 0.768% |
| Operating income | 13.140% | 9.485% |
| Interest expense and other nonoperating | ||
| earnings before income taxes | 11.337% | 7.992% |
| Income tax | 2.013% | 1.519% |
| Net income | 9.260% | 6.422% |
The common size analysis of an income statement over several periods gives us an idea of how the company's management of its expenses changes from one period to the next.
In a similar manner, we can restate each balance sheet item as a percentage of total assets and then make year-to-year comparisons. Examining changes in the asset composition tells us about how the company is altering its investments; examining changes in the liabilities and equity tells us about how the company is altering its capital structure.
INTEGRATED RATIO ANALYSIS
Financial analysis requires pulling together many pieces of information. Analysis of a company requires gathering information that includes:
- A description of the company, including its line(s) of business, and major corporate events, such as acquisitions and divestitures.
- The industry or industries in which it operates and its major competitors.
- Major factors (e.g., economic, competitive, or legal) that have affected the company in the recent past and may affect the company going forward.
- Relevant financial ratios for at least the past 5 years, but preferably the past 10 years.
- Common-size analysis over the past 5 to 10 years.
A thorough analysis of a company would require more space than we can allow here, but we can present the basic financial ratio analysis and common-size analysis. We use DuPont as an example, using published annual financial data.
Company Description, Industry, and Major Factors
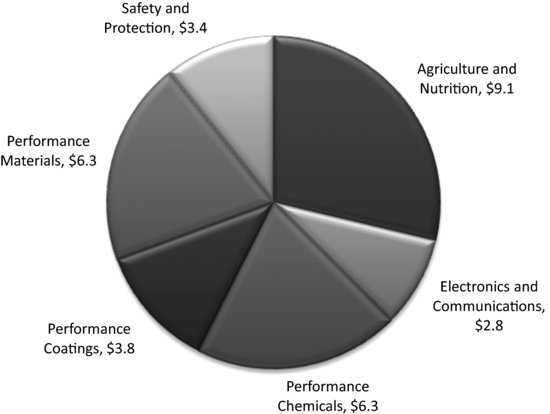
E. I. DuPont De Nemours and Company is a company's whose main business line is chemicals, but the company has a significant investment in agriculture and biotechnology, and considers itself to be a science and technology focused company. We provide a breakdown of DuPont's revenues by reported segment in Exhibit 4.17.
EXHIBIT 4.17 DuPont's 2010 Revenues by Segments, in Billions
Source of data: DuPont, 2010 10-K filing.
Its Industry
DuPont's primary line of business is chemicals, but it could very well be described as a conglomerate because of its lines of business extending into agriculture (e.g., seeds), electronics (e.g., cell phone displays) and safety and protection, with well-known products including Teflon, Corian, and Kevlar.
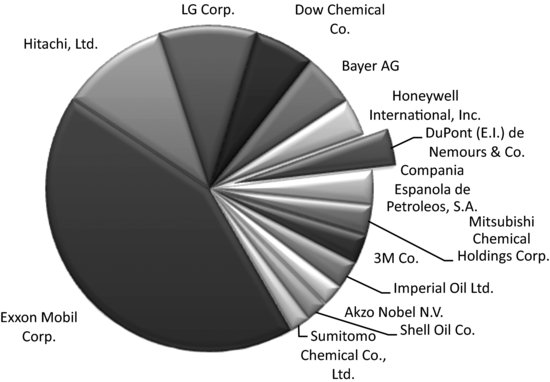
If we look at the chemical industry globally, we see that DuPont is a significant U.S. participant in this industry, but the industry is dominated by Exxon Mobil, which is an oil and gas company with significant specialty chemical and research segments. We provide a breakdown of the industry by the major players in Exhibit 4.18. Other large competitors who have major chemical segments include Hitachi and LG. Likely the most comparable company is Dow Chemical, which is a large U.S. chemical company.
Interpreting trends in ratios requires understanding the primary events that affect the company's performance and condition. Major events affecting DuPont's financial history include:
- DuPont acquired Conoco, Inc. in 1981. This acquisition provided a key source of petroleum, which is an ingredient in many of DuPont's products. Due to a bidding war for Conoco, Seagram's Company became a major shareholder in DuPont through its holdings of Conoco. DuPont bought these holdings from Seagram in 1995, and then divested itself of Conoco in transactions in 1998 and 1999. The acquisition of Conoco and its subsequent divestiture, changed the product mix of DuPont and, as you will see, its financial complexion.
- DuPont's many products from its research affected its fortunes. DuPont introduced Stainmaster™ in 1986, replacement refrigerants for ozone-depleting refrigerants starting in 1990, Sorona™ polymer in 2000, and Solae™ soy protein in 2001, to name a few.
- In 2000, DuPont sold its DuPont Textiles and Interiors division, which produces material with the DuPont developed Lycra, Stainmaster™, Coolmax™, and other specialty fibers.
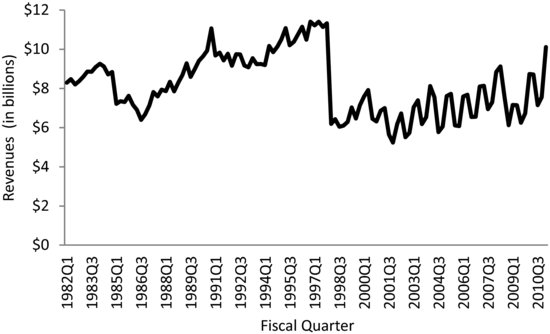
DuPont's revenues, especially after 1999, are seasonal, with the highest revenues in the first quarter of a year and the lowest in the third quarter, as you can see in Exhibit 4.19. The drop in revenues in the first quarter of 1997 is due to a number of factors, including DuPont's exit from a number of joint ventures and a downturn in prices of its products.
EXHIBIT 4.19 Seasonality In DuPont's Revenues, First Quarter 1982 Through Fourth Quarter 2010
Source of data: DuPont, 10-Q filings.
Financial Ratios
Liquidity
We provide a graph of DuPont's liquidity ratios in Exhibit 4.20. The current and quick ratios follow similar trends over the years 1990–2010, with a drop-off in the years 1995–2000, but a recovery following the Conoco divestiture.
EXHIBIT 4.20 Liquidity Ratios of DuPont, 1982–2010
Source of data: DuPont, annual reports, various years.
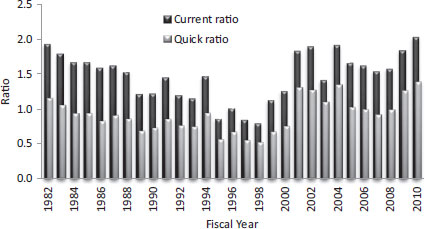
The difference between the quick and current ratios is the numerator, where the quick ratio excludes inventory. If the distance between the quick and current ratios changes over time, as it does with DuPont, this indicates a changing importance of inventory in current assets over time.
Activity
We provide the turnover ratios for DuPont for the years 1982–2010 in Exhibit 4.21. The change after 1997 indicates the change in the company's product mix with the divestiture of Conoco.
EXHIBIT 4.21 Activity Ratios of DuPont, 1982-2010
Source of data: DuPont, annual reports, various years.

Profitability
As you can see in Exhibit 4.22, the profit margins of DuPont have increased over time, with the drop-off in the 2003 fiscal year, which may be attributed, in part, to changes in product mix from merger-related activities.
EXHIBIT 4.22 Profitability Ratios of DuPont, 1982–2010
Source of data: DuPont, annual reports, various years.

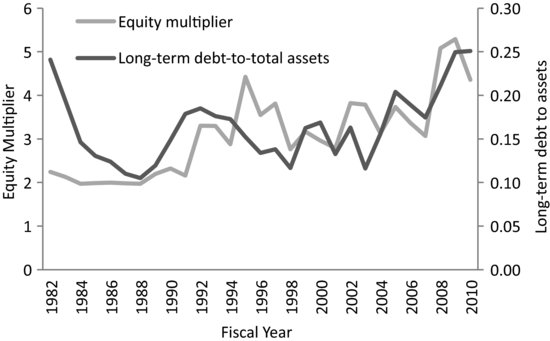
Financial Leverage
DuPont's use of debt has varied over the period 1990–2010, as we show in Exhibit 4.23, with a general increase in the latter years. These two ratios, the long-term debt to assets and the equity multiplier, both provide information regarding the relative use of debt, but provide slightly different information: the equity multiplier includes the effects of both short- and long-term liabilities, whereas the long-term debt-to-assets ratio includes only debt and only the long-term portion.
EXHIBIT 4.23 DuPont's Financial Leverage Ratios, 1982–2010
Source of data: DuPont, annual reports and 10-K filings, various years.
A company's debt rating is affected by its ability to handle its debt obligations. DuPont's debt is A-rated by Fitch and Standard & Poor's, and A2 by Moody's. An A rating is considered investment grade.
DuPont's short-term borrowing is rated P-1 by Moody's, A-1 by Standard and Poor's, and F-1 by Fitch.12 This indicates that DuPont's short-term obligations have minimal credit risk.
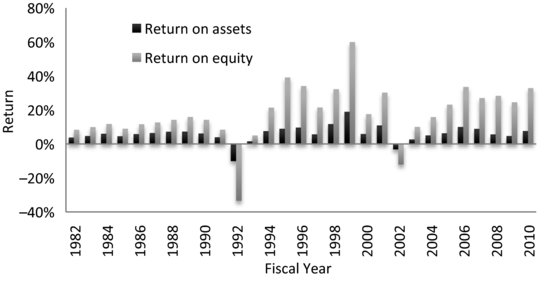
Return and the DuPont Analysis
We plot the return on equity and return on assets for DuPont for the years 1982–2010 in Exhibit 4.24. Both the return on assets and the return on equity are wide-ranging during these years.
EXHIBIT 4.24 Return on assets and return on equity for DuPont, 1982–2010
Source of data: DuPont, Annual Reports and 10-K filings, various years.
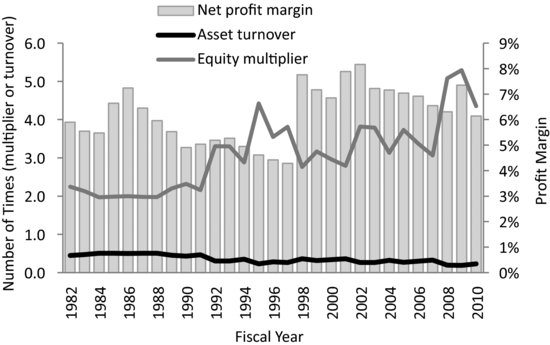
We provide a breakdown of the return on equity into the three components of net profit margin, asset turnover, and financial leverage, and graph these components in Exhibit 4.25. The DuPont breakdown suggests that the increased volatility of returns in the post-1999 period are attributed to the more volatile efficiency in managing expenses, as represented by the net profit margin.
EXHIBIT 4.25 DuPont Components for DuPont, 1982–2010
Source of data: DuPont, annual report and 10-K filings, various years.
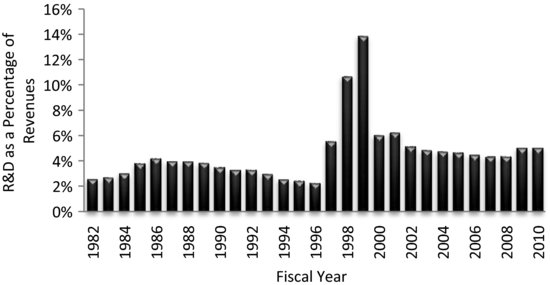
Other Factors
The other factors that we look at for a company depend on, for example, the company's line or lines of business, its position in the industry, government regulation and changes thereof, major acquisitions and divestitures, and the sensitivity of its profitability to changes in the economic environment.
DuPont depends on its development of new products and patents, so one aspect of this company that we look at is its research and development (R&D). We present DuPont's R&D as a percentage of revenues in Exhibit 4.26. As you can see, the relation between R&D and revenues changed as the company acquired and then divested itself of Conoco. Before Conoco, the typical R&D expenditure was around 3% of revenues, whereas after Conoco, it was around 5%.
EXHIBIT 4.26 DuPont's R&D as a Percentage of Revenues, 1982-2010
Source of data: DuPont, annual report and 10-K filings, various years.
Common-Size Analysis
We can gain another perspective of the company's performance and condition through a common-size analysis of the income statement and balance sheet. We provide the common size income statement in Exhibit 4.27 and the common size balance sheet in Exhibit 4.28.
EXHIBIT 4.27 Common-Sized Income Statements, DuPont Company, 1982–2010
Source of data: DuPont, annual reports, various years.
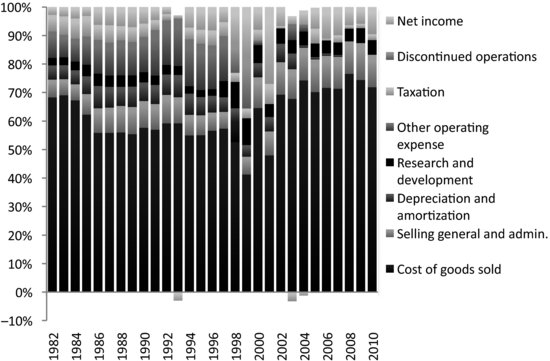
EXHIBIT 4.28 Common-Sized Balance Sheet, DuPont Company, 1982–2010
Source of data: DuPont, annual reports, various years.

In Exhibit 4.27, we can see the trends in the expenses and net income of the company. With the exception of 2003, we can see that the operating costs have declined over time. The effects of the mergers, in terms of merger-related expenses, can be seen in the change in the non-operating expenses in 2003 and 2010.
We can also see effects of the mergers in the common size balance sheets, as we show in Exhibit 4.28(A).
WHAT ARE THE PITFALLS AND PRATFALLS OF FINANCIAL RATIO ANALYSIS?
It is an easy matter to obtain and manipulate financial data. But the important and more challenging task of making sense out of all the analysis remains. There are numerous issues that arise in analyzing and comparing financial ratios across time and across companies. These issues include:
- The use of accounting data, which is generally stated using historical costs.
- Selecting the ratios to analyze and interpreting ratios appropriately for the company and the industry.
- Choosing a benchmark for comparisons, whether the industry as a whole, major competitors, or some set of aspirant or competing companies.
- The use of ratios in forecasting future performance.
The Use of Accounting Data
There are a number of issues that arise simply from the fact that much of the financial data we use in analysis is accounting information. The problems associated with using reported accounting data include:
- Use of historical costs and inflation. Accounting data are not adjusted for inflation and represent historical cost instead of current or replacement costs for most assets. It is likely that the reported book value of assets do not reflect the market value or replacement value of a company's assets.
- Different methods of accounting. Companies may select from alternative accounting procedures (e.g., LIFO vs. FIFO), which makes comparisons among companies difficult. The analyst must often look beyond the basic financial statement information to remove distortions that may arise from specific accounting practices.
- Changes in accounting principles. Accounting principles change over time.
- The occurrence of extraordinary and special items. The analyst must determine whether the effects of extraordinary and special items should be included in the analysis. In recent years, extraordinary items have become quite “ordinary,” with some companies reporting extraordinary items each year.
- The difficulty in classifying “fuzzy” items. Some accounting items are difficult to classify, especially when distinguishing between liabilities and equity accounts. Therefore, the analyst must understand not only the accounting principles behind the numbers, but also understand business practices. For example, in the case of deferred taxes, the analyst must understand not only what gives rise to deferred taxes, but whether this accounting item represents an ongoing difference between tax and accounting income (and, hence, is more suitably classified as equity) or whether this item represents a temporary timing difference (and, hence, is more suitably classified as a liability).
- Restatements. Financial statements are restated occasionally due to errors or, unfortunately, fraud. When analyzing a company that has restated its financial statements, questions arise with regard to what data to use. As reported? As restated? Generally, when making forecasts of the company's future performance and condition, we would want to use the corrected data.13
Selecting and Interpreting Ratios
Interpretation of ratios one at a time is difficult since there is no “good” or “bad” value when viewed in isolation. Ratios should be selected that have meaning for that company. For example, inventory turnover for DuPont is not very meaningful because the investment in inventory is of little consequence for a pharmaceutical company. But inventory turnover is very important for, say, a retailer such as Wal-Mart. And whereas investment in R&D is important for DuPont, this is much less so for Wal-Mart Stores.
Further, some ratios do not make sense under certain circumstances. For example, if a company has negative earnings, the price-earnings ratio is meaningless. As another example, consider a company that has negative book value of equity (and, yes, this can happen). In this case, any ratio that uses book value of equity, such as the debt-equity ratio, is meaningless.
Choosing a Benchmark
To make comparisons, the analyst most likely will want to compare the company with other companies. But identifying the other companies in the same or similar lines of business presents a challenge. A system that has been used for many years for classifying companies by lines of business is the Standard Industrial Classification (SIC) system, which was developed by the Office of Management and Budget. However, starting in 1997, another classification system, North American Industry Classification System (NAICS), replaced SIC codes with a system that better represents the current lines of business. Using the NAISC, we can classify a company and then compare this company with others of that class.
Classifying companies into industry groups is difficult because most companies have more than one line of business. Most large corporations operate in several lines of business. Do we classify a company into an industry by the line of business that represents the:
- Most sales revenue generated?
- Greatest investment in assets?
- Greatest share of the company's profits?
It is not clear which is the most appropriate method and a company may be classified into different industries by different financial services and analysts.
In making comparisons, there is an issue of whether the benchmark should be all other companies in the industry (say, an average), or the leading companies in the industry. Consider the case of DuPont. DuPont is a manufacturer of basic chemicals. The primary U.S. competitor is Dow Chemical, though there are also a number of smaller competitors such as Union Carbide, Georgia Gulf, and Millenium Chemicals, and a number of large global companies such as LG. When comparing DuPont to the industry:
- Should we include two major competitors as the industry benchmark? If so, do we simply average Dow Chemical and Union Carbide's ratios or do we weight them in some manner (e.g., by market share)?
- Should we consider the smaller competitors at all?
- Should we compare DuPont with the largest or the most profitable company in the industry?
The benchmark that we choose may affect the conclusions that we draw with respect to a company's operating performance.
Using Ratios in Forecasting
We often examine trends in ratios and other financial data to predict the future, forecasting the future based on historical trends. For example, we may extrapolate a trend in revenues or a trend in operating profit. And though this may result in a reasonable forecast for the immediate future, the business environment is very complex and many factors can affect the future performance or conditions of a company.
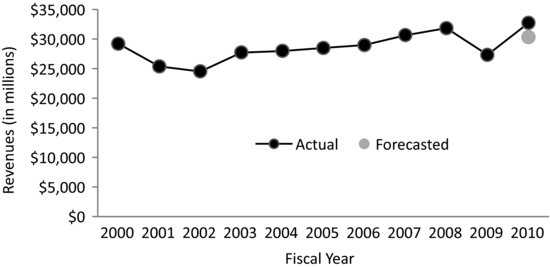
Consider forecasting DuPont's revenues for 2010 and beyond, based on net income data from 2000–2009. We begin by estimating the trend in the revenues over this period, as we graph in Exhibit 4.29. Revenues appear to follow a linear path through these years, as we show in this exhibit, with an interruption in 2009. The influence of 2009 is apparent on the forecasted revenues. The forecasted revenues understate the actual 2010 revenues by $2,415 million.
EXHIBIT 4.29 Forecasting DuPont's Revenues for 2010 Based on Revenues for 2000-2009
Source of data: DuPont, annual reports and 10-K filings, various years.
Had we included the data all the way back to 1982, our forecast would have been less accurate. This is because the pattern of revenues, especially influenced by its acquisitions and divestitures over the entire 28-year period is not as representative of DuPont in the more recent years.14 This is why we develop forecasts using information in addition to the basic trends, such as forecasts of company-specific events, as well as economic and market conditions.
But we need to be careful in predicting the future revenues or income of a company based solely on the past. As companies mature, growth slows and this needs to be considered in making any forecasts. How much does growth slow? It depends on many factors, including industry structure (e.g., degree of competition), changing demographics, and government regulation.
SUMMARY
Financial analysis of a company requires a wealth of information. Now that so much information is available—and that so much of the analysis can be accomplished with a personal computer—the real challenge for the analyst is to select the appropriate tools, gather the pertinent information, and interpret it.
Financial ratio analysis requires understanding the accounting information that is used in these ratios. In addition to calculating financial ratios, the analyst must look at company and industry specific information that helps explains the trends and changes in trends that the financial ratios may reveal. In addition to the company and industry analysis, the financial analysis must also be able to put the analysis of the financial ratios in context of the economy in general.
Analysis is becoming more important following the recent scandals as investors and financial managers are learning to become more skeptical of accounting information and look more closely at trends in data, comparisons with other companies, the relation between management compensation and earnings, and footnote disclosures. It is not necessarily the case that all of the scandals could have been detected with closer scrutiny, but there were warning signs in the trends and hints in footnotes that should have at least raised the caution flags among analysts.
REVIEW
1. For example, depreciation is included in the cost of goods sold (COGS), yet it is not a purchase. However, as a quick proxy for purchases, we can use the accounting relationship: Beginning inventory + Purchases = COGS + Ending inventory.
2. This is the case for most every ratio that involves the balance in an account that is seasonal, such as inventory and accounts receivable.
3. If you include an obligation in the denominator that is paid out of after-tax earnings, such as preferred stock dividends, you need to gross-up these obligations to place them on a pre-tax basis by dividing the obligation by a factor equal to one minus the tax rate.
4. If dilutive securities have obligations, such as interest, that may affect the earnings available to shareholders, these obligations are added back to the numerator in the diluted EPS calculation.
5. For example, DuPont's market value of equity in July 2005 was at least three times its book value.
6. What distinguishes return-on-investment ratios from the activity ratios (such as an inventory turnover or receivable turnover) is that the numerator is the net benefit, rather than the gross benefit from an activity.
7. This ratio is also referred to as the basic earning power ratio.
8. In the case of a company that incurs a rental expense, we generally capitalize the value of the operating leases and include this value as capital. We would also adjust net income for the after-tax effect of the implied interest on the operating lease. In past years in which goodwill was amortized, we would also add back that amortization to net income.
9. Because we are interested in the total capital invested, we include short-term interest bearing debt in the amount of capital invested.
10. An easy way to remember the DuPont breakdowns is to keep in mind that cross-cancellation of terms will produce the desired return. For example, ![]()
11. For presentation purposes, we have grouped several reported items and have rounded the percentages.
12. P-1 is the highest rating by Moody's, and A-1 and F-1 are the second-highest ratings for Standard & Poor's and Fitch, respectively.
13. Of course, if the restatement is made as a result of detected fraudulent reporting, the analyst would want to take a very close look at why the company's management had to restate the data, in other words, what were they hiding?
14. The forecast error using the 28-year period 1982–2009 instead of the most recent 10 years is $3,664 million.