Chapter 3

The Data Vault 2.0 Methodology

Abstract

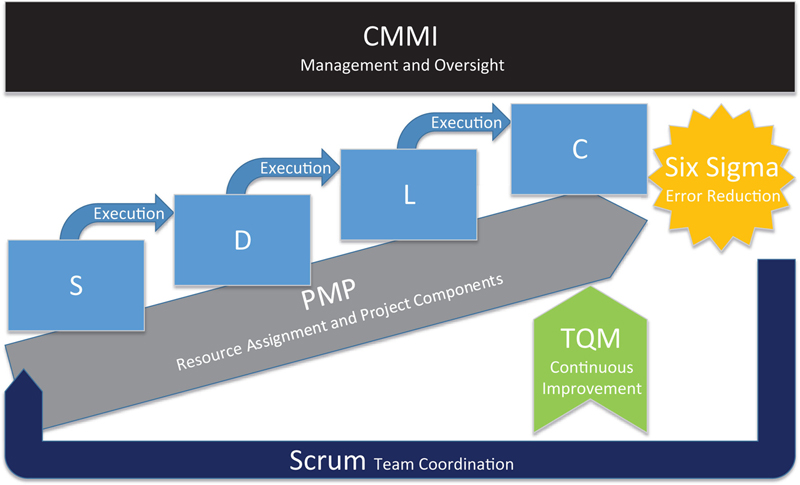
The Data Vault 2.0 Methodology introduces unique concepts to the development of data warehouses and is based on several agile data warehouse methodologies and techniques, including CMMI, Six Sigma, TQM, SDLC, and Function Point Analysis. This chapter introduces the basics of these standards and explains how the Data Vault 2.0 methodology brings them together. This chapter focuses on the project practices of the Data Vault 2.0 methodology.

Keywords

data
CMMI
Six Sigma
TQM
SDLC
Function Point Analysis
methodology
The Data Vault 2.0 standard provides a best practice for project execution, which is called the “Data Vault 2.0 methodology.” It is derived from core software engineering standards and adapts these standards for use in data warehousing. Figure 3.1 shows the standards that have influenced the Data Vault 2.0 methodology.
image
Figure 3.1 Components of the Data Vault 2.0 methodology.
By combining these standards, the Data Vault 2.0 methodology becomes a best-of-breed standard for project management in data warehousing. Scrum is used for team coordination and to apply to the project day-to-day tasks. Within a two- to three-week-long Scrum iteration (sprint), the team executes a mini-waterfall which is based on the software development life cycle (SDLC). The goal is to have completed deliverables after this iteration, which can be put into production.
Project management techniques from the PMI Project Management Body of Knowledge (PMBOK), as recognized in the Project Management Professional (PMP) designation is applied to define and execute the project plan at the physical level of the project. Capability Maturity Model Integration (CMMI) is used for overall management and project oversight and applied for review and improvement sessions.
A continuous improvement of the process and the underlying data is done using Total Quality Management (TQM) in a closed loop approach. When business users are involved in aligning the data sets across the sources and correcting errors in the source systems, they follow TQM principles. We will discuss in section 3.3.2 that this requires more activities than in commonly used approaches focusing on data quality (DQ) only.
Six Sigma rules and principles are applied in order to achieve maximum optimization in agility of the process of building and implementing Data Vault 2.0 styled data warehouse initiatives. This process relies on measurements (estimates vs. actuals), or key performance indicators (KPIs), covered in section 3.1.4.
The Data Vault 2.0 methodology consists of three major activities in which the methods shown in Figure 3.1 are applied:
1. Project planning, which includes the management, definition, and estimation of the project;
2. Project execution, which includes sprint definition, team organization, and technical numbering for artifact organization;
3. Review and improvement, which includes review and improvement activities.
The remaining sections in this chapter describe these activities and the application of the methods in detail.

3.1. Project Planning

Because a data warehouse is a piece of software, many academic researchers and professionals from industry agree to the fact that methodologies from the software engineering discipline can be applied to data warehousing projects [1]. We have already discussed some well-known methodologies for project planning.
The Data Vault 2.0 methodology derives its project planning capabilities from PMP. And unlike the agile Scrum methodology, there is an emphasis on having a formal project plan within a sprint. Each project has a project plan: that includes the tasks to be accomplished, outcomes to be expected as the output of the task and roles that will execute the task. Depending on the project type, there are different types of roles that perform the project. The following list presents the roles and their responsibilities:
Business Sponsor: Business sponsors should create alignment between the project and business and cultural goals; communicate on behalf of the project, especially towards senior management; be the key advocate of the project and gain commitment among other key stakeholders; arrange resources to ensure the success of the project; facilitate problem solving by ensuring the escalation of issues to be solved effectively at the organizational level; support the project manager by offering mentoring, coaching and leadership; and build durability to make sure that project outputs are sustainable [2].
Technical Business Analyst: They establish standards and access control lists; prioritize change requests; establish new requirements; create new reports for the general business user audience; help the team debugging alpha releases; participate in the development and design of information marts; and create user training material. The Technical Business Analyst is a power user who reports to the business but has a level of technical skills including the ability to understand data models, and leverage or write SQL directly.
Project Manager: This role is responsible to make sure that the project team completes the project. The project manager develops the project plan, manages the team’s performance of project tasks and secures acceptance and approval of deliverables from the project sponsor and other stakeholders. In addition, this role is responsible for communication, such as status reporting, risk management and escalation of issues that cannot be solved within the project team [3].
IT Manager: Information technology (IT) managers ensure the business continuity and success of the business. For that reason, they oversee projects and make sure that they use resources effectively. IT managers advise the management team objectively on where IT might make a difference to business; agreeing on costs, timescales, and standards to be met and monitoring them throughout the project; helping the organization to transition smoothly from legacy systems to new systems; and keeping management updated on the progress of current projects [4].
ETL Developer: Team members who are assigned to this Extract, Transform, Load (ETL) role implement the data or control flows that load the data from source systems to staging, from staging to Data Vault structures and from there to the Business Vault and to information marts. They are also responsible for creating virtual marts, or implementing soft business rules in ETL as requested by the business.
Report Developer: Report developers implement business-driven reports based on information marts, Business Vault tables, or directly on the Raw Data Vault (in rare circumstances). In most cases, they don’t need to implement any business rules for this purpose; however, in rare cases, implementing a business report might require implementing a limited number of business rules directly within the report. This should be avoided in most cases as performance will drop and reusability is at risk.
Data Architect / Information Architect: Information architects (known as data architects in the industry, but we think the term is misleading given the fact that they should deal with information instead of data; see Chapter 2, Scalable Data Warehouse Architecture) are responsible for the information architecture and data integration [5].
Metadata Manager: This role is responsible for the planning of metadata design; facilitates a framework for metadata development; coordinates activities and communication with other roles and projects; administrates access levels to metadata for all members and external staff who need to work with the metadata [6].
Change Manager: The change manager ensures that new functionality will not disrupt other IT or business services on roll-out. This role is also responsible for making sure that roll-outs are possible in the environment and not hindered by other projects.
Many organizations make the mistake of assigning the responsibilities to persons instead of defined roles. The advantage of having defined roles in a team is that it is possible to replace the person who fulfills the role by another, skilled person – for example, if the current person leaves the organization or changes the project. Defined roles help the organizations in many ways: these role definitions help the human resource department to find the right people for the job in the free market; it is possible for new hires to quickly identify their responsibilities and deliver what they are expected to deliver; and finally clear responsibilities help the team to decide who does what when working on issues that naturally arise in development projects.
Most of the presented roles are already known to project teams in data warehousing. The exception is the technical business analyst. This role serves an intermediate function between business and IT. The characteristics and more information about the responsibilities of this role are given in Figure 3.2.
image
Figure 3.2 Characteristics and responsibilities of a technical business analyst.
Due to the role’s location between business and IT, the job of the technical business analyst is to mitigate between both parties and prevent an “over-the-fence-throwing” mentality between them. Such a mentality, where both parties don’t work together with a mutual understanding and mutual support of each other, is oftentimes a root cause for failing projects. Such projects are characterized by unclear business requirements, technical artifacts that don’t meet the business requirements nor those that IT has understood, and unreliable software due to untested or incomplete testing (from a business perspective). Oftentimes, finger pointing is involved and each party is very confident that mistakes are the sole responsibility of the other side.
This is also why it is a recommended practice for Data Vault 2.0 teams not to separate business from IT roles. Instead, both groups should work together, with each role focusing on their responsibilities. If possible, the team should be co-located to be more efficient. It is important to create a level of collaboration and mutual understanding between business and IT and each individual role, to prevent situations as outlined in the previous paragraph. This is the responsibility of the project manager and requires continuous actions if the groups start separating from each other during the course of the project.
Part of the understanding that needs to be established from the business side is to understand that IT needs a way to work relatively uninterrupted from day-to-day issues during their two-week sprints. Issues that arise in operations have to be scheduled for one of the next sprints. In order to achieve this, IT has to change their thinking as well: their job should be the enabling of business to solve some if not most of their problems on their own without the involvement of IT. That is where “managed” self-service business intelligence (BI) comes into play. The Data Vault 2.0 standard gives guidelines to IT as to how to provide the data in a way that it can be consumed by business users on their own. This requires shifting responsibilities to business. For example, it should not be the responsibility of IT to fix data in the enterprise data warehouse in order to compensate for errors in operational systems. It is the responsibility of business to get these errors fixed in order for IT to deliver the data through the data warehouse back to business, where they can apply business rules to transform data into information. IT will use this knowledge to institutionalize those information marts that are used on a frequent basis.
To prevent interruptions from either side, an established process is required for requested changes to the system. Figure 3.3 shows this communication channel.
image
Figure 3.3 Defined processes showing the communication channels in the Data Vault 2.0 methodology.
New change requests often have their origin on the business side of the project. IT is required to assess the risks and the impact to the system currently in production. That is why the change requests are funneled from business users through the sponsor (who decides about the prioritization of their change requests) through the technical business analyst (who helps to translate the business requirements into technical terms) to the IT manager and the project manager, who are responsible for scheduling. When IT is done with the risk assessment, it returns this information to the business so they can make a final decision whether the change request should be implemented given the risk and impact assessment. If business decides to go ahead with the change request, it is scheduled by IT in one of the next sprints, depending on the previous prioritization by the business. They are then responsible for the development and subsequent delivery of the new artifact. After business has tested the change (in addition to development testing) and accepted the change, the formal sign-off releases IT from more duties on this change request.
When new releases of the data warehouse system are being developed, development teams use the same approach as teams in traditional software development. They use Alpha releases to test the new release early in the development process, Beta releases to test it against a limited business audience and Gamma releases for production. Alpha releases should only affect technical team members up to the technical business analyst, as Figure 3.4 shows.
image
Figure 3.4 Data Vault 2.0 methodology Alpha release reach.
It is very common that three to five technical business analysts are involved in the Alpha release, in addition to the technical IT team. When IT releases new reports to the analysts, it should be made clear that these reports are not intended for circulation towards business, because the information on the reports or in the multidimensional cubes might be wrong or even bad. Technical business analysts receive these reports nevertheless, in order to help them to spot those errors or identify miscalculations. It is very common that an Alpha release is distributed to technical business analysts after the first two or three sprints of the data warehouse project.
Once the new release achieves Beta status, the release is shown to more technical business analysts, the business sponsor and a selected number of business managers and other users with a vested interest in the functionality of the new release. Figure 3.5 shows the roles that are involved in the Beta release.
image
Figure 3.5 Data Vault 2.0 methodology Beta release reach.
The Beta release has been tested thoroughly by IT and business representatives and no longer contains any obvious or known errors. However, the generated reports are still not good for circulation because of the nature of the release state. Instead, the reports are used by the limited team to identify issues that have not been identified by development and technical business analysts so far. If the limited team agrees to the readiness of the release for production, the data warehouse system enters Gamma state, as shown in Figure 3.6.
image
Figure 3.6 Data Vault 2.0 methodology Gamma release reach.
The Gamma or production release is deployed and made available to all business users.
This approach closely follows CMMI, which is part of the Data Vault 2.0 methodology.

3.1.1. Capability Maturity Model Integration

The Capability Maturity Model Integration (CMMI) is a process improvement framework developed more than 20 years ago and governed by the Software Engineering Institute (SEI) at Carnegie Mellon University (USA). CMMI is sponsored by the U.S. government (especially the U.S. Department of Defense) and is in use by organizations of all sizes world-wide. It has helped to streamline costs, reduce rework and defect rates and improve timelines and quality [7].
CMMI by itself is a process improvement framework that has been developed to address a broad range of application environments. There are three different models based on the CMMI framework [7]:
CMMI for Development, a process model for process management and improvement in software development organizations
CMMI for Acquisition, a model for organizations that have to initiate and manage the acquisition of products and services
CMMI for Services, a process model for organizations to help them to deploy and manage services
By its nature, CMMI for Development is the right choice for process improvement in data warehouse development. It can be used to increase the efficiency of development processes for software products (such as a data warehouse), including processes for planning, management, and control of development activities [7]. The CMMI for Development standard provides best practices from successful development organizations and experiences from software quality experts [7]. The idea is to set organizations on a track of process improvement by enabling them to predict the outcome of their (defined and managed) processes. The prediction of process outputs (including the time-frame and quality of the product) results in a lower risk of exceeding budget, encountering quality problems and going over schedule [7].
It is possible to integrate CMMI with other frameworks and best practices, such as agile development, PMP and Six Sigma. That is because CMMI doesn’t define how the software development has to be done. Instead, it defines what must be done in order to improve development processes. Therefore, the CMMI framework supports agile principles by providing a reference framework for successful development environments [8]. It supports the integration of Six Sigma with the option of implementing CMMI process areas as Six Sigma (e.g., DMAIC) projects [9]. PMP is also supported due to an overlapping between Project Management’s Body of Knowledge (PMBOK’s) knowledge areas and CMMI process areas [7].
There are two different representations of CMMI: the continuous representation and the staged representation. These representations exist to provide organizations with different requirements and a unique set of tools for process improvement [10]. The staged model is focused on the overall organization and provides a road map as a series of stages (hence the name). These stages are called maturity levels and indicate the maturity of the organization regarding a set of process areas. While the organization is advancing on the maturity levels, it implements more and more practices from various process areas. As soon as the organization has satisfied the goals of all process areas in a maturity level, it can advance to the next level to further improve its processes [10]. The continuous model is different from the staged model as it provides less guidance on the order of the process areas that should be implemented and improved. Instead, the focus is on the individual process area and how it can be improved. Each process area is on its own capability level. The grouping of process areas is not followed in the continuous model [10].
The next sections present the capability and maturity levels of CMMI in more detail.

3.1.1.1. Capability Levels

Organizations that are working with the continuous representation of CMMI are using capability levels to measure their process improvement efforts. The following capability levels exist in CMMI [10]:
0. Incomplete
1. Performed
2. Managed
3. Defined
4. Quantitatively Managed
5. Optimizing
An organization starts with the capability level 0: incomplete. It indicates that processes are not, or only partially, performed. It also indicates that at least one specific goal of the process area is not satisfied. There are no generic goals for this capability level because partially performed processes should not be institutionalized [11].
The organization can proceed to capability level 1: performed if all generic goals of level 1 are satisfied. This level requires that processes are performed and produce the needed output. However, this level doesn’t require that the process itself be institutionalized, which means that process improvements can be lost over time [11].
The capability level 2: managed requires a process that is planned and executed in accordance with policy. This managed process employs skilled people who have access to the right resources and are able to produce controlled outputs. All relevant stakeholders are involved in the process, which is monitored, controlled, reviewed and evaluated on a regular basis.
The next capability level an organization can accomplish is capability level 3: defined. It is characterized by a defined process which is a managed process derived from the organization’s set of standard processes and derived to the needs of the circumstances. The process has been tailored according to the tailoring guidelines of the organization and maintains a process description. In addition, it contributes process-related experiences back to the overall process organization.
Capability level 4: quantitatively managed is a defined process (see capability level 3) that uses statistical and other quantitative methods to control selected subprocesses. These methods are used to identify processes that produce a higher number of defect outputs or outputs with a lower quality [10].
The highest capability level that an organization can reach is capability level 5: optimizing which focuses on the institutionalizing of an optimizing process. This process requires that the organization constantly measures its (quantitatively managed) processes, analyzes trends, surveys technical practice, addresses common causes of process variation and then adapts the processes to changing business needs [10].

3.1.1.2. Maturity Levels

Maturity levels are different from capability levels as they are applied to sets of process areas where a combined set of goals has to be achieved (compare this to capability levels, which are applied to individual process areas). The following maturity levels are used in CMMI and are explained in this section [12]:
1. Initial
2. Managed
3. Defined
4. Quantitatively managed
5. Optimizing
The first maturity level 1: initial indicates an organization with ad-hoc and chaotic processes. There is no stable process environment provided by the organization. The success of the organization depends on the skills and engagement of individuals rather than defined and established processes. Organizations at maturity level 1 can deliver working products. However, they often exceed the budget and original delivery schedule. These organizations usually overcommit, abandon their processes in times of stress and have problems in repeating past successes [12].
Organizations at maturity level 2: managed have processes that are planned and executed in accordance with policy and that involve all relevant stakeholders. Skilled people with adequate resources produce controlled outputs under a monitored, controlled, and reviewed process that is evaluated on a regular basis. Existing processes are retained during times of stress [12].
Maturity level 3: defined indicates well-characterized and understood processes which are described in standards, procedures, tools, and methods. Organizational standard processes are established and improved over time. The major difference between maturity levels 2 and 3 is that standards, process descriptions and procedures at maturity level 2 can be different at each specific process instance. However, in maturity level 3, standards, process descriptions and procedures are tailored from the standard processes of the organization [12].
At maturity level 4: quantitatively managed, organizations use quantitative objectives for quality and process performance for managing their projects. Selected subprocesses are measured by collecting and statistically analyzing specific measures of process performance [12].
Organizations at maturity level 5: optimizing continually improve their processes using a quantitative approach to understand the variation of their processes and their process outcomes. The focus is on the continual improvement of process performance by incrementally improving processes and used technology [12].

3.1.1.3. Advancing to Maturity Level 5

Organizations who want to comply with maturity level 5 should focus on achieving capability levels for selected process areas first and then control the most advanced level – organization-wide performance management and continuous process improvement. The achievement is performed using an incremental undertaking. With each achieved maturity level, the organization achieves generic and specific goals for the set of process areas in a maturity level and increases its organizational maturity. Because maturity levels are based on their lower levels, the organization can leverage its past accomplishments when advancing to the next maturity level. For these reasons, it is often counterproductive for organizations to try to skip maturity levels [12].

3.1.1.4. Integrating CMMI in the Data Vault 2.0 Methodology

The Data Vault 2.0 methodology enables organizations to reach CMMI level 5 by addressing the following goals:
Measurable: Section 3.1.4 will describe how the estimation process in the Data Vault 2.0 methodology is based on the comparison of estimated and actual effort. This requires capturing this information along the way.
Repeatable: In order to estimate future effort, it is important to have repeatable processes. The Data Vault 2.0 model helps in this regard due to repeatable, pattern-based processes for modeling and loading data into the enterprise data warehouse.
Defined: Data Vault 2.0 promotes defined standards, rules, procedures and prebuilt templates, including project documentation. An example of this definition of processes is presented in Figure 3.3. The definition also promotes repeatable processes.
Flexible: The methodology is the enabler for rapid succession deployments (two to three weeks, depending on the capabilities or preferences of the organization). It is also possible to grow and shrink the team, depending on demand. This falls in line with the defined patterns in Data Vault 2.0. They help new team members to rapidly understand the processes and get involved in the implementation or testing.
Scalable: Once a data warehouse based on Data Vault 2.0 has been deployed to part of the enterprise, it is possible to add more functionality required by other parts of the organization. This is due to the potential of Data Vault 2.0 models to grow organically, a characteristic that is not only unique to Data Vault, but has been designed into the modeling approach from its beginning.
Monitored: Consistent team reviews as in Scrum (for example in the retrospective meeting) and constant releases in each sprint make sure that business users don’t lose interest in the project and its activities. Instead, it keeps attention levels high, which means that business reacts quicker when IT is not delivering the expected results.
Governed: Monitoring also involves governance. If the releases don’t meet (or exceed) documented standards, the project is halted and reassessed to make sure it will in the future. This is done between the two- or three-week sprints.
Optimized: The Data Vault 2.0 processes improve the opportunity for optimization due to low complexity: the lower the complexity of development processes, the fewer dependencies that have to be taken into consideration when continually improving processes.
Table 3.1 shows the activities and tasks of the Data Vault 2.0 methodology and how they relate to the maturity levels of CMMI.

Table 3.1

Mapping the Data Vault 2.0 Methodology to CMMI Maturity Levels

Level Maturity Level Data Vault 2.0 Methodology
1 Initial chaos N/A
2 Managed Predefined Document Templates
Implementation Standards
Pattern Based Architecture
3 Defined Defined Project Process
4 Quantitatively managed Estimates and Actuals Captured
Measured Lead Times
Measured complexity
Measured defects
5 Optimizing Automation tools
Rapid delivery
Reduced cost
Parallel teams

Organizations can use this table to focus on the given Data Vault activities when they try to advance through the maturity levels. For example, parallel teams should only come into the focus of the organization when they have already achieved CMMI maturity level 4 (quantitatively managed) and try to achieve level 5 (optimizing). This follows the recommended practice as outlined earlier in this chapter, to advance through the maturity levels instead of directly trying to become an optimizing organization from the onset. While the first approach requires more time and a careful development of organizational capabilities, the risk is much lower than going directly after maturity level 5.

3.1.2. Managing the Project

As section 3.1 described, the Data Vault 2.0 methodology promotes the development processes of defined, repeatable, and governed, among other characteristics. However, it doesn’t mean that the goal is to overdefine or overrestrict the development process. The goal is to use a structured yet agile approach to the development of business intelligence solutions. Business agility is defined by the ability to rapidly adapt to changes in the business environment. To support this ability, the data warehouse development team has to cope with these rapid changes as well. IT should avoid long-term project planning as much as possible and focus on iterative and incremental development instead. They need to be able to adapt to changing business requirements within two-week boundaries. An exception to this rule is the long-term (or overall) planning required at the program or enterprise level of the organization.
In order to achieve this goal, cross-functional teams are required, as already described in the previous section. Collaboration between each single team member, between business and IT is required at all times. If the business decides to change requirements (because external factors force them to do so or because they have changed their mind along the way for whatever reason), the development team has to know this as soon as possible. Changing direction should not be avoided, but promoted in order to deliver the right product that meets the user’s expectations. However, this requires adaptive planning and an evolutionary approach to the development of the data warehouse. By deriving the Data Vault 2.0 model from a hub-and-spoke network model (this will be described in Chapter 5, Intermediate Data Vault Modeling), it was designed to support such an evolutionary approach from the onset.
Building a Data Vault model is a natural evolution. The best approach for implementing a Data Vault 2.0 based data warehouse is to focus on a well-defined small-scoped problem, where the business keys cross multiple functional areas. Attempting to model the whole enterprise at once should be avoided, as is common in the typical architectures and the approaches to build them, presented in Chapter 1, Introduction to Data Warehousing. Modeling the whole enterprise at once is required in these legacy architectures, because the effort to modify the initial model (either a third-normal-form or star schema) is too high. Therefore, developers try to implement as many features into the initial model as possible to minimize future changes. However, given changing business environments, this approach is not realistic. Data Vault 2.0 has been designed to quickly absorb changes to the model, among other design characteristics. Organizations who have decided to use Data Vault 2.0 should leverage this characteristic by organically growing their model in order to fully gain the advantages from Data Vault modeling.
But agility doesn’t only depend on the Data Vault model or the architecture. It also depends on the people: the project members in the team and external people who support the core development team. A successful agile project requires people who are properly trained and follow a disciplined, collaborative approach (as described in the previous section). It is also important to involve all parties that have an interest in the data warehouse to be delivered. That is not only the business user. Development teams often forget to involve operations and support people early in the process.
Operations and support people need to support the solution in production. Thus, they have specific requirements for configuration, documentation, and roll-out of the solution. The evolutionary approach of the Data Vault 2.0 methodology helps in this regard as well: because the data warehouse is delivered in increments, operations and support can give early feedback in addition to the feedback provided by the business users. Development should leverage this potential feedback to the maximum by delivering working software on a frequent basis. In the end, frequent testing isn’t only performed by IT during a sprint, but also by business users (the technical business analyst), operations and support.
Ultimately, the goals for the agile delivery are [12]:
Scaling agile: This is not only about scaling the team size, but also location-wise (scale the distribution of your team), compliance, complexity (domain, technical, and organizational) and into an enterprise environment [13].
Avoid chaos: Poorly run and managed projects run into the same problems as unmanaged projects. Don’t “be agile” without agile discipline. Learn from mistakes made in past sprints and continuously improve your processes [13].
Effectively initiate: Before actually building the system, the business problems should be clarified, a viable technical solution identified, the approach planned and the work environment and team set up. It is also import to gain stakeholder commitment for the chosen approach and implementation strategy [13].
Transition from individuals to agile teams: The focus of every individual in your team should be on collaboratively working towards the goals of the project, not on individual benefits [13].
Build incrementally: Every sprint should produce a solution that can be consumed by its business users. Only then can they give realistic and valuable feedback on the current solution. The goal is not to preview something – it is to put it into actual production [13].
Deploy agile solutions: Today’s business and technology environments are of complex nature. The agile solution has to be deployed into such an environment [13].
Leverage enterprise disciplines: The Data Vault 2.0 methodology already leverages established and proven enterprise methodologies such as CMMI, Scrum, Six Sigma, PMP, etc. There are other enterprise disciplines that help you to deploy, maintain and support the solution, such as the Information Technology Infrastructure Library (ITIL). Make use of these proven disciplines, especially if they are already used within your organization [13].
Adapt governance strategy: Governance of agile projects should fall in line within the sprints. As the solution is delivered towards the end of the sprint, adherence to standards and rules set by the organization should be reviewed [13].
These goals are from Disciplined Agile Delivery (DAD), which is used in enterprise organizations to agilely deliver software. It is a hybrid approach that extends Scrum with proven strategies from Agile Modeling (AM), Extreme Programming (XP) and Unified Process (UP). Therefore, it follows a similar strategy to the Data Vault 2.0 methodology, with a clear focus on data warehousing and business intelligence.

3.1.2.1. Scrum

The traditional software development life-cycle, also known as the waterfall approach, has several advantages and disadvantages. If everything goes well (and as planned), the waterfall approach is the most efficient way to carry out a project. Only the required features are implemented, tested and deployed. The process produces a very good set of documentation, especially during the requirements and design phase of the project. However, it is almost impossible to carry out larger projects where the customer is not very concrete with requirements and ideas and where the business requirements evolve over time [14].
As a result, agile methodologies have been developed to make software development more flexible and overall more successful. Scrum is one example of such agile methodology and is described in the following sections. It was introduced in the late 1990s [15,16] and has become “the overwhelming [agile] favorite.” [17]
User requirements are maintained as user stories in a product backlog in Scrum [18]. They are prioritized by business value and include requirements regarding customer requests, new features, usability enhancements, bug fixes, performance improvements, re-architecting, etc. The user stories are implemented in iterations called “sprints” which last usually two to four weeks. During a sprint, user stories are taken off the product backlog according to the priority of the item and implemented by the team [19]. The goal of Scrum is to create a potentially shippable increment with every sprint, which is a new release of the system that can be presented to the business user and potentially put into production [20] (Figure 3.7).
image
Figure 3.7 The flow of requirements in the Scrum process [20].
This requires that a user story be implemented and tested as a whole, including all business logic that belongs to this story. All stakeholders, such as business users and the development team, can inspect the new, working feature and provide feedback or recommend changes to the user story before the next sprint starts. Scrum supports the reprioritization of the product backlog and welcomes changing business requirements between the sprints [20] (Figure 3.8).
image
Figure 3.8 Quick turns in Scrum [21].
This helps to improve the outcome of the project in a way that meets the expectations of the business user. To ensure this, the customer should become as much a part of the Scrum team as possible [21].
The next sections explain the elements of Scrum in more detail.

3.1.2.2. Iterative Approach

The previous section has already discussed that Scrum uses an iterative approach for developing the final system. Each iteration is a small step towards the final solution and adds more value to the product [20]. The idea behind this approach is that most initial plans need to be corrected over time because of changing or roughly specified business requirements. Therefore, it should be possible for the team and the business users to take corrective action while the project is ongoing. However, this requires that business users receive value from the project as early as possible [20]. Figure 3.9 shows this concept.
image
Figure 3.9 Project control in Scrum [14].
In the first project base course, each iteration is only one day long. After the iteration, all stakeholders review the current “potentially shippable” system and check whether it still meets the expectations. If one of the stakeholders of the project identifies an issue in the project that requires correction, this correction will be relatively quick. For example, a business requirement can be modified and the system changed in the next iteration. In many cases, the change will be relatively small because it was identified early in the process. In the worst case, the whole iteration needs to be rolled back and performed again. In this case, only one day of work is lost.
If the iteration cycle (the sprint) is longer, for example a month, more requirements, expressed as user stories, will be implemented. Because there are often requirements that depend on each other, changing a requirement with many dependencies will take much more corrective effort than in the first case with a shorter sprint length.

3.1.2.3. Product and Sprint Backlog

The primary artifact in Scrum projects is the user story. User stories describe features from a user’s perspective and are kept in the product backlog until a team member selects a user story for implementation. At the beginning of the project, user stories tend to be more general, roughly describing the primary features of the business users. They are primarily used to begin a discussion between the product owner (a project role that we discuss in a following section) and the development team. As the team learns more about the features and the customer learns more about the product, new and more detailed user stories are added to the product backlog [18].
Each user story is prioritized before adding it to the product backlog. Developers strictly have to pick up user stories from the backlog in the order of priority [14]. At the beginning of each iteration, the user stories that should be implemented are taken off the product backlog and moved to the sprint backlog (see Figure 3.7 for details) [18]. The user story is designed, implemented, tested and integrated into the product as a whole. Problems are fixed immediately in order to maintain a “potentially shippable” product [14]. Figure 3.10 shows how team members work off the product backlog.
image
Figure 3.10 Backlog and priority [27].
The work items that have a high priority (and therefore will be picked next by a team member) have to be detailed and well-defined because they describe the upcoming task for the developer. On the other hand, user stories with lower priority can be less detailed. These user stories are often not well elaborated by the business user and require more definition. The typical process is to remove such a user story, split it up into multiple stories, define them in more detail and put them, prioritized, back into the product backlog [18]. It is also possible to reprioritize existing user stories between sprints to adapt the project to changing demands by the business. A common practice is to derive (at least the initial) user stories from a requirements specification written by the product owner using traditional methods [22].

3.1.2.4. Integrating Scrum with the Data Vault 2.0 Methodology

In order to become an agile project team and to achieve the goals presented in the beginning of this section, the team has to evolve through the different levels of CMMI. Too many teams and too many organizations just decide to be “agile” without correctly applying the principles of the chosen methodology. All agile approaches, including Scrum, follow a set of principles that are required to enable a team to be agile. Without following these principles properly, the team joins the many teams that pretend to “do agile development” but have decided to forego most project management activities in reality. But agile project management doesn’t mean “no project management.” It is a different approach to project management and requires that team members know the principles and how to perform them. Team members who have never worked on an agile project often don’t know the principles. They have to learn these principles from training or more experienced team members in order to be successful agile team members.
Not only that – running agile projects also requires an agile organization. If the organization thinks waterfall with “over-the-fence” throwing of artifacts between departments (e.g., from development to test to business) and putting changes into production requires a minimum of 3 weeks, your team will not perform very well from an agile perspective. As already stated in this chapter, the goal is to put the changes that are being developed in one iteration into production in the same sprint. That goal might not hold true at all times, for example if it is not possible to scope a change down to a manageable piece that can be developed and deployed within one sprint. In this case, multiple sprints might further develop the artifact until it is ready to deploy. However, the standard should be to deploy within the sprint where the artifact is being developed. There is no “agile big-bang” – that is, developing the data warehouse over sprints and deploying it at the end of the project in two years.
CMMI can help to evolve both the team and the organization to achieve agility. When following the recommendations outlined in section 3.1.1 (subsection titled “Advancing to Maturity Level 5”), organizations develop these skills over time, leaving team members time to learn, use and improve their agile skills. In fact, Scrum builds on CMMI level 5 (optimizing) where teams have the goal of improving their abilities over time. We will discuss this in more detail in section 3.3.
Most agile projects have in common the understanding that, to achieve the presented goals, the business intelligence (BI) team has to assume several responsibilities:
Customer satisfaction: To meet this responsibility, the team has to rapidly and continuously deliver not only working software, but useful software. By that, we mean the increment should provide value to the user (and work).
Deliver frequently: To show progress to business users and other stakeholders, it is the responsibility of the BI team to deliver working software on a frequent basis (in weeks rather than months).
Measure progress: Oftentimes, development teams measure their progress by the person hours invested and compare it to the initial or updated plan. In agile development approaches such as the Data Vault 2.0 methodology, progress is measured in working software: the features that have been implemented.
Welcome changes: Agile BI teams should not avoid late changes to the initial requirements. To meet business requirements and keep business users satisfied with the outcome, requirements gathering is a continuous approach in Data Vault 2.0.
Close cooperation: Business people and developers should work on new features of the data warehouse daily. However, the goal is not to quick-fix any problems in production. They should collaborate to implement new features as planned for this sprint. Quick-fixing should be done by the operations department, which is why the data warehouse should be developed in such a way that it is maintainable by the business itself, without the need to integrate IT into this process.
Communicate face-to-face: BI teams should avoid sending emails back and forth and instead meet face-to-face in order to solve any current issues.
Motivate individuals: Motivation often comes from trust and is a bidirectional relationship.
Technical excellence: To make business users satisfied in the long run, a technically excellent product is required. However, IT should avoid achieving this in the first try. Instead, they should focus on a good design that allows them to ultimately achieve the excellent product in an agile fashion. The Data Vault 2.0 model helps in this regard, because the design makes sure that the model is extensible to implement more features in later sprints.
Simplicity: True engineers love simple solutions. Avoid adding features that are not needed by the business. Avoid modifying the Data Vault 2.0 model by system attributes if there is no actual need. Whenever complexity is added to the solution, there must be a good reason for it. This makes it easier to maintain the final solution.
Self-organizing teams: Team members are responsible for self-organizing themselves around the associated tasks.
Adapt regularly: It’s the responsibility of the BI team to review past decisions, and make sure that they are still valid if the environment or other circumstances have changed. This responsibility might be the hardest, because people don’t want to admit mistakes. But it was not a mistake to make a decision six months ago under the circumstances back then. It would be a mistake to keep going if the circumstances have changed.
The presented responsibilities are directly derived from Scrum principles but apply to all agile projects. Therefore, the Data Vault 2.0 methodology can only be successful if the development teams adhere to these responsibilities.

3.1.3. Defining the Project

One of the discussed responsibilities was to create simple yet extensible solutions. This responsibility is required in order to allow an iterative approach to the development of the data warehouse. Instead of planning the complete solution from the onset, only the next couple of sprints are planned. This doesn’t mean that we don’t have a general idea or an overall goal of the data warehouse. It only means that we’re not immediately planning every task to get there, or modeling every available source or information mart that is required to deliver the final solution. The development team has to ask the customer what is required first, what has the most value for the business. That is what is delivered first, given that the dependencies of the deliveries are met.
Sometimes, this requires building some dependencies first, such as setting up the initial data warehouse infrastructure. However, building the final data warehouse infrastructure initially should be avoided. Start small, but make it extensible. Grow the infrastructure with growing requirements.
Oftentimes, architects try to create the data warehouse solution layer by layer: they decide on an initial set of source systems to deliver all the required reports or OLAP (online analytical processing) cubes. Then, they implement the whole stage layer to capture all source tables, including the ETL to load the tables. Once they are done with the stage layer, they start modeling the enterprise data warehouse to its maximum extent, because touching it later is too expensive. After the ETL load jobs are implemented, the data marts are created to finally satisfy the business users. This approach usually takes months if not years to complete, including several phases of debugging and error fixing. However, the problem arises when the requirements change (the architects in this example would say “too often”) or business demands additional features (in many cases when the initial architects already have left the organization).
Given the extensible model and architecture and the agile methodology in the Data Vault 2.0 standard, data warehouse architects don’t need to follow this approach any longer. Instead of building the data warehouse in a horizontal fashion, layer for layer, the data warehouse is built feature by feature, in a vertical fashion. The overall goal of the data warehouse initiative is the same, but it is now achieved in incremental deliveries of functionality. The goal of the BI team becomes to deliver the required functionality in rapid and frequent releases as described in the previous sections of this chapter. In order to do so, the functionality has to be scoped to individual features that are separated as much as possible from other features.
The recommended approach for achieving this goal is to use a scoped approach to requirements engineering and implementation of the single feature, as shown in Figure 3.11.
image
Figure 3.11 Scoping the report.
The feature to be implemented in the example shown in this figure is a report, but might be any other artifact required by the user. For example, it could be a new dimension or attribute in an OLAP cube, a new OLAP cube by itself (with the minimum number of dimensions), or a corpus for text mining. Once this artifact has been scoped and described by the business, IT starts to identify the sources (tables in the source system) that are required to build this single report. Next, the information mart targets are identified to assess what is already in place to deliver the required report (or other feature). Once this identification has been performed, engineers can stage the required data, build and load the Data Vault entities, and build the marts. When following this procedure, all the data in the source tables is loaded and modeled in the Data Vault, not partial attribute sets. Therefore, the source table has to be touched only once and not multiple times. In order to assess the availability of data, it should be possible to track what data is already loaded into the enterprise data warehouse. Partially loaded data makes this assessment more complex, which we want to avoid. Also, loading only partial data from source tables creates more complex Data Vault satellites.
Scoping the artifact to be developed in the iteration (that is, the change request) is an important prerequisite for success of the iteration. Proper scoping reduces the risk that the team is unable to complete and deploy the change within the timeframe of one sprint. Without scoping down a required change, it is also impossible to achieve short sprints of two, or even one, week duration. Furthermore, because of the Data Vault 2.0 model, the teams are now enabled to build their solution incrementally across lines of business – so they can be flexible in the scope of implementation.
Two common objections should be noted: the first one is to implement all tables from a source to keep the costs of integrating source systems low – in this case, loading data that is not required by the current solution. Loading this data requires additional ETL capacity, which requires a larger initial infrastructure. Also implementing all source tables from one source system might not be completed in one sprint and binds manpower that could be used to implement the feature to be delivered to the business. The effort often outweighs the complexity to assess the data already in the Data Vault (which is easy when focusing on tables). Another issue is that when implementing source tables into the staging area, it is a good practice to integrate the data in the Data Vault as well. Otherwise, additional complexity to assess the current state of the data warehouse is required when both systems are potentially out-of-sync. Loading all source tables completely requires complete modeling and loading of the corresponding Data Vault tables if this practice should be followed.
The second objection is that it is costly to touch the target multiple times in order to implement the final solution. This might be true, but the ultimate goal is to deliver working and useful features to the business within one sprint because it reduces the risk of failure: that the business doesn’t accept the solution, for example because written requirements are not met, the requirements have changed in the meantime or the solution turns out to be the wrong one, once business users have actually used it.
This vertical approach to information delivery is performed within one sprint. Depending on the organizational capabilities, this might be two or three weeks in duration. Therefore, the modeling of the Data Vault shouldn’t take months. Instead, the model should be created within the sprint’s duration. If it takes longer, it is a good indicator that the scope of the sprint is too large. In that case, functionality should be removed from the sprint. Remove everything that is not required to be delivered with the single feature that is the focus of this sprint. Make sure that business users understand that this functionality is still to be delivered – but in later sprints. Oftentimes, business users think that the functionality is removed entirely because it is removed from the sprint under planning. However, this is wrong as the missing functionality will be delivered shortly, in the next or after-next iteration. Once business users have seen the progress of the project, they will naturally accept this procedure.

3.1.3.1. Agile Requirements Gathering

Before new functionality can be implemented in a sprint, it needs to be defined. However, the requirements-gathering process is very similar to the implementation process. Usually, business has a general idea about a function to be implemented in the data warehouse. But IT has many more questions that need to be answered, such as questions regarding the data source, business rules to aggregate or convert the data, data types, use cases, etc. To answer these questions, requirements gathering is used.
To support an agile approach to requirements gathering, requirements are gathered along the way, unlike classical data warehousing where these requirements are gathered at the beginning of the project. The approach that has worked best in our projects is to use Raw Marts and quickly roll out data into the requirements meeting for review. These Raw Marts are used for creating reports or cubes to a limited number of business users who attend the requirements meeting and are not intended for distribution. This is because the Raw Marts contain raw data with or without incomplete implementation of business rules. The exercise is to show these reports to the users and ask them: “what is wrong with this report?” It turns out that business users can easily point to the problems within the report and, by doing so, provide all the business rules IT needs to implement the final report.
The procedure for this approach to requirements gathering is as follows:
1. Identify the required data: As described in the previous section, the first step is to identify the sources for the Raw Mart and its report. Again, only the data which is in the scope should be loaded into the staging area and into the enterprise data warehouse. If possible, the data should be even reduced for rapid output. For example, data that is only needed for the final report, but not the intermediate raw report, should be left out in this first step.
2. Produce the Raw Mart: Once the data has been loaded to the Raw Data Vault, a Raw Mart is created from this raw data. There are no business rules implemented when loading the Raw Mart. Instead, the format of the data is simply changed from the Data Vault model to the dimensional model. Virtual views work best for this approach because they can be easily built.
3. Produce Raw Reports: As soon as the data is in the dimensional Raw Mart, it is possible to create Raw Reports. Because no business rules have been applied to the data, the report contains the good, the bad, and the ugly data.
Up to this point IT is in control of the time-to-deliver. They are responsible for being agile to this point. The next steps are driven from the business side of the project:
4. Post Raw Reports on wall: When the Raw Reports have been created from the Raw Mart, the reports are presented to the attendees of the requirements meeting. A good way is to print them and post them on one side of the room. If that is not possible or feasible, it is also possible to use an LCD projector to show the reports to the group. However, the advantage of printed reports on the wall is that attendees can take the time they need to review the report and add their comments or corrections directly to the printout. Most of the issues the report has become easily available to them. They can explain to IT what issues the reports have and why they can’t use them in this state.
5. Gather business rules and other requirements: IT should directly ask the attendees what makes the report unusable and how this report can be made useful to the business. What modifications to the data are required to make the data correct? The answers of the business side are the missing business rules that need to be documented in the requirements document and applied to the data that goes into the Raw Report. Note that there should be less focus on the layout of the report, because this discussion should be driven by the business side, in the best case without dependency from IT.
As soon as the requirements have been gathered, at least partially, IT drives the project again, by implementing the business rules and other requirements:
6. Translate business rules and other requirements: The last step in this turn is to translate the business rules and other requirements, given by the business and documented in the requirements document, into program logic. This can be either done in ETL flows or virtually in SQL views. The business rules turn the raw data into information on the way from the Raw Data Vault to the Business Vault or the Information Mart.
After these business rules have been implemented by IT, the business side of the project can review and test the outputs and ask for further modifications if they are not yet satisfied with the end result. However, these modifications become change requests and are implemented in subsequent sprints. The described agile requirements-gathering process helps business users to express their business rules. For many of them, the traditional focus on requirements documents is too abstract and prevents the required identification from identifying issues with draft reports.
A recommended practice is to record these requirements meetings and set up a Wiki or other Web 2.0 enabled Web site that is available to everyone in the organization. The recordings from the meeting, including a description of the found business rules, should be posted on the Web site to ensure the transparency of the requirements-gathering process. Web 2.0 mechanisms enable participants to post comments or even modify the business rules according to their understanding. This approach makes sure that the requirements are correct in the first place. If a lot of discussion occurs on the Web site, another requirements meeting may be necessary to clarify any open issues before implementation should begin. Having these discussions before the actual implementation has taken place means a huge benefit and productivity boost to the organization and is a contributing factor to the overall success of the project. In order to make the right assumptions about the functionality that the team is able to complete in one sprint, which is important for scoping, the team has to be able to make correct estimates about the effort it takes to complete certain functionality. This topic is covered in the next section.

3.1.4. Estimation of the Project

The estimation process in the Data Vault 2.0 methodology depends on function point analysis (FPA). This approach is recommended over other estimation techniques, because it is based on the disaggregation of the functionality into individual items, which is fairly easy in Data Vault 2.0 (due to standardized artifacts). By using FPA, team members assess the required functionality of the data warehouse by calculating the function points of individual items and estimating the required hours to deliver the function points.

3.1.4.1. Function Point Analysis

Successful data warehouse projects require a realistic planning of the efforts to be done in the upcoming project. In order to perform a realistic planning, an accurate estimation technique is required. In order to estimate any piece of software, such as a data warehouse, metrics are used to measure the units of work that have been performed in the past and that will be performed in the future. Function points are the measure and are the key elements in function point analysis, an estimation technique widely used in software estimation [23].
With the use of function points, FPA is independent from technology-dependent metrics, such as lines of code (LOC) or other metrics that require a specific tool or platform to be measured [24]. Lines of code measures penalize high-level languages [25]. For example, the same functionality requested by a business user might require 100 lines of code in C# but 500 lines of code in C. Function points, however, measure the functionality that has been delivered to an end user or will be delivered in the future [23].
Figure 3.12 shows the functional characteristics of a software system in the airline industry.
image
Figure 3.12 Functional characteristics of software [23].
The functional characteristics of software are made up of external inputs (EI), which is the data that is entering a system; external outputs (EO) and external inquiries (EQ), which is data that leaves the system one way or another; internal logical files (ILF), which is data manufactured and stored within the system; external interface files (EIF), which is data that is maintained outside the system but necessary to perform the task. The assessment of function points also includes the complexity of the general system.
In function point analysis, systems are broken into smaller components for better analysis [26]. The next section introduces the high-level steps to count function points and perform a function point analysis.

3.1.4.2. Measuring with Function Points

In order to measure the size of a software system, each of its components is analyzed for the characteristics outlined in the previous section. The International Function Point User Group (IFPUG), the organization behind function point analysis, recommends the following procedure of steps to perform the measurement [27,24]:
Step 1: determine function point count type. Because the effort is counted differently for new or existing projects, the estimator has to pick one of the following three options:
Development project function point count
Enhancement project function point count
Application function point count.
Step 2: identify the counting boundary. Identify and define the boundary of the component to be measured. This is required to make a decision as to which functions are included in the count and which aren’t. Also, it is required to distinguish internal from external files as well as inputs and outputs to the component.
Step 3: identify and count data function types. The previous section introduced two data function types: internal logical files (ILF) and external interface files (EIF). These functions represent the user functionality to meet the internal and external data requirements.
Step 4: identify and count transactional function types. Transactional function types represent the functionality of the system to meet user requirements regarding the processing of data. It includes external input (EI), external output (EO) and external inquiries (EQ).
Step 5: determine unadjusted function point count. The number of function types from step 3 and 4 are adjusted according to complexity.
Step 6: determine value adjustment factor. The value adjustment factor (VAF) indicates the overall value of the general system to the user by assessing the general functionality of the system. There are 14 general system characteristics that make up the factor.
Step 7: calculate final adjusted function point count. This is done using one of the following formulas, depending on the function point count type selected in step 1.
The described series of steps is valid for all software development efforts, including data warehousing projects. The next sections describe how this procedure can be applied in such projects.

3.1.4.3. Function Point Analysis for Data Warehousing

In order to apply function point analysis to data warehousing, estimators have to cope with a number of challenges that are specific to these types of projects [28]:
1. Data warehouse projects often depend on various technologies and tools to handle business problems. Each tool has advantages and limitations that have to be considered when estimating the effort.
2. The backend processes, such as the ETL for loading the data warehouse layer, often has many interlinked processes that are required to gather the required information. The result is an increased complexity that makes estimation complex in return.
3. The frontend, which consists primarily of OLAP cubes, reports, dashboards and other graphical user interfaces, has its own set of aspects that have to be taken into consideration when estimating the effort. Examples include the performance of the interfaces, understandability, etc.
4. When new functionality is added to the system, the project team has to ensure that existing functionality is not affected in a negative way by breaking it or introducing errors. Therefore the effort for regression tests on the data warehouse has to be considered.
5. Because data warehouses can load a large amount of data on a daily basis, the effort to perform load testing for new requirements has to be considered in the estimation process.
These challenges make the previously described process, which is used extensively in classical software engineering, a tough, if not impossible, task. This is due to the process orientation of software versus a subject-oriented view of data warehouses [28]. As a result, the process has to be adapted to be used in data warehousing.

3.1.4.4. Boundaries in Data Warehousing

The first transformation for the adaptation is to define the boundary of a “component” in data warehousing. Due to the layered approach in this field, every function has to be implemented in various layers of the system. The component is made up of all these changes (Figure 3.13).
image
Figure 3.13 Data warehouse application boundary [28]. Figure adapted by author from Function Points Based Estimation Model for Data Warehouses, by Karthikeyan Sankaran. Copyright by Enterprise Warehousing Solutions, Inc. (www.EWSolutions.com). Reprinted with permission.
Figure 3.11 shows that each capability is composed of staging tables, objects in the core data warehouse and the data mart. That includes all logic implemented in ETL, such as business rules. Also included are graphical elements such as reports, dimensions and measures in the OLAP cube and items on the dashboard.

3.1.4.5. Estimating Size

The second transformation is to define the function types that are used for estimation in data warehousing projects. Because data warehouse architectures often follow some form similar to the architectures described in Chapter 2, the mapping table shown in Table 3.2 is used during the estimation process.

Table 3.2

Mapping Data Warehouse Components to Function Point Types [58]

DWH Component Function Point Type
Staging tables External interface file (EIF)
Target table Internal logic file (ILF)
Fact table Internal logic file (ILF)
Dimension table Internal logic file (ILF)
Lookup table Internal logic file (ILF)
Mapping External input (EI)
Process alert External output (EO)

Table adapted by author from “Function Points Based Estimation Model for Data Warehouses,” by Karthikeyan Sankaran. Copyright by Enterprise Warehousing Solutions, Inc. (www.EWSolutions.com) Reprinted with permission.

The reason why staging tables, which are actually within the boundary of the data warehouse functionality, are considered as external interface files (as opposed to internal logic files) is that they primarily hold external data as a direct copy (enriched with some simple metadata). However, if internal processing is applied to these tables, they are considered as internal logic files [28].
For the same reasons, target tables are considered as internal logic files and not external to the boundary: they are updated with data processed within the boundaries of the data warehouse function [28].
Mappings in the data warehouse implement the required logic by extracting data from source tables, transforming it, and loading it to the target tables. They are considered as external input (EI) because they alter the system’s behavior by implementing the business rules [28].
Data warehouse mappings usually make extensive use of lookup tables which map codes with more descriptive data. For example, surrogate keys are mapped against business keys to support the understandability for end-users. Because they provide such data, these tables have more value to the business user than providing technical advantages. Therefore, they are considered as internal logic files (ILF) [28].
Process alerts notify external entities of the ETL process statuses and are considered as external output (EO) [28].

3.1.4.6. Assessing ETL Complexity Factors

The third transformation is to identify the factors that have an effect on the complexity of ETL processes. Typical complexity factors are provided in Figure 3.14.
image
Figure 3.14 Cause and effect diagram for ETL complexity factors [29]. Figure adapted by author from “Function Points Based Estimation Model for Data Warehouses,” by Karthikeyan Sankaran. Copyright by Enterprise Warehousing Solutions, Inc. (www.EWSolutions.com). Reprinted with permission.
The figure shows the causes and effects of complexity factors on typical ETL projects. However, not all these factors are in correlation with the actual effort. They depend on the organization and project teams. To find out the factors that have an effect, a correlation analysis, for example using a step-wise forward regression analysis, is required.
A sample equation for a specific data warehouse project regression analysis could look like the one presented in Equation 3.1:
Sample equation for regression analysis [58]:

ActualEffort=A+B(x5)C(x9)+D(x15)E(x16)+F(x19)+G(x2x4)+H(x3x4)

image
where x5: Number of target columns
x9: Type of transformation
x15: Parameter file to be modified or created
x16: New mapping
x19: Unadjusted function points
x2x4: Amount of data processed * Number of transformations (interrelated factors)
x3x4: Performance criteria * Number of transformations (interrelated factors)
The actual equation for the project’s regression analysis would also contain the regression coefficients that are depicted as characters A to H in Equation 3.1.

3.1.4.7. Applying Function Point Analysis to Data Warehousing

The overall goal of the estimation process is to standardize the business information system development by making the effort more predictable: because the development team estimates the required functionality using a systematic approach, it is possible to compare the estimated values with the actual values once the functionality has been delivered. When both values are compared against each other, team members can learn from those previous estimates and improve their future estimations.
The estimation process should support the IT team when the business asks for an estimated timeframe or effort for the requested functionality to be delivered. The ability to provide a profound answer is a core requirement from CMMI, in order to achieve capability levels higher than the initial/performed capability level. For example, FPA can be applied in capability level 2 (managed) in order to quantify the size of functional requirements in requirements management, estimate the effort and cost in project management, report function point data to management, etc [30].
In order to perform an estimation process using FPA, it is required to keep accurate metrics about past data warehouse development efforts to be able to use the experience from the estimation process for future estimations. This information is used to adjust the level of effort to the organization. The person hours depend on the complexity of the functionality. It should be clear that difficult functionalities will take longer to implement than easy functionalities (per calculated function point). Table 3.3 shows an example that is valid within one particular project.

Table 3.3

Person Hours per Function Point

Complexity Factor Person Hours per Function Point
Easy 0.1
Moderate 0.2
Difficult 0.7
Note that Table 3.3 has to be adjusted to each project under estimation and these values also change over time as developers are becoming more experienced or, due to turnover, lose experience in the team.
As we have seen in the previous discussion, the number of function points depends on the functional characteristic of the software to be built. To use FPA in the Data Vault 2.0 methodology, the functional characteristics of software (external inputs, external outputs, external inquiries, internal logical files, and external interface files) had to be adapted to reflect Data Vault projects. The following functional characteristics of data warehouses built with Data Vault are defined:
Stage load
Hub load
Link load
Satellite load
Dimension load
Fact load
Report build
In the same way, it is possible to define other functional characteristics, e.g. for point-in-time (PIT) tables, bridge tables, Business Vault entities or OLAP cubes. In general, Data Vault 2.0 loading routines are EtL patterns (small-capital “t” for transform): there is only minimal transformation of the raw data required to load the Raw Data Vault. Therefore, the function points for those transformations should be low, leading to high levels of optimization, low levels of complexity, and simple function point counts.
Consider the exemplary list of function points per work item shown in Table 3.4, used to calculate the levels of effort.

Table 3.4

Function Points and Level of Effort

Item Complexity Factor Estimated Function Points Estimated Total Hours
Build Outs Build Outs Build Outs Build Outs
Stage Load Easy 2 0.2
Hub Load Easy 2 0.2
Link Load Easy 3 0.3
Thin Satellite Load Easy 3 0.3
Wide Satellite Load Moderate 4 0.8
Dimension Load Difficult 4 2.8
Fact Load Moderate 4 0.8
Report Build Difficult 5 3.5
Unit Tests Unit Tests Unit Tests Unit Tests
Stage Load Easy 1 0.1
Hub Load Easy 1 0.1
Link Load Easy 1 0.1
Satellite Load Easy 2 0.2
Dimension Load Moderate 2 0.4
Fact Load Easy 2 0.2
Report Build Moderate 4 0.4

The example shows that each type of functionality has to be estimated independently from the other types. Column Item indicates the type of functionality. The second column indicates the complexity factor of the item. The shown values are typical. However, it is also possible that there are satellites in the easy and the moderate category (some satellites have a low number of attributes, which makes the load process much easier than the average). For that reason, multiple rows are added for satellites with varying complexity factors. The estimated function points indicate the number of function points counted for the item type. The Estimated Total Hours column is the product of the Estimated Function Points column in Table 3.4 and Person Hours per Function Point in Table 3.3.
Note that there is a distinction made between thin and wide satellites. This distinction refers to the number of columns and not the physical width of the table, which depends on the number of columns and the width of each column in bytes. In general, the more columns a satellite has, the more complex load logic is required, the more spelling errors might occur, and the more chances to load the wrong fields to the wrong targets or miss a column comparison occur. This is why this table distinguishes between such loads.
Similarly, the same concept is applied to unit tests in the second part of Table 3.4. For each item and the complexity for testing, the function points are estimated and enhanced with the total estimated person hours, which are based on Table 3.3 again. Therefore, the second part of the table turns out to be very similar to the first part. However, it adjusts for different efforts between implementation and testing. Remember that this table has to be built individually for each project and updated over time. There might be additional differentiation required between less or more complex work items (such as the satellite loads in the example in Table 3.4). To get the process started, it is important to follow the general procedure as outlined before to come up with function point estimates that relate to the actual effort behind the items being built and to track the person hours required for implementation and testing behind these function points. Therefore, tracking the hours per function point becomes an important step in the first cycle of your development effort, before you can actually estimate effort in the future. This is due to the fact that estimates are driven from past experiences within a given context. It is not possible (without complex transformation) to use the experience from one context (e.g., one organization) to estimate the effort in another context, because there are many differences between organizations – for example, the maturity level, the experience levels of development staff and management, and the ratio between internal and external staff (who bring specialized experiences to the firm).

3.1.4.8. Function Points for Enterprise Data Warehouse

While the estimated hours per function point can be drawn directly from past projects or sprints, function points per item have to be decided differently (but this can be done organization-wide and needs less maintenance). There are some general rules for deciding how many function points should be associated with various items:
Staging tables: The number of function points depends on the amount of required normalization. Consider the case of comma-separated values (CSV) flat files that require no normalization (for staging) because all columns can be added directly to staging. Compare this to XML or COBOL files that are not as easy to load into relational tables as CSV files, because of the substructures. In order to load such data, some normalization effort is required to transform the data from its structured format to a set of relational tables. You can avoid this normalization effort when loading the data into hierarchical tables (such as the XML data type), accepting a (serious) performance drop.
Staging and Data Vault loads: Depending on the ETL complexity required for loading stage tables or Data Vault entities (such as hubs, links, satellites, etc.), the number of function points are different. Function points for hubs are generally the same, regardless of the size or composition of the business key. In all other cases, this is not true: the more hubs are connected to a link, the more function points should be associated, due to a slightly more complex ETL data flow (but again, all links connecting two hubs should have the same function points associated). Also the number of satellite attributes, satellite overloading and splitting makes a difference. However, focus on the complexity of the mapping itself for this functional characteristic. As a general rule: hubs are the easiest to load, links are easy to moderate, and satellites often moderate to difficult to load.
Information mart loads: For these functional characteristics, the number and complexity of business rules and the number of additional columns that are implemented in the ETL load are the key factor. It is also a difference if you implement the business rules in ETL and or virtually in SQL views. In addition, there should be different function points for fact tables, dimensions, OLAP cubes, relational reports, etc.
Business Vault loads: They are similar to information marts because they also implement business rules.
These general rules should provide guidance to development teams when deciding on the function points associated with individual functional characteristics. Note that the estimated person hours for development but also for maintenance are drastically reduced when automating the Data Vault loading process, a concept that is beyond the scope of this book.
When organizations advance through CMMI maturity levels, they will recognize that estimation based on function points becomes easier over time. This is due to consistent and repeatable business processes which are easier to predict because experiences from the past can be actually applied to such processes. Without such consistent execution, the estimates are not well founded because the circumstances of process execution change all the time. Well-defined standards help organizations to achieve such consistent and repeatable business processes. FPA also helps to promote measurable and optimizable components, which are required to perform estimates. This goal is supported by separation of the individual components that have to be delivered to business. Without this separation, estimates would overlap functionality and therefore make the estimates less accurate. Identifying the components also reduces the confusion over what is delivered and when. Because each component has to be identified and described, it is also possible to schedule the delivery of each component.
The overall goal of the estimation process is to make the data warehouse development effort more predictable. It helps to justify the costs of the data warehouse project and secure further funding from the business. Because correct estimates build trust into the development team and the business, they are therefore a central part of the Data Vault 2.0 methodology.
Once the team has decided what and how much it is going to deliver in the upcoming sprint, the focus goes over to project execution, which is covered in the next section.

3.2. Project Execution

Being agile, the Data Vault 2.0 methodology follows Scrum for team organization and uses an evolutionary and iterative approach similar to Scrum. The following guidelines help to make this approach a success:
1. Envision initial architecture: Because there is no time within a sprint to develop the final architecture in one step, an initial architecture is required that allows an evolutionary approach.
2. Model details just-in-time: Instead of modeling the whole enterprise data warehouse upfront, model only those areas that are required to deliver the functionality in the scope of the sprint.
3. Prove architecture early: Make sure that the architectural decisions are proven early. It is better to fail early in the process and make appropriate changes to the architecture than fail later (and hard); late changes to the architecture are very costly.
4. Focus on usage: Only implement functionality with direct business value.
5. Avoid focusing on “the one truth”: Focus on the facts and the data (more details can be found in Chapter 1, sections 1.2.3 and 1.2.4).
6. Organize work by requirements: Because requirements are easier to document and modify than implementing them or modifying the implementation, there is great value for project execution having those requirements documented.
7. Active stakeholder participation: Follow Scrum by having a daily standup meeting. Make sure that stakeholders come to these meetings and participate.
The iterative approach is implemented in Data Vault 2.0 by two- to three-week sprints. The sprint length depends on the abilities of the organization. Usually, organizations start with longer cycles, such as three to four weeks, when beginning with agile methodologies but quickly try to reduce the sprint length in favor of more rapid deployments. The same applies in the Data Vault 2.0 methodology and confirms what we have seen in practice. A good start for organizations is to start with a three-week sprint and divide it into the activities shown in Table 3.5.

Table 3.5

Agile Delivery Objective

Week Activities
Week 1 Design & Develop
Week 2 Manage & Test
Week 3 Deployment & Acceptance
Table 3.5 shows that the team executes a “mini-waterfall” within the sprint. This waterfall follows the traditional software development life-cycle (SDLC) which is briefly outlined in section 3.2.1. The application of these concepts in the Data Vault 2.0 methodology is described in section 3.2.2.

3.2.1. Traditional Software Development Life-Cycle

Traditionally, data warehouse projects have followed one variant of a software development life-cycle model, called the waterfall model [31]. While there are multiple versions of it in the literature, with different numbers and names of the phases, they all follow a phased approach. In addition, these models have an extensive planning in common, followed by comprehensive design, implementation, and testing. User input is given at the beginning of the process, and then transferred into the technical system during implementation and testing. Some of these phased models allow steps backward in the process, for example if system tests have uncovered issues that require additional user input. Figure 3.15 shows a representative version of the original waterfall method.
image
Figure 3.15 Waterfall model.
The figure shows that this particular model consists of five phases [32]:
1. Requirements engineering
2. Design
3. Implementation and unit testing
4. Integration and system testing
5. Operation and maintenance
The project team starts with the requirements engineering phase and advances through the predefined phases. In order to advance to the next phase, the team has to fully complete the current phase because there is no way back to the previous phase. In the waterfall methodology, the project usually fails if the results of a previous phase need to be modified. This inability to cope with changes during the life-cycle of the project is the major drawback of the waterfall model in data warehousing projects (similar to projects which deliver online transaction processing systems).
Despite its drawbacks, such as long project cycles [33], the waterfall model is the predecessor for many modern methodologies in data warehousing. Therefore, the next sections will cover the individual phases of the waterfall model in more detail.

3.2.1.1. Requirements Engineering

In this phase, the project team gathers and collects all business and technical requirements from the organization. The primary output of this phase is the “Data Warehouse Definition” document, which is the equivalent of the “Software Requirements Specification (SRS)” document in operational software engineering. The document fully describes all required features and limitations of the data warehouse to be built. That includes the following requirements:
Business area data requirements
Architecture requirements
Audit requirements
Archive requirements
The major challenge in this phase is to consolidate an unambiguous collection of the user requirements, which is often difficult because different user classes often have contradicting requirements. Therefore, this phase is often the most difficult and time-consuming phase in the waterfall model [32]. In order to collect system requirements, analysts use various traditional and modern methods. Traditional methods include the following [34]:
Interviewing individuals with deep knowledge of the operations and business processes of the current and future system.
Observations of workers at selected times to understand how data is handled and collect the information needs of those workers.
Analysis of business documents to identify reported issues, policies, rules, and directions. In addition, specific examples of data and data usage within the organization are identified.
Modern methods include the following: [34]
Joint Application Design that brings together key users, managers, and system analysts to collect system requirements simultaneously from key people.
Prototyping to augment the requirements determination process.
These methods have in common to identify and gather the requirements from business users in order to provide them to the next process steps, which are described in the following sections.

3.2.1.2. Design

During the design phase, the data warehouse designers design the architecture of the data warehouse, such as the layers and each module of the system. The definition is based on the “Data Warehouse Definition” document and includes the database definitions of each layer, such as the structure of the staging area tables, the tables in the data warehouse layer and the star schema in the data mart. For each database, the names and columns of each table are defined [32]. Often, the database definition is performed using entity-relationship (ER) tools which are used to define and document the database. Microsoft SQL Server 2012 includes SQL Server Management Studio, which can be used to quickly create and populate each layer [35] using the Visual Database Tool Designer [36]
Another area of interest is the selection of the required hardware and software which is based on the performance, security and storage requirements of the whole system. In some projects, there is an existing infrastructure for data warehousing available. In such cases, new databases have to be created for the new project and the infrastructure provider will check whether there is enough capacity in the existing infrastructure to serve the new project. In other projects, where data warehousing is introduced to the organization, new infrastructure has to be created. This task should not be underestimated and often becomes an independent project with the procurement of hardware and supporting services, such as maintenance of the future data warehouse (think of backup and restore services, deployment of new features, bug tracking, end-user support, network maintenance, etc.).

3.2.1.3. Implementation and Unit Testing

Once the data warehouse has been described (in the requirements engineering phase) and designed (in the design phase), the individual modules of the system are implemented by the data warehouse developers. While they develop the modules, they also test the modules and remove errors found in this process [32].
There are various tools included in Microsoft SQL Server 2012 to build the data warehouse. Most of these tools can be found in Microsoft Business Intelligence Development Studio. This development environment includes the following tools: [37]
SQL Server Integration Services for data integration
SQL Server Analysis Services for developing multidimensional data warehouses (OLAP cubes) and performing data mining tasks
SQL Server Reporting Services for developing reports based on relational and multidimensional data sources.
In addition, most teams use additional tools from Microsoft or third-party application vendors. Tools often used include:
OLAP front-ends to easily browse OLAP cubes or provide advanced reporting capabilities
Data mining environments to provide advanced analytical options to end-users
ER tools for defining and documenting databases
Tools for automating the data warehouse population, such as Data Definition Language (DDL) generators
Data profiling tools to better understand the raw data
Data quality tools for data cleansing and assessment.

3.2.1.4. Integration and System Testing

While the data warehouse developers have implemented and tested the modules of the data warehouse in individual units, the integration of each unit takes part in this phase. The individual units are connected to each other and integrated. This integration process starts with some modules at the bottom of the architecture which are fully integrated and tested (Figure 3.16).
image
Figure 3.16 Bottom-up testing [38].
Once the tests have passed, the modules are added to the system by integration. After the integration of these units has been completed, the whole system is tested again. When all units at the bottom that can be integrated with each other are integrated, the integration team moves to the next level and integrates the larger parts. The new larger unit is tested again to check whether all subunits work together seamlessly [32].
Because such a testing approach requires running many tests over and over again, tools for test automation are often used in this phase.

3.2.1.5. Operation and Maintenance

In the last phase of the waterfall model, the data warehouse is handed over to operations where the system is installed at the end-user premises for regular use. If end-users find bugs in the data warehouse, the operations team is responsible for correcting those bugs and handling other modifications of the data warehouse. This continuous process is performed until the data warehouse retires or is replaced by a new data warehouse [32].
In order to support the operations and maintenance team, the data warehouse team which develops the solution has to provide both an end-user and administration documentation, including specific instructions for the maintenance of the data warehouse (such as loading new data deliveries or customizing existing reports).

3.2.2. Applying Software Development Life-Cycle to the Data Vault 2.0 Methodology

The Software Development Life-Cycle is applied within a sprint of the Data Vault 2.0 methodology, as a mini-waterfall. To execute this mini-waterfall, a project plan is used. Table 3.6 shows an example for implementing a new report.

Table 3.6

Agile Project Plan

ID WBS Task Name Duration Predecessors
1 3 Agile Delivery of Single Requirements 58 hrs
2 3.1 Choose Report to Produce (Scope) 0.5 hrs
3 3.2 Estimate Work Effort 0.5 hrs 2
4 3.3 Fill in Risk Assessment 0.5 hrs 3
5 3.4 Identify Source/Stage Tables for Report 4 hrs 4
6 3.4.1 Source to Requirements Matrix 4 hrs
7 3.5 Design ER Data Vault Model 2 hrs 3
8 3.6 Add Attributes to ER Data Vault Model 6 hrs 7
9 3.7 Create ETL Data Vault Loads 4 hrs 8
10 3.7.1 Create Hub Loads 1 hr
11 3.7.2 Create Link Loads 1 hr
12 3.7.3 Create Satellite Loads 2 hrs
13 3.8 Design Data Mart Model for Report 4 hrs 3
14 3.9 Create ETL Data Vault to Information Mart 16 hrs 13
15 3.9.1 Build Dimension Loads 8 hrs
16 3.9.2 Build Fact Loads 8 hrs 15
17 3.10 Build Report and Produce Output 8 hrs 13
18 3.11 Create Source-to-Target Report for Project Documentation 2 hr 5;8;13
19 3.12 Unit Test 4 hrs 17
20 3.13 Record Actual Effort 0.5 hrs
21 3.14 Sign-off 1 hr 20
22 3.15 Deploy to Test Environment 2 hrs
23 3.16 Run User Acceptance Test 2 hrs
24 3.17 Deploy to Production 1 hr 22;23

The ID identifies the task in the project management tool, such as Microsoft Project. It is primarily used internally, such as in the Predecessors column, which provides information about dependencies between individual tasks. The WBS column is used to add a project-wide reference string to the task. The next section discusses how to utilize this identifier. Column Task Name provides a user-readable name and Duration the estimated amount of time that is needed in order to complete the task. In addition to the duration, many projects add a Work column that is used to estimate the work effort. This is required, because there is a difference between the work required and the duration when more than one full-time employee can work on a task. This can be used in addition to the estimates from Function Point Analysis (refer to section 3.1.4). Most project management tools, including Microsoft Project, support an optional Notes column, not shown in Table 3.6, which can be used to include references to additional dependencies (using their technical number) in order to identify the remainder of the artifacts. This concept is equal to the project-wide reference string in the WBS column and is described in one of the next sections, as well.
Note that the project plan in Table 3.6 shows durations that are calculated for a two-week sprint, with 58 hours total. This example also assumes that automation tools are used for creating the ETL Data Vault loads (item 3.7). If this is not the case, it is recommended to add detail tasks for hub, link, and satellite loads (beneath items 3.7.1, 3.7.2, and 3.7.3). If the length of the sprint is different (either three weeks or a different number of work hours per week), it is possible to recalculate the durations accordingly. Recalculating the sprint lengths might be required if you don’t use automation tools, because it will be difficult to achieve a two-week sprint without automation. Note that some task durations should keep the times depicted in Table 3.6 because the duration is static (the sign-off procedure is such an example). It makes no sense to add 50% to the duration when transforming this table into a three-week sprint. At any rate, it is required to adjust the durations to the needs of the project. And while scoping (task ID 2 to 4) is critical to the success of the project, it should be noted that the task should not require more than two hours.
There are variations to this project plan for sprints that focus on other activities than implementation, for example for requirements gathering, user acceptance testing, or infrastructure setup.
The project plan also shows that there are certain deliverables produced over the course of the project. This is not only limited to database models or ETL data flows. A focus of the Data Vault 2.0 methodology is to produce documentation valuable for both the business and IT. Necessary documentation includes:
Business glossary: This document helps building information marts because business objects and terms that are related to them are identified and documented.
Requirements documentation: This document describes the information marts and reports in detail. There should be no functionality in the data warehouse solution that has no corresponding requirement recorded in this document. This document should be kept rather short, e.g., by using user stories around one page per requirement.
Project plan: The project plan focuses only on tasks that need to be executed during one sprint.
Abbreviations glossary: Common abbreviations in the business or in the technological field of data warehousing are provided in this document.
Scope or statement of work document: This document describes the scope of the sprint and reflects what was agreed upon. It is an important source for the sign-off procedure at the end of the sprint.
Change request document: Each request to change requirements that have already been implemented requires a documented process that is based on a change request document.
Delivery and sign-off document: When the project team delivers new functionality at the end of the sprint, it requires a sign-off from the business before it can get rolled out. This document states that the delivery meets or exceeds expectations as outlined in the requirements documentation or change request document.
Roles and responsibilities: This document identifies the roles in the project team and the responsibilities that are associated with them.
Work breakdown structure: Breaks down the overall deliverable (the data warehouse solution) into manageable components.
Process breakdown structure: Each business process supported by the data warehouse should be described using a business process diagram. It should be modeled to a level of detail in which data sets and their business keys can be identified.
Data breakdown structure: For each (scoped) business report, there are two tables: one that maps the report to source tables, and the other that maps the report to the Data Vault source for the information mart output.
Organizational breakdown structure: This structure displays organizational relationships and can be used to assign resources to the project. It is created in conjunction with the work breakdown structure. It also links individual team members to the roles as defined in the roles and responsibilities document.
Data model standards: The data model standards document provides naming conventions for Data Vault entities, facts and dimensions, and attributes of those entities. It provides information about agreed standards to model specific entities, system attributes, etc.
ETL standards: This document describes how control or data flows are implemented, such as naming conventions, documentation requirements, and physical design issues, among others.
Above list shows that some of these documents reference each other. To maintain this process, it is recommended to use project-wide technical numbering (a concept described in section 1.2.4) to identify each artifact in the documentation and in the implemented solution. Otherwise, it is not possible to uniquely cross-reference these artifacts within the project. Figure 3.17 shows an organizational breakdown structure example.
image
Figure 3.17 Example of an organizational breakdown structure.
In this structure, each role is associated with a team member whose name is given in the diagram. Project management standards such as the project management professional (PMP) require that project plans track roles instead of individual people because individuals can play only a partial role in a project, but each role must be filled to 100% effort. Otherwise the project schedule cannot be met. The same is true for CMMI. In addition, each role is identified by using technical numbering. Note that if there were two ETL developers, both would have the same technical number, because the technical number is a cross-reference to the roles and responsibility document, described in the previous list. It is not uncommon that an individual person fills multiple roles. We have seen individuals filling more than four roles!

3.2.3. Parallel Teams

Having defined roles and responsibilities helps to scale the project up by adding more team members and entire teams to the project. Each team operates on small scoped deliveries, with no dependencies to other teams. All work is done in parallel with little or no synchronization required. They use the same templates as defined in this chapter, and produce documentation that follows the same guidelines. When implementing and delivering business requirements, the teams who work in parallel synchronize their data models using the link entity, which is discussed in Chapter 5, Intermediate Data Vault Modeling.
With an existing Data Vault team, new team members are not required to have a lot of prior knowledge or Data Vault skills. In order to add new human resources to a running project, the following skills, besides the knowledge of the development environment and development rules, are required (by task):
Source to stage loading: new team members need to know how to create new stage tables and load the data from source tables. In the best case, this requires only a CREATE TABLE and an INSERT INTO … SELECT FROM construct in SQL.
Stage to hub and link loading: Again, very similar and simple. It requires only a SELECT DISTINCT, some filtering to handle only nonexisting records, and INSERT INTO statement to load hubs and links.
Stage to satellite loading: When using only SQL statements, only a SELECT DISTINCT, row comparison, and an INSERT to store the actual data.
This list should make it clear that it is not required to have a lot of Data Vault skills to add additional resources to a project where Data Vault experts are already existent. The more experienced developers and modelers can guide new team members to accomplish these tasks. Note that these skills are applicable for teams without using ETL tools. In addition to these skills, knowledge is required in the selected ETL tool, such as Microsoft SQL Server Integration Services. Chapter 12, Loading the Data Vault, shows how to actually load the data into the Data Vault using Microsoft SQL Server.
In addition to parallel implementation of business requirements, there are other teams that are focused on different activities in the project, such as requirements gathering, data mining, managed self-service BI, etc. These activities are also run in parallel to the implementation.

3.2.4. Technical Numbering

Section 1.2 introduced a concept called technical numbering that was used in project documentation to identify individual artifacts. Technical numbering is the assignment of decimal point based numbers to text documents and paragraphs that describe artifacts and other pieces of important information. It is also called scientific numbering. The goal is to identify each artifact in the documentation and in the implemented solution uniquely within the project. It should be applied to every document or artifact produced or utilized within every project or sprint.
Examples for artifacts are:
One single role in the roles and responsibilities document
One change request in the change request document
One single requirement in the requirements document
One task in the project plan
One business object in the business glossary
One abbreviation in the abbreviation glossary
When assigning technical numbers to these artifacts, a hierarchical and incremental approach is used. The numbering is incrementally assigned to each artifact, reflecting the hierarchy as well. Table 3.6 has shown this approach by assigning dot-separated numbers to each task. Each subtask was assigned a number that was prefixed with the WBS number of the parent task, separated by a dot from the incremented number of the subtask.
If technical numbering is applied in document processing software, such as Microsoft Word, it is a good practice to manually assign the numbers and avoid using automated numbering of headings, because these automatic numbers are reassigned when a heading is inserted in between two other headings or they get rearranged. It is important to avoid changing technical numbers once they have been assigned to an artifact. There should be no renumbering of these artifacts in order to support cross-referencing between applications.
There are different applications where these artifacts are cross-referenced by their technical numbers:
Requirements to source tables: This is probably the most powerful cross-reference mapping because it identifies the source tables and the attributes that are used by a specific requirement. There should be one line per requirement to identify the sources for all requirements. This is one of the data breakdown structures as mentioned in the previous section.
Source tables to Data Vault tables: This mapping is created before the ETL jobs to load the Data Vault tables are created and indicate the source table and Data Vault targets.
Data Vault tables to information mart tables: Similar to the previous mapping, this document shows how the data is mapped from the Data Vault tables to the information mart. This document should be a simple matrix without indication to business rules. They are supposed to be documented in the requirements documentation.
Requirements to information mart tables: This matrix is similar to the first mapping and indicates the information mart tables that are used by specified requirements. Again, there should be one line per requirement. This is the second data breakdown structure as mentioned in the previous section.
The best approach is to provide these mappings as cross-reference matrix tables in a modeling tool or (if no better option is available) in a spreadsheet program, such as Microsoft Excel. Table 3.7 exemplifies how a data breakdown structure should look.

Table 3.7

Requirements to Information Mart Tables Example

Requirements to Target Map
XREF
Requirement Document: MyDoc
Table
Logical Name Physical Name Business Key Passenger Airplane Utilization Connections
Passenger Information PASSENGER X
Connections CONNECTION X
Airplanes AIRPLANE X X
Table 3.7 shows requirements to target map, also known as requirements to information mart tables. It describes which information mart dimension or fact tables are used by a given report or OLAP item. There are three reports in this example: Passenger, Airplane Utilization and Connections. While the Passenger report uses only the Passenger Information table in the information mart, the Connections report uses the Connections and the Airplanes table. These entity names are the logical names; the physical names are also provided as a reference. In addition, this table references the requirements document where the reports are defined in more detail (there might be multiple requirements documents in a project if the team decides to split the requirements up, e.g. per function, etc.).
It is a good practice to use acronyms as a prefix to the technical number, to provide an easy indicator of the artifact type that is being numbered.
Table 3.8 shows only examples for such acronyms. Usually, organizations already have a set of acronyms in place, which should be utilized.

Table 3.8

Example Acronyms for Artifact Types

Document Type Acronym
Business Requirements B2.2
Technical Requirement T5.1
Organizational Breakdown Structure O3.3
Process Breakdown Structure P2.4
Data Breakdown Structure D23.2
Work Breakdown Structure W9.9
Change Requests C25.5
The ability to identify single documents and artifacts is a prerequisite for measuring them. Without proper identification, this is not possible because actual efforts cannot be correctly associated with them. And without the ability to measure the actual effort, it is not possible to compare it to the planned effort and, in turn, not possible to optimize the development processes. This optimization of development processes is performed in the review and improvement phase of the sprint. The required concepts are described in the next section.

3.3. Review and Improvement

Before the team completes a sprint and starts with the next one, the team goes into two relatively short meetings:
Sprint review meeting [39]: during this meeting, the produced artifacts are reviewed by the team, the product owner, and other stakeholders, such as the end-user.
Retrospective meeting [39]: just after the sprint review meeting, the development team meets to identify those activities during the sprint that need improvement.
The first meeting focuses on the product: participants review whether the features meet the expectations and the documented requirements. For that reason, the participants in the meeting are relatively broad and include everyone who has a stake in the features under review. If the attendees in the meeting identify problems or variations from the defined requirements, a change request has to be created and implemented in a subsequent sprint. In order to perform this review meeting, the team must be able to identify the features that are expected and trace them all the way back to the initial requirements. This is why technical numbering, outlined in section 1.2.4, plays such an important role in the Data Vault 2.0 methodology. Improving the project outcomes is not possible if the team is unable to fully identify the source of issues, but this is a requirement for successful optimization of the project.
The optimization of the project also requires reviewing the process itself. This is done during the retrospective meeting. The team reviews the activities that have been performed during the iteration and decides how to improve them in order to improve the overall project execution. The process review also includes a review of the initial estimates for the change requests of the iteration. This is performed for the very same motivation: to identify the causes for under- or overestimation and stop them. Sometimes, agile teams argue that agile development doesn’t require estimation of change requests. But this is a problem in enterprise organizations, as overall project management needs estimates in project controlling and budgeting.

3.3.1. Six Sigma

Six Sigma plays an important role in this process improvement effort. The principles from Six Sigma are applied in order to achieve maximum optimization in agility of the process of building and implementing enterprise data warehouse systems with the Data Vault 2.0 standard. Six Sigma relies on measurements (estimates vs. actuals), or KPIs to determine what went wrong at the project level, how badly out of alignment the sprint is, and what needs to be done to the process to bring it back into compliance.
This is the process side of Six Sigma as applied to “error correction” or “optimization” of the process of building business intelligence systems. Note that these measurements and KPIs should measure teams, not individual team members. By doing so, the Data Vault 2.0 methodology puts people first, as in other agile methodologies, including Disciplined Agile Delivery (DAD) [13]. If people realize that they are in fact being measured, they will find ways to subvert such measurements. It is also illegal to measure the productivity of individuals in certain legislations [13]. Consider metrics as potential indicators for performance. To find out what the real causes of the problems in a project are, talk to the people in the project, because they most probably know what’s going on [13].
Six Sigma also applies to the data itself, when we turn data into information and deploy it to the business and test environments. How many “bugs” were found in testing is a metric that indicates how “bad” the data is and how many errors have been found. Measuring the errors using Six Sigma provides metrics around the quality of the processes being built within the business intelligence system. The fewer errors that are made (over time) and the more optimized and streamlined the processes become, the better, faster and cheaper the team can execute, and the more agile the team will be.
Six Sigma is a very popular program to eliminate defects from process and products [41]. It is “a strategic initiative to boost profitability, increase market share and improve customer satisfaction through statistical tools that can lead to breakthrough quantum gains in quality.”[42] The program is a “new strategic paradigm of management innovation” and fosters “statistical measurement, management strategy and quality culture.”[43] The advantage of Six Sigma is that it provides information about the quality of products and services and creates quality innovation and total customer satisfaction. In addition, Six Sigma maintains a quality culture [44].
The key concept behind Six Sigma is to improve the performance of processes to attempt three targets: [44]
1. Reduce the costs of the processes
2. Improve customer satisfaction
3. Increase revenue and thereby increase profits.
A process in Six Sigma is defined as in most other disciplines of management. It is an activity or series of activities that transform inputs to outputs by using a repetitive process.
There are many types of inputs to processes that apply to data warehousing projects: labor, material (such as office supplies), decisions, information and measurements. While a product is the predominant output for the processes of most companies in manufacturing, it could also be a process or other deliverable as in R&D-centric organizations [44].
It is common that the results of a process execution vary in terms of quality, even if the process itself is of a repetitive nature. No two products are the same and the differences might be large or immeasurably small. But they are always present. It is possible to analyze the variation of the process outcome and then measure and visualize the outcome. There are three characterizations that describe the variation [44]:
Location (the average value of the quality)
Spread (the span of values)
Shape (the variation’s pattern).
The more variation a process has, the lower the quality of the output. Hence, it is the number one enemy of quality control [44]. However, the variation depends on other factors in the organization or project, which are depicted in Figure 3.18.
image
Figure 3.18 Process Performance Triangle [54].
The variation in Six Sigma is equivalent to the standard deviation, a statistical measurement of variation. In statistics, this variation is denoted by the Greek sigma letter: σ. Six standard deviations is the definition of outcomes as close as possible to perfection. As Figure 3.18 shows, the other factors are cycle time and yield. The yield is the success rate of the process outcomes, expressed as a percentage, indicating the percent of outputs with an acceptable quality [45]. Table 3.9 provides an overview of the performance levels that can be reached with various levels of standard deviations (hence variations) [45].

Table 3.9

Sigma Table [55]

Sigma Defects per Million Yield
0.0 933,193.0 6.7 %
0.5 841,345.0 15.9 %
1.0 691,462.0 30.9 %
1.1 655,422.0 34.5 %
1.2 617,911.0 38.2 %
1.3 579,260.0 42.1 %
1.4 539,828.0 46.0 %
1.5 500,000.0 50.0 %
2.0 308,538.0 69.1 %
2.5 158,655.0 84.1 %
3.0 66,807.0 93.32 %
4.0 6,210.0 99.379 %
5.0 233.0 99.977 %
6.0 3.4 99.9997 %
Sources for variation are manifold. The types of variation are classified into common causes and special causes.
Common causes happen in every repetitive process that has a stable and repeatable distribution over time. It is not easy to remove common causes. Only if the design of the process itself is changed, it is possible to reduce common causes (but also the redesign might introduce new variation). Therefore, variations that are classified into common causes are found everywhere. The upper part of Figure 3.19 shows the variation of a stable and predictable process with variation resulting from common causes.
image
Figure 3.19 Common and special causes for variation [32].
The second type is the special causes, also called assignable causes. This is displayed in the second part of Figure 3.20. These factors refer to causes that are uncommon to the typical process and change the process distribution. If these factors are left unaddressed in the process, they will affect the process output in an unpredictable way. The existence of special causes prevents stable processes [32].
image
Figure 3.20 Breakthrough results in Six Sigma [47].

3.3.1.1. Applying Six Sigma to Software

Six Sigma was originally designed and developed for manufacturing and other processes that are more mature than software engineering processes. However, because it is a domain-independent initiative, it is possible to apply the concepts of Six Sigma to other, less mature disciplines as well. That is because software engineering follows a process model somewhat similar to processes in manufacturing. However, software engineering processes often include innovative and creative tasks, but that is actually similar to other engineering processes. To the process definition given in this chapter, it doesn’t matter if a process is ad-hoc, different every time, or highly repetitive. In any case, it is a process that follows our definition [46].
It is possible to collect a large number of measures regarding the processes in software engineering [46]:
the time between start and end of a process step
the number and quality of outputs
the estimated product performance
etc.
And because the owners of the processes have the same interests as the ones in their manufacturing counterparts, e.g., improving the quality of the process output, improving performance, better meeting customer needs, etc., Six Sigma can be applied to software engineering processes as well. However, because of differences between software engineering and other engineering disciplines, additional thought is required [46].
Often, the overall process cycle time is much longer in software engineering than in creating machine-manufactured goods. Therefore, Six Sigma projects might take longer or might have a greater risk, due to less data for statistical analysis [46].
The intensity of human interaction is much higher than in many other manufacturing areas. It also involves creative elements throughout the project life-cycle. Six Sigma teams might focus on the repetitive tasks within the project (such as inspections) or they might focus on the human factors. In any case, it is important to carefully normalize the data to make sure that the comparisons are valid [46].
In software engineering, there is only one master copy produced. The duplication of this master copy is simple and can be easily made without variation of the produced output. However, developing the subcomponents of the software is done only once and there might be variation between the individual subcomponents of the final product. Another source of variation is the implementation of the software into the user’s environment [46].

3.3.1.2. Six Sigma Framework

Corporations that decide to implement Six Sigma in their organizations rely on a Six Sigma framework with several important components. There are three major elements that drive the framework: top management commitment, stakeholder involvement and the improvement strategy. The latter consists of the five DMAIC steps (define, measure, analyze, improve, and control; see next section for details) and is based on training schemes, project team activities and the measurement system [32]. All these components drive the three different Six Sigma functions: Design for Six Sigma, Manufacturing Six Sigma, and Transactional Six Sigma [32].
Top level management commitment is required because Six Sigma is a strategic management decision that has to be initiated by top-level management. In order to become a success, all elements of the framework, including the improvement strategy, require top-level management commitment [40]. Special attention by the top management should be given to the training program and project team activities, because they are seldom successful without strong top-level commitment. It should be clear that true commitment is required and not just empty promises. Instead, pragmatic management is required that drives the initiative for several years [32].
However, not only is the top management committed to the Six Sigma initiative success. Instead, full stakeholder involvement is required. All employees, suppliers, customers, owners and parts of the close society should become involved in the Six Sigma improvement process. The majority of activities are performed by employees who need support by top management, for example in the availability of training courses, project team activities and evaluation of process performance. Key suppliers to the organization are encouraged to start their own Six Sigma initiatives and are supported by information sharing and participation at in-house trainings. Financial support to smaller companies is also not uncommon [32].
The success of any Six Sigma initiative depends on skilled stakeholders, such as employees. A comprehensive knowledge of the improvement methodology, the process performance and statistical tools is required. It is also important to understand the processes of the project team activities and how to deploy customer requirements. It should be clear that this skillset is not readily available within the organization and has to be built using training schemes and other knowledge transfer. For this purpose, Six Sigma provides standardized training courses with various levels. These levels are denoted by the belt rank system from martial arts: there are White Belts, Green Belts, Black Belts, Master Black Belts and Champions [32]. Importance is given to Black and Green Belts because they become the center of the Six Sigma team.
The job of the Black and Green Belts is to keep the project focused [47]. The following procedure is recommended for project team activities [32]:
1. Set up the Six Sigma team and establish the long-term management vision for the organization.
2. Educate Six Sigma champions first.
3. Select the business areas of the first introduction of Six Sigma processes.
4. Educate Six Sigma Green Belts and Black Belts.
5. Appoint Black Belts as full-time project managers to process areas in order to focus on critical quality problems.
6. Strengthen the infrastructure towards Six Sigma, for example by introducing knowledge management, statistical process control, and database management systems.
7. Make sure that top management checks the progress of Six Sigma project teams. Introduce a regular “Six-Sigma” day and organize presentations or awards for accomplishments.
To uncover new areas for process improvement, Six Sigma depends on a pragmatic system for measuring performances. It reveals poor process performance and helps to identify future problems that have to be dealt with. The measurement depends on characteristics of the product that are tracked over time and consolidated. Results are typically visualized in trend charts and other graphical illustrations [32].
As already indicated, the improvement strategy is based on the DMAIC steps for improvement. The next section covers them in detail.

3.3.1.3. DMAIC Improvement

The improvement strategy introduced in the last section is based on the DMAIC steps, an approach that is also called the Breakthrough approach.
The first step in the approach is to define the problem and clearly describe the impact on customer satisfaction stakeholder’s employees, and profitability. The project members define the following: [48]
Requirements that are critical for the customer
Project goals and objectives
Team roles and responsibilities
Project scope and resources
Process performance baseline
Process map, including the supplier, input, process, output, and customer.
It is important in this step to gather and document the customer requirements and, once understood, send them towards the operational level where project goals and objectives are set. There are several techniques that support the project team, including [48]:
Project charter
Stakeholders’ commitment analysis
Affinity diagrams
Voice of the customer
Quality analysis
Force field analysis
Pareto analysis
Process mapping
The second step is to measure the current performance to identify opportunities for improvement. After changes have been done, the business can measure its success by comparing the new performance with the past performance baseline. Several statistical tools are available for the measurement: including averages, standard deviation and probability distributions.
After having identified issues in the process, the next step is to search for the root cause during the analyze phase. Opportunities for improvement are prioritized by two dimensions: their contribution to customer satisfaction and the impact on profitability [48].
The improvement step implements the opportunities identified in the previous step. Project members develop solution candidates and select the solution with the best results and performance. While other improvement frameworks develop solutions by varying one variables of the process at a time, Six Sigma is using statistically designed experiments to vary multiple variables simultaneously and obtain multiple measurements under the same experimental conditions [48].
The last step of DMAIC improvement is the control step. Its goal is to control the improved processes and to make sure that the Six Sigma initiative sustains. If, however, the results of the improvements made in the last steps are at risk, the DMAIC improvement can start again, as Figure 3.21 shows.
image
Figure 3.21 DMAIC improvement methodology [49].

3.3.1.4. Applying Six Sigma to Data Warehousing

Both meetings, the sprint review meeting and the retrospective meeting, are required if the organization aims to reduce the iteration length from four to three weeks or from three to two weeks. Without constant improvement of both the ability to deliver the right features in the expected quality and the activities that lead to these artifacts (the process perspective), the team will not be able to achieve such goals. If teams want to reduce the iteration lengths, they have to review the activities themselves and check how much time is spent on each individual activity. The team then decides where too much time is spent (e.g., on documentation, implementation, etc.) and has to figure out how to reduce the time for these activities. In some cases, technology might help, for example blue-green-deployment, which we will describe in Chapter 8, Physical Data Warehouse Design, or ETL automation. In other cases, scoping is key to achieving shorter sprint durations by removing the functionality that is not required in the first deployment of a feature. Another factor is the people themselves: additional training can help to achieve such improvements regarding the duration, or more and better resources (technology, organizational and human resources).
With this approach in mind, there is not much difference between software development and data warehouse development in respect to Six Sigma. Therefore, the same concepts as regarding the application of Six Sigma to software apply (see previous section titled “Applying Six Sigma to Software”).

3.3.2. Total Quality Management

In order to achieve superior quality, management and teams often refer to Total Quality Management (TQM), a set of theories, methods, techniques and quality strategies for achieving quality to compete against world-wide competition. TQM is a management process, with the emphasis on continuous quality improvement. The term Total in TQM refers to the fact that everyone in the organization and every organizational function should participate in the continuous improvement of quality. In that sense, Quality means to meet or exceed user expectation on a product’s or service’s quality. Management means to improve and maintain business systems, including their related processes and activities [50]. Typical activities include [50]:
Design of experiments
Quality circles
Value engineering
Cost of quality
Information systems
Taguchi methods
Total productive maintenance
Statistical process control
Quality assurance
Robust design
Computer-integrated design
Quality function deployment
Continuous improvement
Participative management
Not included are activities that are primarily of interest in the manufacturing industry, such as Manufacturing Resource Planning. However, some of the activities can be transferred to data warehouses, especially for DWH systems built with the Data Vault standard. Also, there are activities that are already described in other concepts in this chapter (or will be described in subsequent sections). For example, participative management is already applied in Scrum: instead of making decisions at the top of the project organization, decision authority is delegated further down the organizational line. The same is true for TQM: responsibility is extended to the lowest possible level. Project members must be empowered to make an informed decision to improve the quality of the product or service. They make decisions in this regard without prior approval from superiors [50].
Typical TQM implementation efforts follow a phased approach that consists of the five phases as presented in Figure 3.22.
image
Figure 3.22 Successful TQM implementation in five phases [50].
As the figure shows, the five phases are the preparation phase where considerable time, thought, resources, and energy are expended before the implementation of TQM to reduce the risk of failure [50]; the planning phase where people get together and set up time tables and objectives [50]; the assessment phase that is used to better understand the internal organization, external products or services provided, competition, and customers [50]; the implementation phase in which quality practices and their support systems are deployed within the organization [50]; and the networking phase where participants of the TQM effort get connected with similar efforts within the rest of the organization to form stronger linkages and alliances [50]. However, you should not become confused by Figure 3.22. Only the preparation phase is implemented once in the organization. The other phases are continuous and evolving activities that are repeated in the TQM implementation to further improve quality [50].

3.3.2.1. Data Quality Dimensions

Because the focus of the Data Vault 2.0 methodology is on the data quality management aspects of TQM, it is worth looking at two methodologies that can become part of a TQM effort in data warehousing.
Both methodologies rely on objective assessments of the data quality. Data quality on the other hand, has many dimensions that are of interest for business users, and therefore can be used to classify the quality of data (or information). Table 3.10 lists common data quality dimensions.

Table 3.10

Data Quality Dimensions [51-53]

Dimension Definition
Accessibility Indicates the extent to which the data is available or easily and quickly retrievable by the business user
Appropriate Amount of Data Provides information about the appropriate volume of data for the business user’s task
Believability Indicates the extent to which the data is believed to be true and credible by the business user
Completeness Defined by the extent of available data, that is, not missing data and if the data is available in sufficient breadth and depth for the task of the business user. It is defined as expected comprehensiveness. Optional data that is missing doesn’t affect the completeness of the data.
Concise Representation Indicates if the data is represented in a compact format
Conformity Indicates if the data is represented in the same, consistent format if available at multiple locations. It ensures that standard data definitions are met, including data type, size and format
Ease of Manipulation Determines if the data is easy to manipulate and apply to different tasks
Free-of-Error Indicates if the data is free of errors and therefore correct and reliable
Integrity Indicates if the data is valid across data relationships
Interpretability Indicates if the data is using the right language, symbols, definitions, and units
Objectivity Defines the extent to which the data is unbiased, unprejudiced, and impartial
Relevancy Indicates if the data is applicable and helpful for the business user’s task
Reputation Provides information about the reputation of the data source or content
Security Indicates if the data is properly secured in terms of properly restricted access
Timeliness Provides information about the business user’s perception regarding the up-to-dateness of the data
Understandability Indicates if the data is easily to comprehend by the business user
Uniqueness Ensures that data is not stored redundantly
Value-Added Provides information about the benefit and advantage of the data for the business user
The assessment of these data quality dimensions can be task-independent or task-dependent. Task-independent assessments require no knowledge about the context of the application and can be applied to any data set. Task-dependent dimensions on the other hand require knowledge about the business rules of the organization, regulations of the company or legal authorities [54].

3.3.2.2. Total Data Quality Management

The first methodology is Total Data Quality Management (TDQM), which applies human resources and quantitative resources to improve products and services, similar to TQM. TDQM supports database migration, promotes the use of data standards, and the use of business rules to improve databases [55]. There are four cyclic phases in TDQM, which are shown in Figure 3.23.
image
Figure 3.23 TDQM Phases [56].
The first phase is the definition phase, where the data is analyzed and business requirements are gathered. The information manufacturing system which processes the information is also defined. The output of the phase is a logical and physical design of the information product with attributes related to quality and a quality E/R model which defines the information product and the information quality. The second phase is the measurement phase that defines the metrics for the information quality and uncovers problems in information quality after an analysis. The third phase is the analysis phase that analyzes the information quality problems found in the previous phase and identifies the root cause of errors. The fourth phase is the improvement phase where key areas for improvement are selected along with strategies and techniques. These strategies and techniques are applied within the definition phase of the TDQM when the cycle starts over again [56].

3.3.2.3. Data Warehouse Quality

The second methodology is the Data Warehouse Quality (DWQ) methodology that has been developed by the European Data Warehouse Quality project [67]. While the same phases are used as in the Total Data Quality Methodology as described in the previous section, the meaning and connection of the phases are different. Figure 3.24 shows the process flow of the DWQ methodology.
image
Figure 3.24 DWQ Phases [57].
The input to the definition phase is the data definition from the operational systems, stakeholder perspectives and project and context information from the data warehouse. Relevant data quality dimensions of the data warehouse are identified including to relations to objects in the data warehouse. Business users and other stakeholders weight the quality dimensions. The measurement phase uses the quality dimensions from the definition phase and identifies dependencies among them. In the next phase, the analysis phase, the results from the measurement phase are used to identify critical areas by comparing the data quality values and the data quality requirements of the business users. The list of data quality dimensions that require improvement are used in the improvement phase to improve the data [57].

3.3.2.4. Integrating TQM with the Data Vault 2.0 Methodology

In the Data Vault 2.0 methodology, TQM serves as a governance mechanism for the application of agile methodologies, CMMI and Six Sigma. By doing so, it connects the improvement elements of these methods in order to continually improve and exceed the expectations of business users, the business sponsor, and other stakeholders.
TQM has several primary elements that are important when implementing a customer-focused continual improvement process [58]:
Customer focus: the quality in the context of TQM is ultimately determined by the customer. In the case of data warehousing, the business user determines the quality of the artifacts by the data warehouse project. Therefore, those users decide if the effort made by the data warehouse team, the training, the continual process and quality improvement were worthwhile.
Total employee involvement: to achieve superior quality of data warehouse artifacts, every employee has to be involved in the continual improvement efforts. Management has to provide the required environment to support these efforts. Continuous improvement efforts need to be integrated into normal business operations.
Process-centric: similar to Six Sigma, TQM is focused on processes. This is perfect for Data Vault 2.0, where defined processes with defined process steps produce the desired outcomes. Performance measures are monitored continually. If unexpected variations from the expected outcomes occur, they are reported to project management.
Integrated: TQM doesn’t occur within one functional team. TQM requires the integration of many different functional units, interconnecting them in order to achieve total quality.
Strategic and systematic: total quality doesn’t happen by accident. It is the result of strategic planning and strategic management and includes the integration of quality into the strategic plan of the organization.
Continual improvement: total quality cannot be achieved without continual improvement of the organizational capabilities. TQM manages these continuing efforts.
Fact-based decision making: decision-making in the improvement process is based on performance measurements. In order to provide these measurements, the organization has to continually collect and analyze data.
Communication: effective communication is required to maintain the motivation of employees at all levels of the organization.
The meetings discussed in the introduction to this section should integrate these elements in order to be successful from a TQM perspective.
Sometimes, when erroneous information is found in reports or OLAP, the organization decides not to follow the recommended TQM approach to identify the root cause of the error and fix it, probably in the source system or the business processes. Instead, the organization decides to fix the error somewhere between the source system and the front-end reports. If such an approach is followed, the only acceptable way to fix the error in the data warehouse is to apply soft business rules on the way out of the Raw Data Vault, for example using the Business Vault or when providing the information mart. Chapter 13, Implementing Data Quality, demonstrates how to implement data quality in the data warehouse. However, in the light of TQM, the goal of the effort is to achieve a closed loop process. This is done by involving the business user in aligning the data set across the source systems and correcting the error in the source system instead of in the data warehouse.
But TQM is more than just fixing data quality (DQ). While it involves data quality activities, it is the ability to see the error in the error marts, take the data into question, and then issue change requests back to the source systems in order to correct the process, or the data, or both. Without closed loop processing (as described previously: users fix and align the data sets in the source), it is nothing more than pure DQ. Instead, TQM requires that people are involved and the loop between source system and presentation layer is closed by providing feedback and removing the errors, thus closing the gaps that are found in the system as a whole.
Chapter 9 will discuss master data management (MDM), which is used to enable business users and requires that “management” and governance work together. The same principles apply to closing the gaps and aligning all the source systems to the vision of master data that the business users designate. The same chapter covers how managed self-service BI is used by business users to directly interact with the data in the enterprise data warehouse, making corrections in real-time, with the feedback loop becoming a publication of the messages (resulting from managed self-service BI), directly from the data warehouse and feeding back to the operational systems through the Service Oriented Architecture (SOA) and the Enterprise Service Bus (ESB). This requires write-back capabilities to enable business users to make corrections in source systems.
..................Content has been hidden....................

You can't read the all page of ebook, please click here login for view all page.
Reset