
Custom groups are another type of object that allow us to aggregate results on a report or document. They differ from consolidations in several aspects, the most important being that the SQL needed to calculate custom groups is executed on the RDBMS side.
Unlike consolidations, custom groups cannot perform row-level calculations; but they offer a lot of flexibility when defining the elements. A custom group element is a set of rows identified by a name and a filter condition. Thinking about the previous example: instead of manually picking all the 14 London elements of the City attribute, we would create a filter that restricts only those elements with the DESC form beginning with London.
Additionally, in the filter definition of a custom group element, we can use metrics, like in "Products of the Bike Category that sold more than 1500 units", and display results in bands like in "Bikes that sold from 1000 to 1199 units, from 1200 to 1299, 1300 units or more, etc."
Furthermore, we can expand the custom group elements and see, for example, every bike inside a band.
It is useful to think about custom groups as a collection of mini-reports stacked one above the other, each mini-report having its own filtering conditions.
In this recipe, we will create the same UK Areas as we did before, so that we see the difference in generated SQL; later we'll move on to create a more complex custom group:
- Go to My Objects folder, right-click on an empty area, and select New | Custom Group from the context menu. Leave default Empty Custom Group and click on OK.
- This is the Custom Group Editor (similar to the Filter Editor); maximize the window to have sufficient space.
- In the Object Browser pane on the left, double-click on Geography to list the attributes in the hierarchy.
- The right part of the editor is the Custom Group definition pane. Drag the
Cityattribute from the left list and drop it onto the area on the right with the text Double-click here or drag an object from the object browser to add a custom group element. - A new custom group element is created with an attribute qualification on City; in the lower-right part of the screen click on the Qualify on drop-down list and select DESC.
- From the Operator list, choose Begins with.
- Leave the Value option selected, and in the textbox to the right type
London, then confirm with OK. Now the Custom Group Editor shows one element named Custom Group Element1 containing a filter definition City (DESC) Begins with London. - Right-click on Custom Group Element1 and from the context menu that appears select Rename. Type
London Area. - Move to the left and double-click on the Country attribute to see the list of countries, pick the United Kingdom element, drag it to the right and drop it on the line that says Double-click here or drag an object from the object browser to add a custom group element, the Custom Group element2 is created with a filter definition Country in list (United Kingdom).
- In the Object Browser pane, click on the button with the icon that resembles a folder with a green up arrow (tool tip: View contents one level up):

- We're back in the attribute list, click on City, drag-and-drop it to the red [Add Qualification] line just below the Country in list (United Kingdom) to create a second filter definition on City.
- Repeat steps 5, 6, and 7. A new filter definition < Default > - City (DESC) Begins with London is added with the AND operator.
- Right-click on AND, select Toggle Operator from the menu and choose AND NOT.
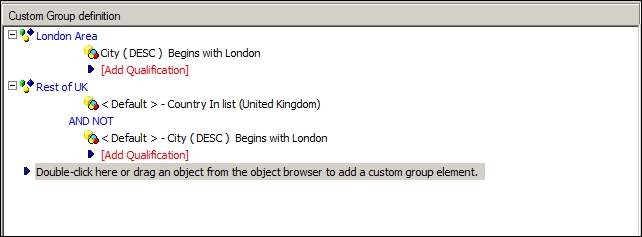
- Right-click on the Custom Group Element2 line and rename it as
Rest of UK. - The final Custom Group definition should look like the image:
- Click on Save and Close. Go to My Reports folder, create a blank new report.
- Click on My Personal Objects shortcut, double-click on My Objects, then right-click on UK Areas Custom Group and select Add to Rows.
- Browse to Public Objects | Metrics and add Sum SalesAmount from FactResellerSales to columns. Run in Grid View and check the numbers with the report we did in the previous recipe.
- Save the new report without closing it and name it
50 UK Sales with Custom Groups. - Switch to SQL View. Note the difference between this report and the previous in terms of
SELECTstatements. Close both reports.
Custom groups generate at least one query per element. In this case you can see the first SELECT filtering on:
where (a13.City + ' ' + a13.PostalCode) like N'London%'
And the second statement with:
where (a13.CountryRegionCode in (N'GB')and (not (a13.City + ' ' + a13.PostalCode) like N'London%'))
In the previous report, the consolidation used a single SQL to produce the same result.
From a RDBMS perspective consolidations are more efficient; but custom groups offer a lot more flexibility.
Now we want to see all the London elements that belong to the London Area element in the same report, but we don't need such a detail for the Rest of UK element.
A very handy feature of custom groups is the ability to detail the single item that fit into a group element. Let's see how it works:
- After closing all reports, move to My Objects folder, and double-click on UK Areas Custom Group to edit.
- Right-click on the first element named London Area, from the context menu select Show Display Options.

- Click on the second option Show only the individual items within this element, and confirm with OK.
- Click on Save and Close.
- Run the 50 UK Sales with Custom Groups report, and see the results.
Subtotals in custom groups, like in consolidations, are not enabled by default. You may enable them in the Custom Group Editor from the menu Custom Group | Options:

There is a checkbox labeled Enable Subtotals Display.
If, on the other hand, you plan to use subtotals with custom groups, which by the way is perfectly understandable, please read on the following exercise.
Do the following:

How much is the grand total?
Can you tell why?