
Elements inside custom groups act like separate and independent filters; they add different WHERE and GROUP BY clauses to the SQL statement generated by the report. The filtering condition can be an attribute qualification as in the previous example, a metric qualification, or other objects. Metric qualifications work like filters on metrics (see Chapter 4, Objects – Facts and Metrics, and Chapter 8, Dynamic Selection with Filters and Prompts, for more details).
I personally use custom groups because they offer a high level of flexibility and may be modified over time, when reporting requirements change, with no need to touch the database schema. As a plus, you can give different formats to different elements.
Another very interesting feature of custom group is the custom banding.
Custom bands are a way to create sets of rows depending on the values of a metric. Typical use can be segmenting customers by purchase brackets or clustering products by number of units sold.
In this recipe we are creating a custom group and a report showing the best-selling bikes that sold more than 1000 units, more than 1200, and so on:
- Go to My Objects folder and right-click on the empty area to the right, select New | Custom Group and click on OK.
- Double-click on the line that says Double-click here or drag an object from the object browser to add a custom group element.
- The new element is created and named Custom Group Element1, rename it as
Best selling Products. - Double-click on the red colored [Add Qualification] text, now in the lower part of this screen select the fifth radio button labeled Add a Custom Group Banding qualification and click on OK.
- Click on the ellipses button next to the Metric textbox and select the Sum OrderQuantity from FactResellerSales metric, confirm by clicking on OK.
- Click on the Level… button. In the shopping cart that appears move the Product attribute to the Selected objects list and click on OK.
- Open the Banding type drop-down list and pick Banding Points, you will see a row in a white area with a band named Band 1, as shown in the image:

- Click on 1 displayed next to the To header and change it to
1200. - Then click on the 0 value displayed next to the From header and type
1000. - Lastly, click on the Band 1 text and name this band as
More than 1000 units. - Click on the Add New Band text.
- Band number 2 already has a From value set to 1200 in the lower limit, modify the To value and write
1400. - Rename Band 2 to
More than 1200 unitsand click on Add New Band. - Change upper limit To of the third band to a very high number such as
100000and name the bandMore than 1400 units. Click on a white area to confirm the name, the editor should look like the following screenshot: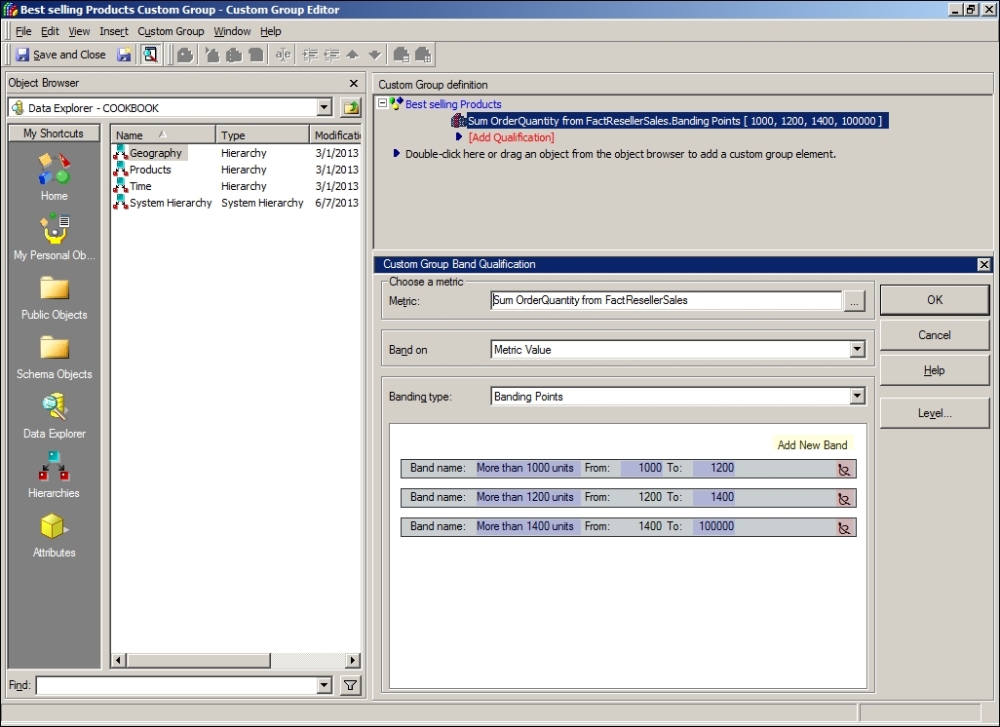
- Close this pane with the OK button, click on Save and Close, name it as
Best selling Products Custom Groupand click on the Save button. - Go to My Reports and create a blank new one.
- Browse to My Objects in Object Browser and add to rows the Best Selling Products Custom Group.
- Go to Public Objects | Metrics and add to columns the Sum OrderQuantity from FactResellerSales.
- Click on the Data Explorer shortcut, double-click on the Products hierarchy and then on Product Category and drag the Bikes element to the report filter area.
- Run the report in Grid View, observe that we have the three bands each one with its
OrderQuantityand a total for the custom group elementBest selling Products. - Save this report as
51 Best selling Bikes Bands.
The name of the custom group element—Best selling Products—will appear at the top of the first column, then in a hierarchical view, all the names of the bands will appear in a second column.
It's worth noting that lower limits are inclusive while upper limits are not: so the first band in our example is actually between 1000 and 1199, the second between 1200 and 1399, and so on. Adjust the values of the textboxes according to the expected results.
Another aspect that may lead to confusion is that the bands always go from small numbers to big numbers. There is no way to create them in reverse order that is from a higher to a lower value (at least until version 9.3.0).
The Level is actually the GROUP BY clause of the query: is the Level at which we calculate the OrderQuantity before filtering those Products that pass the 1000 threshold. Go to SQL View to see how the HAVING clause is used to restrict the result set.
What if we want to sort the banded products by OrderQuantity in descending order? It actually makes sense to have the top bikes first in the report grid. Try this:
- In My Objects folder, double-click on Best Selling Products Custom Group to edit.
- Right-click on the name of the first element to bring up the context menu, click on Show display options.
- Select the second radio button Show only the individual items within this element and click on OK.
- Click on Save and Close, go to My Reports.
- Open the report number 51 in Design View and browse to Attributes.
- Add the Product attribute to rows and run the report.
- When the grid appears, right-click on the Sum OrderQuantity from FactResellerSales header and from the context menu select Sort rows by this column | Descending.
- Now the bands are in reverse order, save the report as
51 Best selling Bikes Bands DESC.
Create a new fact: OrderQuantity from FactInternetSales
Create a new metric: Sum OrderQuantity from FactInternetSales
Modify Best Selling Products Custom Group, rename the first element to Best selling Products (Resellers), and create a second element Best selling Products (Internet) with similar bands (1000-1200, 1200-1400, 1400-100000) based on the Sum OrderQuantity from FactInternetSales metric.
Build the report 52 Best Selling Products Reseller and Internet, like the one in the following image:

Remember to update the schema and to set the custom group element display options.