
Reports and documents based on a cube give fast access to the data and are very similar to their data warehouse counterparts. The main difference is that the objects available are only those attributes and metrics present in the cube.
Of course, we can use features such as sorting, totals, prompts, and view filters as we did in previous chapters with standard reports and documents.
Drilling is limited to the objects included in the cube unless you specifically allow reports to drill outside.
To create a report based on a cube:
- Open the Web Interface and go to My Reports folder.
- Scroll down to find the 54 ResellerSales Cube and right-click on it.
- Click on Create Report. Note that the list of report objects reflects the content of the cube.
- Click on Reseller Attribute, drag-and-drop it to the area labeled Drop objects here to add rows.
- Click on the Year attribute, drag-and-drop it to the area labeled Drop objects here to add columns.
- Lastly, put the Sum USD SalesAmount from FactResellerSales metric in the data area.
- In the toolbar, click on the first button (tool tip: Run Report) to see the result. The grid appears almost immediately and no round trip to RDBMS is performed.
- Click on the first button on the toolbar (tool tip: Save As…) and name this
55 Sales by Reseller and Year. Click on OK and again on Run newly saved report. - Click on the red MicroStrategy star logo on the upper-left corner and then hit My Reports.
- Again, scroll down to find the cube number 54 and right-click on it.
- From the context menu, select Create Document. Note that the list of dataset objects reflects the content of the cube.
- Right-click on the Promotion attribute and select Add to Grouping. A new section named Promotion Header is created.
- Click-and-drag the Promotion attribute to the Promotion Header section, when a yellow border appears around the section drop the object.
- Resize the {[Promotion]} text field by dragging the small white squares, so that it occupies the whole section width.
- You may optionally drag the Detail Header gray bar up a little to reduce the white space below the {[Promotion]} text field.
- Right-click on the Detail Header gray bar and select Properties and Formatting… from the context menu.
- Click on Layout on the left and enable the checkbox labeled Height can shrink below the Size headline. Click on OK.
- Drag the Salesterritory Reseller attribute to the area labeled Drop objects here to add rows. Then drag the Sum USD SalesAmount from FactResellerSales metric to the area labeled Drop Metrics here to add data.
- Right-click on the cross arrow icon on the top left of the grid and choose Properties and Formatting… from the context menu.
- Click on Layout on the left and set the radio button Fit to contents under Height in the Size headline, confirm with OK.
- Switch to the interactive mode by clicking on the appropriate toolbar button (tool tip: Interactive Mode).
- Note that in the GROUPING pane, the combobox named Promotion has No Discount automatically selected. Click on the dropdown and choose (All).
- Now you can scroll the document and see the sales amount for each promotion.
- Click on Save As… and name it
56 Promotions by Sales territory, click on OK and again on Run newly saved document.
If you open the SQL View of the report number 55, you'll see the difference between a standard data warehouse query and a cube. In this case the SQL is:
select  [Reseller]@[ResellerKey],
  [Reseller]@[ResellerName],
  [Year]@[CalendarYear],
  sum([Sum USD SalesAmount from FactResellerSales])@{[Reseller],[Year]}
from  54 ResellerSales Cube
And the result grid appears sensibly faster than in other reports.
If you want your users to be able to navigate and drill outside the cube (for example, to the Date attribute in our case), you need to edit the cube and open the menu Data | Configure Intelligent Cube.
From the Intelligent Cube Options window, uncheck Use default settings in the Drilling group, and select the checkbox labeled Allow reports to drill outside the Intelligent Cube, see screen capture:
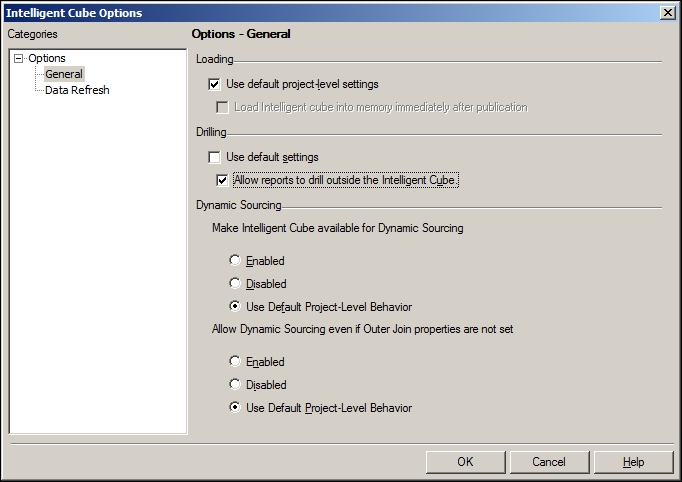
Remember to re-execute the cube in order to publish it with the new settings.