
As the application system goes live, we need to monitor its health day-by-day. Cassandra provides a number of tools for this purpose. We will introduce some of them with pragmatic recommendations. It is remarkable that each operating system also provides a bunch of tools and utilities for monitoring, for example, top, df, du on Linux and Task Manager on Windows. However, they are beyond the scope of this book.
The nodetool utility should not be new to us. It is a command-line interface used to monitor Cassandra and perform routine database operations. It includes the most important metrics for tables, server, and compaction statistics, and other useful commands for administration.
Here are the most commonly used nodetool options:
status: This provides a concise summary of the cluster, such as the state, load, and IDsnetstats: This gives the network information for a node, focusing on read repair operationsinfo: This gives valuable node information including token, on disk load, uptime, Java heap memory usage, key cache, and row cachetpstats: This provides statistics about the number of active, pending, and completed tasks for each stage of Cassandra operations by thread poolcfstats: This gets the statistics about one or more tables, such as read-and-write counts and latencies, metrics about SSTable, memtable, bloom filter, and compaction.
Note
A detailed documentation of nodetool can be referred to at http://www.datastax.com/documentation/cassandra/2.0/cassandra/tools/toolsNodetool_r.html.
Cassandra is written in the Java language and so it natively supports Java Management Extensions (JMX). We may use JConsole, a JMX-compliant tool, to monitor Cassandra.
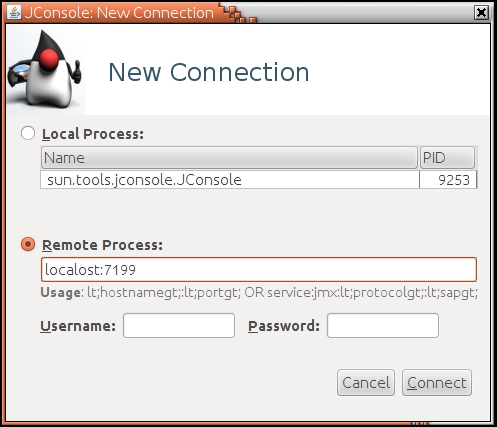
We can launch JConsole by typing jconsole in a terminal. Assuming that we want to monitor the local node, when the New Connection dialog box pops up, we type localhost:7199 (7199 is the port number of JMX) in the Remote Process textbox, as depicted in the following screenshot:
After having connected to the local Cassandra instance, we will see a well-organized GUI showing six separate tabs placed horizontally on the top, as seen in the following screenshot:

The tabs of the GUI are explained as follows:
- Overview: This displays overview information about the JVM and monitored values
- Memory: This displays information about heap and non-heap memory usage and garbage collection metrics
- Threads: This displays information about thread use
- Classes: This displays information about class loading
- VM Summary: This displays information about the JVM
- MBeans: This displays information about specific Cassandra metrics and operations
Furthermore, Cassandra provides five MBeans for JConsole. They are briefly introduced as follows:
org.apache.cassandra.db: This includes caching, table metrics, and compactionorg.apache.cassandra.internal: These are internal server operations such as gossip and hinted handofforg.apache.cassandra.metrics: These are various metrics of the Cassandra instance such as cache and compactionorg.apache.cassandra.net: This has Inter-node communication including FailureDetector, MessagingService and StreamingServiceorg.apache.cassandra.request: These include tasks related to read, write, and replication operations
Note
MBeans
An Managed Bean (MBean) is a Java object that represents a manageable resource such as an application, a service, a component, or a device running in the JVM. It can be used to collect statistics on concerns such as performance, resource usage, or problems, for getting and setting application configurations or properties, and notifying events like faults or state changes.
The most rudimentary, yet the most powerful, monitoring tool is Cassandra's system log. The default location of the system log is named system.log under /var/log/cassandra/. It is simply a text file and can be viewed or edited by any text editor. The following screenshot shows an extract of system.log:

This piece of log looks long and weird. However, if you are a Java developer and you are familiar with the standard log library, Log4j, it is pretty straightforward. The beauty of Log4j is the provision of different log levels for us to control the granularity of the log statements to be recorded in system.log. As shown in the previous figure, the first word of each line is INFO, meaning that the log statement is a piece of information. Other log level choices include FATAL, ERROR, WARN, DEBUG, and TRACE, from the least verbose to the most verbose.
The system log is very valuable in troubleshooting problems as well. We may increase the log level to DEBUG or TRACE for troubleshooting. However, running a production Cassandra cluster in the DEBUG or TRACE mode will degrade its performance significantly. We must use them with great care.
We can change the standard log level in Cassandra by adjusting the log4j.rootLogger property in log4j-server.properties in the Cassandra configuration directory. The following screenshot shows the content of log4j-server.properties in ubtc02:

It is important to mention that system.log and log4j-server.properties are only responsible for a single node. For a cluster of two nodes, we will have two system.log and two log4j-server.properties on the respective nodes.