Chapter 1. Introduction To Service Mesh
Service mesh may seem complex at first: a maze of proxies, certificates, protocols, and configuration. However, once you understand the building blocks involved, you realize how simple it really is. In this chapter, I’ll define what a service mesh is and then break down how it works. I’ll walk through a real-life example of using a service mesh, and then I’ll cover at a high level the features a service mesh provides: security, observability, reliability and traffic control.
What a Service Mesh Is and Isn’t
A service mesh is a technology that enables control of the communication between services from a centralized management plane.
By service, I mean an independently deployed application that offers an API over a network protocol–like HTTP or gRPC1. For example, two services may be a frontend application that serves a website to users via HTTP and a backend application with a gRPC API that is called from the frontend application to look up user details.
By control, I mean a service mesh can perform actions on the traffic entering and leaving a service. For example, it can disallow traffic entering the service based on a rule, like “it doesn’t have a required header”, or it can modify the traffic leaving a service, for example by encrypting it with TLS.
By between services, I mean that a service mesh operates not just at a single point on the edge like a load balancer, but at every point where services are intercommunicating. This is why it’s called a mesh.
Finally, by centralized management plane, I mean there is a single interface from which you can configure the actions that are taken upon service traffic. For example, you can click a button in the management UI and stop traffic between all services. This management plane is typically called the control plane.
Another way to define a service mesh is to look at what it’s not. A service mesh is not:
-
A load balancer deployed at the edge. A service mesh operates between all of the services.
-
In the same vein, it’s not an API gateway. It can perform some of the same actions as an API gateway, like rate limiting, but it must operate between all services, not just at the edge.
-
Interprocess communication. A service mesh requires network calls between independently deployed applications.
How It Works
One way to understand what a service mesh is, is to learn about the components involved and how they work together. A service mesh consists of two components: the proxies and the control plane 2.
Proxies (Data Plane)
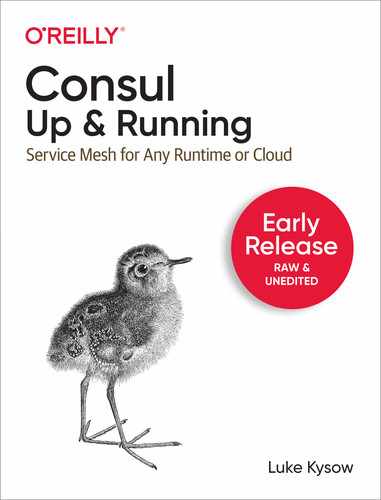
A proxy is an application that traffic is routed through on the way to its destination. Popular proxies you may have heard of are NGINX, HAProxy, and Envoy. In most3 service meshes, all service traffic (inbound and outbound) is routed through a local proxy dedicated to each service instance (see Figure 1-1).

Figure 1-1. When frontend calls backend, its request is routed through its local proxy, on to backend’s local proxy, and finally through to the backend service.
To make this possible, each instance of an application must be deployed with its own local proxy. The pattern of deploying a helper application–in this case a proxy–alongside the main application is known as the sidecar pattern and so the local proxies are referred to as sidecar proxies.
The service-to-service traffic that routes through sidecar proxies is known in service mesh parlance as data plane traffic. This is to differentiate from the traffic that is used to configure the proxies themselves which is called control plane traffic (see next section).
Proxies are a key component of the service mesh because they enable control of service traffic without modifying or redeploying the underlying services. For example, you could configure the frontend service’s proxy to refuse certain traffic without redeploying or changing code for the frontend service itself.
In order to control service traffic via sidecar proxies, the proxies must be configured. While it is possible to manually configure each proxy, this would require a new deployment on every configuration change and would require configuring each proxy individually. Configuring proxies automatically in real-time is the role of the control plane.
Control Plane
The control plane’s job is to configure the proxies in real time from a centralized location. To do so, the control plane makes API calls to each proxy to configure them. This means the proxies must be configurable via API (rather than configuration file or environment variables).
As you can see in Figure 1-2, the control plane is a separate application that must be deployed on its own; it is not deployed as a sidecar. The control plane is where most of the complex logic of the service mesh lives: it must watch for services starting and stopping, sign and distribute certificates, etc. The sidecar proxies themselves are relatively simple: they receive configuration from the control plane detailing which actions to perform on traffic, and they perform those actions.
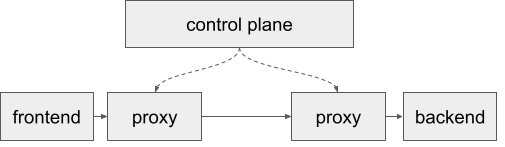
Figure 1-2. The control plane manages the sidecar proxies.
Concrete Example
Let’s go through a concrete example to show how a service mesh works in practice. In this example, we have two services: frontend and backend. Both services have only a single instance deployed–this could be a single process on a VM (virtual machine) or a single replica in a Kubernetes deployment. Deployed alongside each instance is a sidecar proxy. In the VM use-case the sidecar proxy will be running as another process on the VM. In the Kubernetes use-case, the sidecar proxy will be running as another container in the Pod.
There is also the control plane deployed. In VMs the control plane could be a separate process running on the same VM or on a different VM. In Kubernetes, the control plane would be running as a separate deployment.
When frontend and backend are deployed, they are registered with the control plane. At the same time, their sidecar proxies start up and contact the control plane for their configuration (Figure 1-3). If we assume that the service mesh is newly installed and hasn’t been configured yet, the control plane will configure the proxies with its default configuration, for example to allow all traffic.
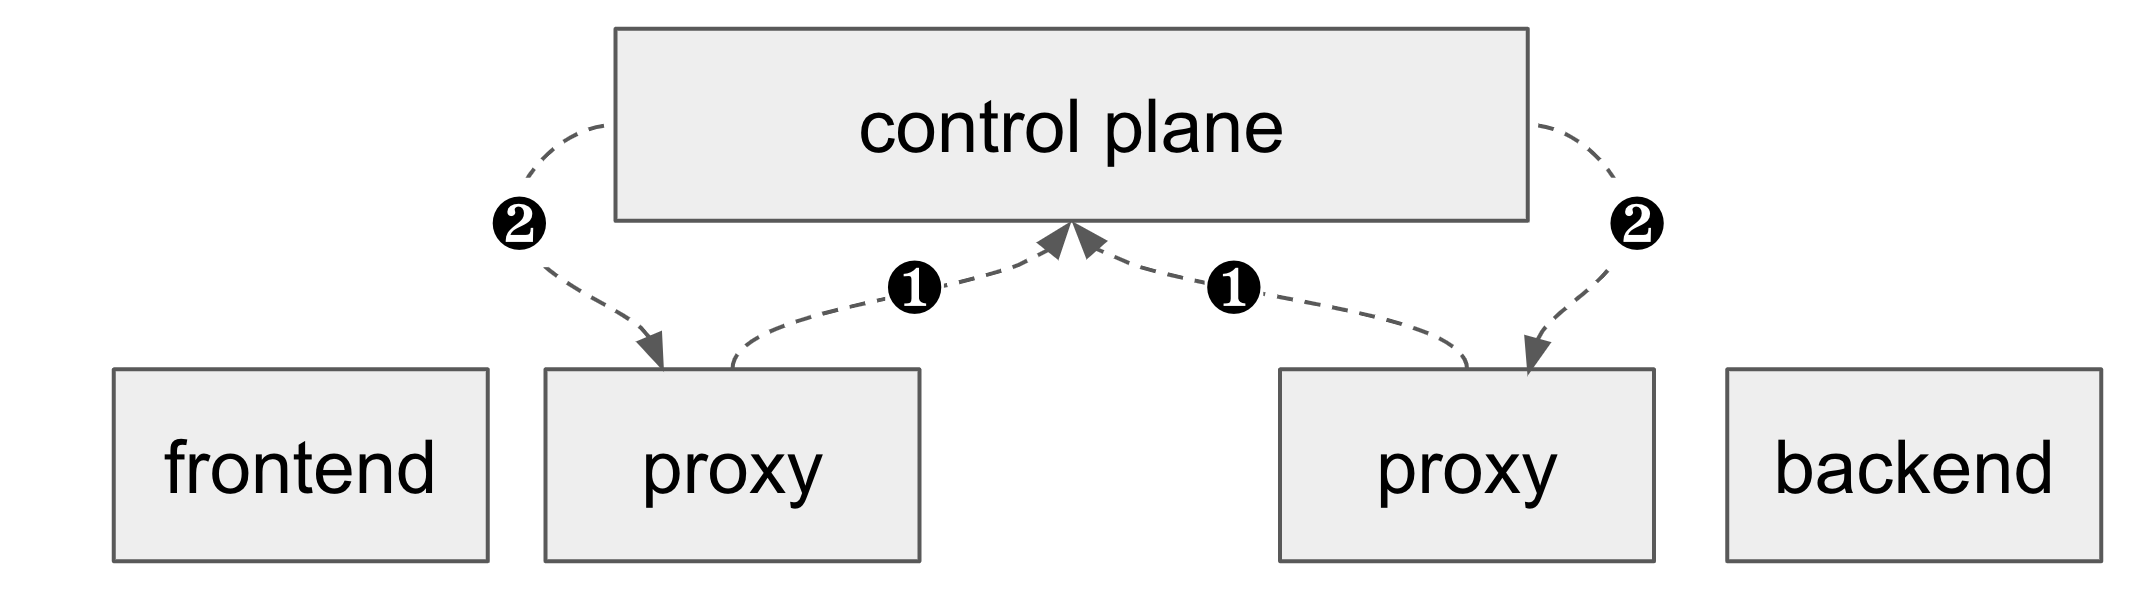
Figure 1-3. 1) Proxies start up and contact the control plane. 2) Control plane configures proxies to allow all traffic.
When frontend calls backend, its request is first routed through its sidecar proxy. The proxy is configured to simply pass traffic through to the backend service. The sidecar proxy running alongside backend captures that traffic. Since it’s configured to simply pass traffic through, it passes it along to the real backend application without modification. backend processes the request and sends a response which returns along the same path (Figure 1-4).
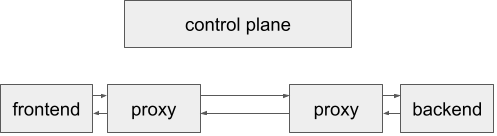
Figure 1-4. frontend’s request to backend is routed through both proxies.
Now imagine that we’ve got a new requirement to get metrics on how many requests per second (RPS) frontend is making to backend. We could make changes to the code of frontend and backend to emit these metrics, but with the service mesh in place there’s a simpler way. First, we configure the control plane with the URL of our metrics server. Immediately, the control plane makes API calls to both sidecar proxies to instruct them to emit metrics to the new metrics server. Now, when frontend calls backend through the proxies, each proxy emits a metrics to the metrics server and we can see the RPS metrics in our metrics dashboard (Figure 1-5).

Figure 1-5. 1) We configure the control plane with the metrics server URL. 2) The control plane configures both proxies to emit metrics. 3) frontend calls backend. 4) Both proxies emit metrics to the metrics server.
Notice that we didn’t have to change the code of either service, nor did we need to redeploy either service. With a single configuration change we immediately caused all proxies to start emitting metrics. This one example of emitting metrics shows how powerful a service mesh can be, and there are many other features that a service mesh provides.
Service Mesh Features
Now you understand how a service mesh operates. But what can you do with it once it’s up and running? Most of the tasks you will use a service mesh for fall under the categories of security, observability, reliability, and traffic control.
Security
One of the primary reasons companies deploy service meshes is to increase security by implementing a zero trust network. In the last few years, the zero trust network architecture has been increasingly important for security teams. Previously, companies would follow a castle and moat security architecture where services are deployed into a trusted internal network that is guarded by a firewall. This architecture assumed that everything within the internal network could be trusted, so there was no authentication, authorization, or encryption between services.
In contrast, a zero trust network is one where requests aren’t trusted simply because they’re coming from inside the internal network. Instead, all services implement authentication, authorization, and encryption. This architecture is more secure because it prevents an attacker that has compromised one service from easily infiltrating other services. The differences between the two architectures can be seen in Figure 1-6
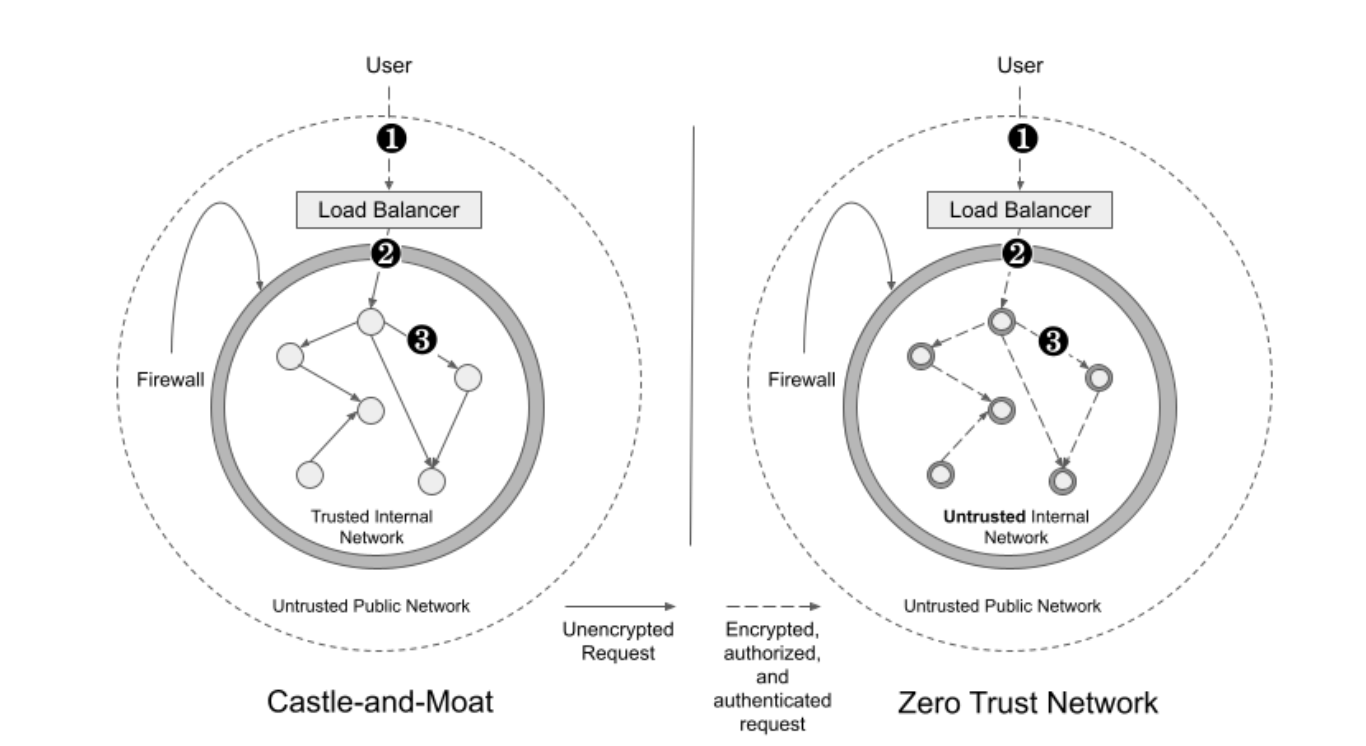
Figure 1-6. A castle and moat network versus a zero trust network.
Implementing a zero trust network is very difficult in a microservices architecture without a service mesh. Requiring every request to be encrypted means provisioning TLS certificates to every service in a secure way and managing your own certificate signing infrastructure. Authenticating every request means updating and maintaining authentication code in every service. A service mesh makes this work much easier because it can configure the proxies to implement a zero trust network without any changes to the underlying applications.
Security and zero trust networks are covered in more detail in Chapter 5.
Observability
Observability is the ability to understand what’s happening to your services while they’re running. Typical observability data consists of logs, metrics, and traces. Logs are written by service developers and are used for observing what code is executing. Metrics are statistics about the operation of the service, for example, the number of failed requests or the average time for a database call. Traces are a relatively new observability tool. A trace is data about the sequence of requests between services that happen as a result of a single user request. For example, if a user made a call through a load balancer to the frontend service, which then made a call to the backend service, the trace for that request would contain spans which show the segments of that full request path through each service.
Observability data is incredibly important for understanding microservices architectures and diagnosing failure, however it can be very difficult to configure all your services to emit metrics and traces in a unified way. Again, this job is perfect for a service mesh because all requests are flowing through proxies. The service mesh can configure these proxies to emit consistent metrics across all your services without modifying or redeploying the underlying services.
Observability is covered in more detail in Chapter 6.
Reliability
The minute you deploy more than one service, you need to deal with network problems. Issues you run into range from an occasional lost packet, to long timeouts, to complete network outages between datacenters.
There are a number of techniques you can use to handle these issues:
-
Retries: Retry a request if it fails (up to a configurable number of times).
-
Timeouts: Automatically fail a request if it takes too long to complete. This prevents your service from sitting and waiting an unbounded amount of time for a slow upstream service.
-
Health checking: Check if a service instance is healthy before sending it a request. If not, send the request to another instance that is healthy.
-
Circuit breaking: If a service is not responding, stop sending it requests for a defined period of time. Lowering the amount of traffic it’s receiving may help it recover.
-
Load balancing: Send requests to an instance of the service that isn’t under high load so that you get a response faster and you don’t overload the upstream service.
Implementing these techniques in code is time consuming, error prone, and difficult to do in a consistent way across all your services. With a service mesh, the proxies can perform these techniques for any of your services simply by configuring the control plane. You can also adjust the settings in real time as service loads change.
Reliability is covered in more detail in Chapter 7.
Traffic Control
Traffic control is about controlling where traffic between services is routed. Traffic control techniques are valuable for enabling the following use-cases:
-
Canary deployments: When rolling out a new version of your service, deploy a small number of instances running the new version and route only a percentage of your traffic to those instances. Once their metrics show that the new version is working correctly, roll out the new version fully.
-
Blue/green deployments: When rolling out a new version of your service, keep an equal number of instances of the old version running. Shift traffic to the new version and monitor its metrics. If it becomes unhealthy, you can immediately shift traffic back to the old version with no downtime.
-
Migration: Imagine you’re migrating your service from an on-premise datacenter to the cloud. Ideally, the callers of that service don’t need to be modified when the service is migrated. Traffic control can be used to change which version of the service callers are routing to, and swap them over to the instances deployed in the cloud with no downtime and with no modification to the underlying services.
Traffic control is covered in more detail in Chapter 8.
Summary
This chapter discussed what a service mesh is. It covered how a service mesh works at a high level, and you learned about its two components: the proxies and the control plane. The chapter also walked through a real-life example of a working service mesh and discussed four categories of service mesh features: security, observability, reliability, and traffic control. Everything discussed in this chapter is applicable to all service meshes. The next chapter covers the specifics about how Consul works as a service mesh.
1 gRPC is a Remote Procedure Call (RPC) framework from Google that provides increased performance over HTTP.
2 If you have multiple clusters or datacenters, you may have multiple control planes, however we’re going to keep it simple for now and assume we’re talking about a single cluster.
3 Some meshes use other technology such as iptables or eBPF to control traffic rather than a separate proxy process.