
Chapter 29
THE COST OF CAPITAL
Mirror, mirror on the wall …
Determining the cost of capital, or weighted average cost of capital (WACC), is not a simple task, but it is one of the fundamentals of finance. The cost of capital has to be factored into investment decisions because it is the rate that is used for discounting cash flows for NPV or comparing with the IRR. Cost of capital is also used to determine enterprise value (see Chapter 31). Truly, its importance can hardly be understated.
But before reading on, it is imperative to understand the distinction between cost of capital, which is the weighted average cost of the capital contributed to the firm by its shareholders and its lenders, and cost of equity, which is just one component of the weighted average of the cost of capital. The reader should also take care not to rely excessively on spreadsheets without any prior reflection.
Section 29.1 THE COST OF CAPITAL AND THE RISK OF ASSETS
When markets are in equilibrium, any investor with a perfectly diversified portfolio holds a fraction of both the company's equity and its debt. This is known as the CAPM, as was discussed in Chapter 19. In other words, each investor holds a share of the company's operating assets, since this is equal to the sum of equity and net debt. Accordingly, each investor has some exposure to the risk arising from the company.
The rate of return required by investors thus depends on just one factor: the risk arising from the assets-in-place. This means that the cost of the company's financial resources – its cost of capital – is none other than the rate of return required by investors, which is a function of the risk on capital employed.
The cost of capital is thus shaped by the economic characteristics of each sector of activity:
- The sensitivity to the economic environment: certain sectors structurally leverage changes in the economic climate. This is the case for transportation or civil works (high economic risk and hence cost of capital). Other sectors are less sensitive to downturns; this is the case for the agri-food industry.
- The cost structure (fixed vs. variable costs): the higher the fixed costs (in the cement or steel industries, for example), the more sensitive the firm is to the economic environment and the higher its cost of capital.
- The predictability of the activity: between a shopping mall operator benefiting from long-term rents and a fighter aircraft manufacturer, there is quite some difference in terms of predictability of revenues and cash flows. Their cost of capital will differ significantly: low for the shopping mall operator, high for the fighter aircraft manufacturer.
- The results growth rates: the higher the growth of future results, the higher the cost of capital. In such cases, the bulk of the enterprise value is due to cash flows which are distant in time and therefore quite sensitive to market fluctuations.
Modigliani and Miller (1958) and Miller (1977)1 were the first to state that the company's cost of capital is not a function of its capital structure.
If the risk on capital employed is such that it requires a 12% rate of return, and if it is fully equity-financed, then shareholders will expect a minimum 12% return. On the other hand, if it is fully debt-financed, creditors will again require a 12% rate of return since they incur the same risk with the operating assets as the shareholders in the previous example. Lastly, suppose financing is equally divided between debt and equity. If the cost of debt is 6%, then shareholders will require an 18% return on equity to achieve a weighted average of 12%, i.e. the remuneration justified by the 12% risk for capital employed or the cost of capital.
Assume that, in a perfect market, the company changes its capital structure – for example, by buying back some of its equity via the issue of new debt. In this case, an investor with a perfectly diversified portfolio who holds 1% of the company's equity and 1% of its debt and thus 1% of its capital employed will continue to hold 1% of capital employed, though now with a lower amount of equity because of the share buy-back and a higher percentage of net debt. The transaction is thus totally neutral for the investor. It will not affect the cost of capital, even if it is now divided between the cost of debt and the cost of equity, because the risk on capital employed remains unchanged.
As we have already discussed, the cost of capital is equal to the weighted average costs of net debt and of net equity. This will be examined in greater detail in the next section.
It is fundamental to understand this. We shall see that it is only for practical purposes that the cost of capital is reconstituted from the respective costs of net debt and equity.
Section 29.2 COMPUTING THE COST OF CAPITAL
The cost of capital can be calculated in three ways: directly, indirectly or via enterprise value.
1/ DIRECT CALCULATION VIA THE β OF ASSETS
Since a company's liabilities merely provide a “screen” between the asset side of the company and the financial market, the rate of return required to satisfy investors is equal to the risk-free rate plus a risk premium related to the company's activity.
Applying the CAPM gives us:
where k is the weighted average cost of capital, rF the risk-free rate, rM the market rate of return and βA the beta of assets or unlevered beta; that is, the β of a debt-free company.
Just as the beta of a share measures the deviation between its returns and those of the equity market, so too does the beta of an asset measure the deviation between its future cash flows and those of the market. Yet these two betas are not independent. A firm that invests in projects with a high βA – in other words, projects that are risky – will have a high βE on its shares because its profitability will fluctuate widely.
On average, asset betas are below 1 as it is equity betas that are on average, by construction, equal to 1. Excluding the burden of net debt (which is on average positive for firms), asset betas are lower than equity betas.
| Asset beta | Asset beta | ||
|---|---|---|---|
| Food retail | 0.21 | Mining | 0.87 |
| Food | 0.43 | Chemicals | 0.93 |
| Water utilities | 0.45 | Gaming | 0.93 |
| Telecom | 0.48 | Automotive | 0.94 |
| Cinema | 0.61 | Restaurants | 0.95 |
| Spirits | 0.65 | Advertising | 0.95 |
| Pharmaceuticals | 0.73 | Airlines | 0.97 |
| Real estate | 0.77 | Construction materials | 0.98 |
| Shipping | 0.77 | Defense | 0.99 |
| Steel | 0.81 | E-commerce | 1.04 |
| Banks | 0.81 | Automotive equipment | 1.17 |
| All sectors2 | 0.83 | Semiconductors | 1.30 |
| Oil & gas | 0.83 | Construction | 1.49 |
Source: Data from BNP Paribas, Corporate Finance, team BVT, 2021
The βA can easily be computed, knowing that it is equal to the weighted average of the β of equity and the β of debt, with the weighting being a function of the relative importance of shareholders' equity and net debt by value (V) in the company's financial structure:

βA can also be expressed as follows:
βDebt corresponds to the beta of the net debt and it should be computed exactly the same way as the beta of equity, which is by regressing the returns on listed debt against market returns. However, it is reasonable to assume that βDebt is equal to zero for weakly leveraged companies. Thus, the previous equation can be simplified as follows:

We believe that it is not reasonable to simplify the analysis by assuming that βDebt = 0 if the leverage of a company is not negligible. In fact, the higher the leverage, the less the financial debt depends on the level of interest rates and the more will be linked to the specific characteristics of the company (fixed costs/variable costs) and its industry (cyclicality). In these cases, debt then begins to behave more like equity in terms of beta characteristics.
Often, our readers will read that financial analysts prefer using the following formula:

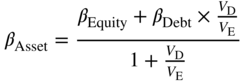
This formula differs from the one above, not only as βDebt is assumed to be nil but also because corporate income tax rate (TC) is introduced. The link between βAsset and βEquity is still subject to debate and depends on the assumptions made regarding the change in capital structure.
This way of computing βAsset is based on the work of F. Modigliani and M. Miller in 1963 (see Section 33.1), according to which the value of the firm is equal to its unlevered value plus the value of the tax shield of debt, computed as the product of the net debt multiplied by the corporate tax rate.
However, this assumes that the firm's indebtedness is constant in perpetuity (which is rarely the case), that the tax rate is constant over time (which has been systematically untrue for decades), that financial interests are fully tax deductible (which is not the case when they become high) and that the cost of bankruptcy is negligible. Actually, for firms with some debts, cost of bankruptcy is of the same order of magnitude as the value of the tax saving due to the debt (Section 33.1).That is a lot for us to embrace!
2/ INDIRECT CALCULATION
Since we are looking for the return globally required by all the company's providers of funds, it is possible to reconstruct the cost of capital based on the valuation of the various financial securities issued by the company.
Linked to the value of all its securities, the cost of capital represents the cost that the company would have to pay today to raise capital so as to replenish all its financial resources, regardless of the accounting costs of the resources its currently uses. It thus represents the introduction of the logic of the financial market within the company.
Consequently, it is possible to reconstitute the cost of capital of a company by seeking which rate of return is required for each type of financial security and by weighting each rate by its relative share in value in the financing of the company. The result is the weighted average cost of capital formula:
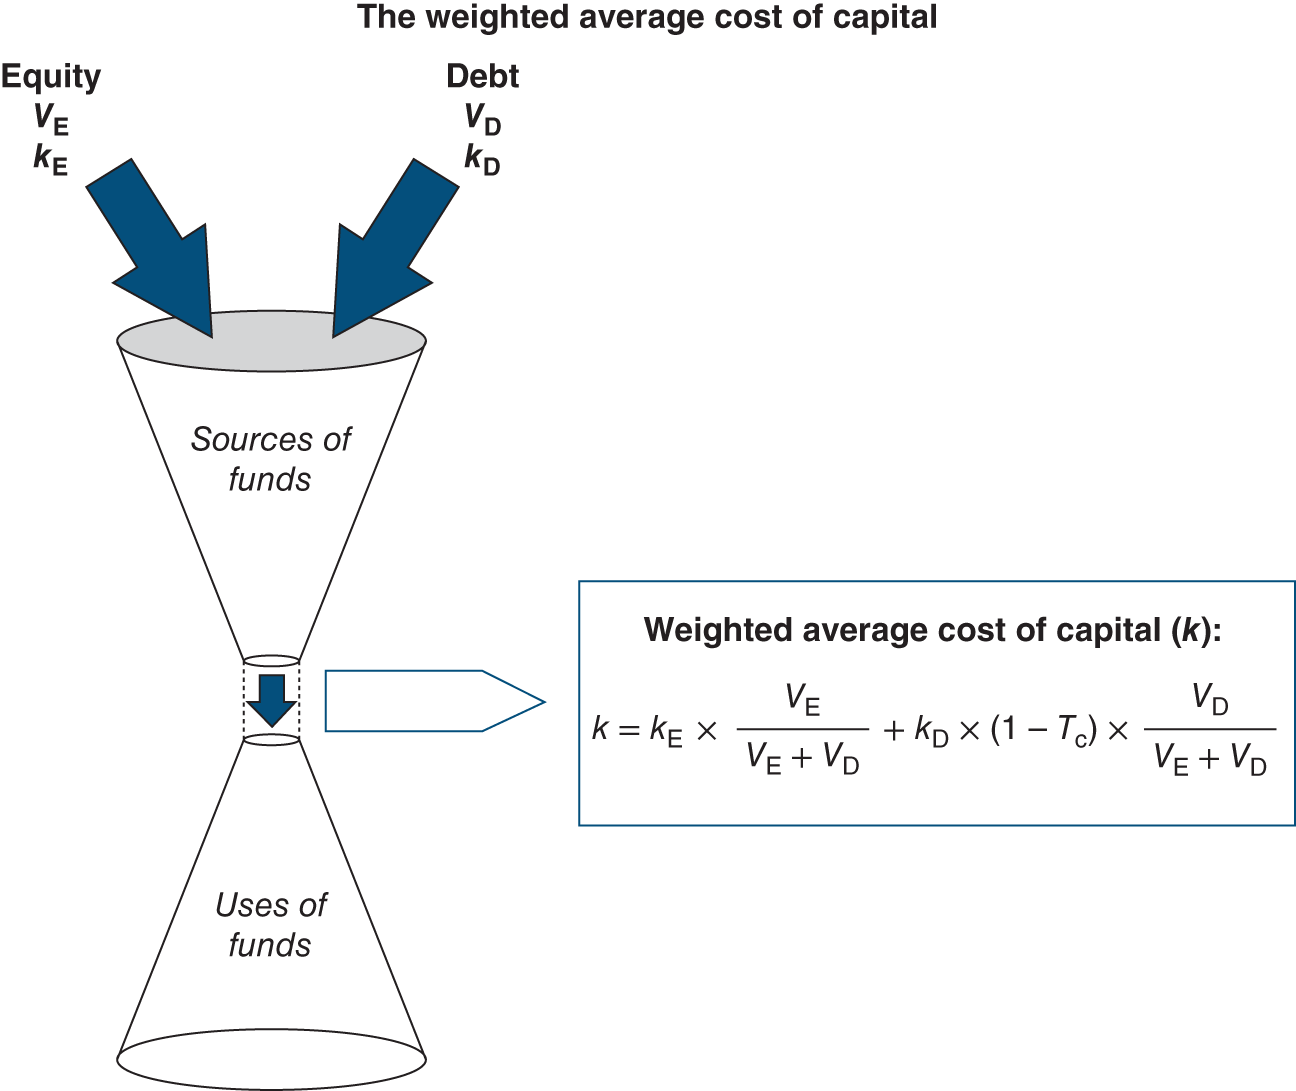
Thus, a company with equity financing of 100 at a rate of 8%, and debt financing of 50 at a pre-tax cost of 3%, has a cost of capital of 6.1% (with a 25% tax rate, Tc).
This is the most frequently used method to calculate the cost of capital. Nevertheless, beware of relying too much on spreadsheets to calculate the cost of capital, instead of getting your hands dirty by working on some examples yourself.
When performing simulations, it is all too tempting to change the company's capital structure while forgetting that the cost of equity and the cost of debt are not constant: they are a function of the company's structure. It is all too easy to fictitiously reduce the cost of capital on paper by increasing the relative share of net debt, because debt is always cheaper than equity!
In the preceding example, if the share of debt is increased to 80% without changing either the cost of debt or equity, then the cost of capital works out to be 3.4%. While the arithmetic may be correct, this is totally wrong financially.
Do not forget that higher debt translates into:
- a higher cost of equity, as βEquity increases with the debt level, as shown in the graph for food companies,
- a higher cost of debt, as the cost of debt increase with the debt level (Section 20.2).
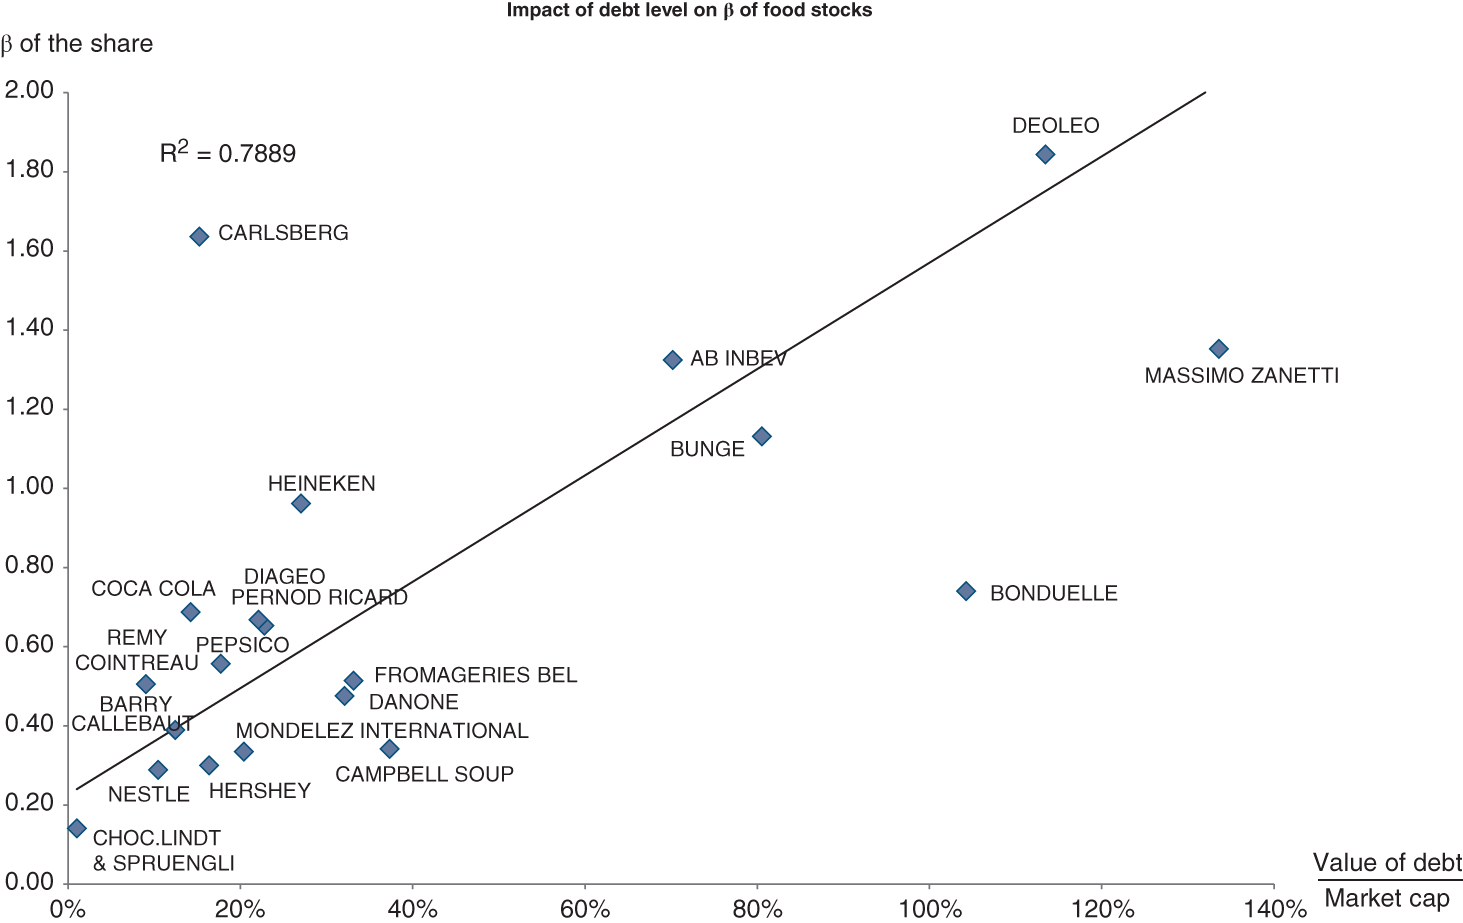
Source: Data from Barra, Factset, annual reports
3/ THE IMPLICIT CALCULATION BASED ON ENTERPRISE VALUE
The cost of capital can be estimated based on enterprise value and a projection of anticipated future free cash flows, since:
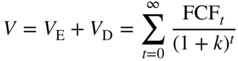
It is then necessary to solve the equation with k as the unknown factor. However, this calculation is rarely used because it is difficult to determine the market consensus for free cash flows over a long period of time.
4/ THE PITFALLS OF THE INDIRECT COST-OF-CAPITAL CALCULATION
(a) Expected rate of return or effective rate of return?
The cost of capital is a financial concept reflecting the expected rate of return required or expected by investors at a given point in time. It is not an accounting concept and should not be confused with the ex-post return on capital employed, which is the effective rate of return.
We won't teach our readers that there is often a big difference between what we wish for and what we get.3
The cost of capital is neither an inverted P/E, nor the return on equity (ROE), nor the rate of return. Instead, it is the rate of return currently required by shareholders as measured by the CAPM:
The cost of debt is not the cost of debt contracted 10 years, one year or three months ago. Nor is it the company's average cost of debt or the ratio of financial expenses to average debt for the year, as studied in Chapter 12, which covered the nominal cost of debt.
(b) Accounting or market values of equity and debt?
Shareholders base their required rate of return on the market value of equity; that is, the amount at which equity can be bought or sold, rather than using book values. The same reasoning applies to debtholders.
This is consistent with the idea of selecting the required rate of return rather than the book rate of return. Using the book value of equity and liabilities can be very misleading, because it may significantly differ from the market value of equity and debt.
For example, the Nestlé shareholder does not require a 27%4 return on book equity of CHF 46bn, but a 5% return on market capitalisation of CHF 310bn! Similarly, an investor buying Legrand USD-denominated bonds with a nominal yield of 8.5% at a price of 127% of the nominal amount does not require an 8.5% return. Instead, they are looking for 1.08%.5
Section 29.3 SOME PRACTICAL APPLICATIONS
1/ FOR THE INVESTMENT DECISION
When making an investment decision, and even if using the indirect method, it is not particularly difficult to calculate the cost of capital. If the company is publicly listed, the calculation is based on readily available market data. Average prices are often used to smooth out any erratic market swings. If the company is not listed, the calculation is based on the cost of capital of companies of comparable size and risk operating in the same sector of activity and geographic region. If the peer sample has been well chosen, the resulting cost of capital will be the same as that of the unlisted company.
The trick is elsewhere; one should not mix up the cost of capital of the firm and the cost of capital of the project. The two are the same only if the risk level of the project is the same as that of the firm.
If the company is engaging in a greenfield project (e.g. a new oil field for an oil company), it should add to its cost of capital a premium6 of c. 2%.
The level or risk of a project can also evolve in time. Usually, the average WACC over the duration of the project will be retained. But it may be more accurate to use a different WACC for each period depending on the maturity and therefore the risk of the investment.
If the company invests in a new sector or a new geography, it will not be able to use its current cost of capital to assess the project. The risk of the project will have to be taken into account to determine the cost of capital to be used. The cost of capital will therefore reflect the industry and geographic risk of the project.
The cost of the funds that will be used to finance the project should never be treated as the cost of capital.
If the financing is by debt, the rate of return to be demanded is certainly higher than the cost of the debt, since the equity, which is used to guarantee the lenders, and without which lenders would not lend, must be remunerated.
Alternatively, if the project is financed by new equity, the cost of capital to be used is likely to be lower than the cost of equity as the higher overall equity will reduce the risk borne by debt holders, and hence their remuneration.
Retaining the cost of the financing source directly instead of the cost of capital will lead to erroneous investment choices, as illustrated by the following example.
Let's take a first investment with an IRR of 8% to be financed with equity that yields a cost of 10%. As the return of the investment does not cover its cost of financing, it is rejected.
A second investment with a similar risk has an IRR of 6%, this time to be financed with debt costing 4%. This investment will then be undertaken as its return is above the cost of financing.
As a result, this reasoning has led the company to undertake the investment yielding the lower return (6% vs. 8%) for the same level of risk. This clearly shows that the reasoning is flawed!
2/ CONCERNING ENERGY AND SOCIAL TRANSITION INVESTMENTS
Contrary to what we have just written in the previous paragraph, we believe that when a company is capable of raising funds via green, social or sustainable bonds or bank facilities whose cost depends on certain environmental or social criteria (see Section 20.4 and Section 21.2), the cost savings that investors may grant should be fully reflected in the cost of capital of the project. Helping the planet is well worth a departure from dogma!
This being said, even when savings do occur, they are relatively marginal in nature.
3/ FOR VALUATION
The indirect method is less adapted to valuations, because to determine the value of equity one needs the cost of capital (see Chapter 31), and to calculate the cost of capital one needs the value of equity! However, there are three ways to solve this dilemma:
- use the parameters associated with a target capital structure, that the firm should reach in a few years. While being careful to use the costs of equity and net debt that correspond to the target capital structure, and not the present costs. This is unfortunately a frequently committed error;
- state the equation of the value of equity (knowing that you need the value of equity to derive the discount rate) and find, by successive approximation, the discount rate that fits. Excel does iterative calculations that will solve this issue;
- use the direct method: the advantage of this alternative is that one avoids the frequent mistake of using costs of equity and debt that do not correspond to the capital structure in question.
4/ DIVERSIFIED COMPANIES
Thus Berkshire Hathaway's cost of capital in itself makes little sense, it is only an a posteriori average of the cost of capital of an insurance group (Geico), a railway company (BNSF), a food company (Kraft Heinz), a portfolio of minority stakes in listed groups (Apple, Bank of America, etc.), etc.
As shown in Chapter 26, diversification does not reduce the cost of capital because it only considers systematic risk. As unsystematic risk can be eliminated by diversification; it does not affect the required rate of return and therefore has no impact on cost of capital.
5/ MULTINATIONAL COMPANIES
A similar logic applies to companies operating in different countries.
A British company investing in Russia, for example, should not use a discount rate based on British data just because its suppliers of funds are British.
After all, the project's flows are affected by the Russian systematic risks (inflation, taxation, exchange rates, etc.) rather than the British systematic risk. It is therefore necessary to take a Russian risk-free rate, to select the βAsset to which a Russian risk premium is applied, to take into account the cost of Russian debt and in no case the UK parameters. This approach avoids the frequent error of discounting flows denominated in a given currency using a discount rate expressed in another currency.
A British, German or Chinese company wanting to invest in the exact same asset in Russia will bear the same cost of capital as it only depends on the risks of the project and not on the risks of the company investing.
After the Western-based company has invested in Russia, its cost of capital will probably be higher as it will be made up of two costs, a lower one for Western Europe and a higher one for Russia, reflecting the different levels of systemic risk (political and macroeconomic) in the two regions.
6/ EMERGING MARKETS
In developing countries, calculating the cost of capital of an investment raises some practical problems. The risk-free rate of local government bonds is often just wishful thinking, since these countries have little solvency. The local risk-free rate and betas of local peer groups are rarely measured, let alone significant, given the limited size of financial markets in these countries.
We suggest Bancel and Perrotin's (1999) system for calculating the cost of capital in such cases:
The sovereign spread represents the difference between bond yields issued on international markets (in euros or dollars) by the country in question versus those offered by euro- or dollar-zone bonds. This yield represents the political risk in the emerging country. When the developing nation has not made any international issues, it is possible to use a bond issue by another state with the same credit rating as a benchmark.
When the sovereign spread reflects the fact that the state cannot be considered a risk-free borrower (like Venezuela), we advise using the spread of the best-rated borrower.
βA is the beta coefficient of the sector of activity calculated in developed financial markets. This parameter measures the sensitivity of an industry's flows to the overall economic environment. It is shaped by the sector of activity, not the country.
Obviously, this rate must be applied to flows that have been converted from their local currencies into euros. If the flows are denominated in dollars, then remember to apply a USD rather than a euro benchmark.
For example, it is possible to calculate the cost of capital of a South African investment project based on the following assumptions: βA = 0.82, rF in the US = 3.0%, a South African government bond rate of 5.3% (bonds denominated in USD), a US risk premium of 6%.
If the project's flows are denominated in South African rands, then the cost of capital is converted from dollars into rands as follows:
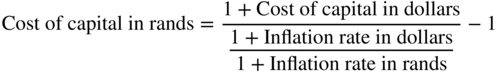
This assumes that the rand devaluates against the dollar regularly, in line with the inflation rate differential (purchase power parity).
7/ COMPANIES WITH NEGATIVE NET FINANCIAL DEBT
Consider a group that, for structural reasons, has a negative net debt of 2 with no banking or financial debt, and equity of 9.
Assume that the shareholders buying these shares understand that they are buying both operating assets with a given risk level and have a cash situation with virtually no risk. In other words, the risk on the share is lower than the risk on the company given the structurally positive net cash balance.
The cost of capital of this company can be estimated using the indirect method, applying a negative value for VD. So, in this example, if the cost of equity is 7% and net cash generates 2% after taxes, then the company's cost of capital is 8.4%:
To offer the 7% return required by shareholders, the company must invest in projects yielding at least 8.4%. The 7% cost of equity is the weighted average of the required 8.4% return on capital employed and the 2% on net cash.
Practitioners often use a cost of capital equal to the cost of equity when the firm holds net cash. This is a mistake, unless you consider that shareholders do not take into account the security brought by the net cash.
8/ COMPANIES IN FINANCIAL DISTRESS
It is generally assumed that companies under financial distress have a very high cost of capital. This is not correct! Bankruptcy risk is a specific risk and not a systematic risk, and it should therefore not be taken into account by the cost of capital. If things were not so, the firm in financial distress could never undertake an investment as it would require a higher return than other firms in the sector. It could then never recover.
On the other hand, its cost of equity can be very high (βEquity between 3 and 10 can be observed), as the value of equity has become negligible compared to the value of debt. But as equity weighs very little in the capital structure, the influence of cost of equity on cost of capital is minimal.
Section 29.4 CAN CORPORATE MANAGERS INFLUENCE THE COST OF CAPITAL?
Chapters 32 and 33 demonstrate why there is little point in using debt and its tax advantages to lower the cost of capital. While net debt costs less than equity, it tends to increase the risk to shareholders, who retaliate by raising the required rate of return and consequently the cost of equity. Debt works to the advantage of the company, because the interest on the net debt can be deducted from its tax base (which it cannot do for dividends). The opposite tends to apply to investors.
In short, in a perfect world in which investors had diversified portfolios, one man's gain would be another man's loss.
Moreover, if debt really did reduce the cost of capital, one would have to wonder why highly efficient companies – such as L'Oréal, Heineken, Toyota, Google and SAP – are not levered, given that they have no reason to fear bankruptcy.
Since the cost of capital depends on the risk to the company, the only way it can be lowered is through risk-reducing measures, such as:
- Lowering the breakeven point by shifting from fixed to variable costs, i.e. subcontracting, outsourcing, etc. Unfortunately, the margins will probably decline accordingly.
- Improving the business's visibility and smoothing its cyclical nature, i.e. winning medium-term supply contracts with important clients. Here too, however, margins may be affected since, in exchange, the clients will demand price concessions.
- Diversifying the business does not help as it does not reduce market risk, but rather specific risk, which is the only one to be remunerated.
- Shifting from a risky activity (e.g. a biotech start-up) in a high-risk country like Pakistan to a safer business in a more stable country (cheese production in Switzerland) will no doubt cut the cost of capital, but it will also lower profitability. In addition, it would have no impact on value, since it is simply a move on the security market line.
Similarly, increasing the risk for capital employed increases the cost of capital, but value will not be destroyed if profitability improves at the same time.
The cost of capital of Bouygues increased as it launched media and telecom activities (riskier than its traditional construction operations) and then decreased as these operations matured.
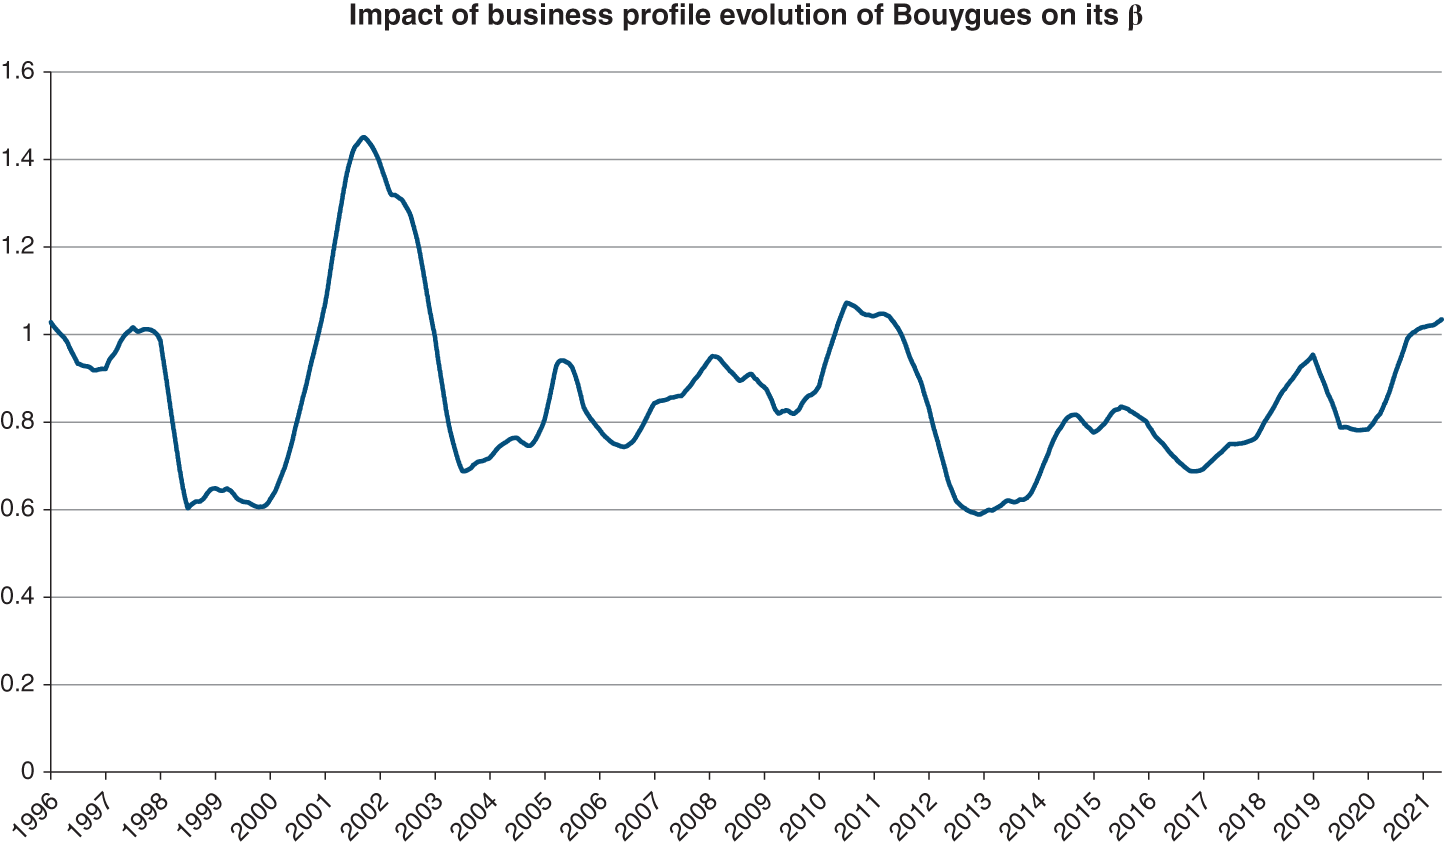
Source: Data from Factset, moving average over 6 months
SUMMARY
QUESTIONS
EXERCISES
ANSWERS
BIBLIOGRAPHY
NOTES
- 1 See Chapters 32 and 33.
- 2 This figure is lower than 1 since it is not the β of all shares on the market that average 1, but the β excluding the impact of net debt.
- 3 If necessary, we direct our readers to the Rolling Stones' “You can't always get what you want”.
- 4 Book return on 2020 equity.
- 5 Yield to maturity of the bond listed at 127% and maturing 2025.
- 6 Called greenfield premium.
- 7 See Easley and O'Hara (2004).