
Appendix. Preparing a Cloud Budget
Throughout this book, you’ve learned how to design and develop data pipelines in a cost-effective way. You’ve evaluated different options of how to allocate compute and storage, making decisions that are appropriate for your current and near-term data pipeline operational goals. You’ve put design strategies in place to reduce the chance of data corruption and recomputation expenses, and you’ve employed development strategies to minimize cloud service costs. On top of this, you have monitoring in place so that you can see how the pipeline performs with the design choices and resource allocations you’ve made.
Going through this process not only helps you put cost-effective designs in place, it also gives you valuable information about where and why you are spending on cloud resources. Even if your day to day doesn’t involve giving budget presentations, communicating how you are saving costs will help propel your career. Engineers who understand cost trade-offs are valuable partners to those who are primarily interested in company financials. You have the ability to act on requests to save costs as well as inform others on what the trade-offs are for doing so.
In this Appendix, you’ll learn how to take this information and create a basic budget for cloud spend, using historical billing data, estimated costs, and pipeline workload expectations.
This is just the tip of the iceberg for budgeting and forecasting, but it will help you leverage what you’ve learned in this book to communicate some basic numbers about cloud spend expectations. If you’d like to learn more about this topic, check out the FinOps Foundation and its official guide, Cloud FinOps by J. R. Storment and Mike Fuller (O’Reilly). As stated on the FinOps Foundation website, “FinOps is about making money.” By creating visibility of cloud costs and encouraging cross-functional ownership of these expenses, FinOps helps companies invest in systems that contribute to revenue and profit.
This will help your company improve revenue and profit by maximizing the value you get from the cloud.
It’s All About the Details
When it comes to looking at the cost of things, everyone likes to know what they’re paying for. Say you were in the market for an expensive laptop and came across the two ads shown in Figure A-1.

Figure A-1. Laptop ads with varying levels of detail
The cost for each laptop is the same, but there’s a dearth of details in the ad on the left. It could be that it performs as well as or better than the laptop on the right, but you can’t be sure without more information. You know there are more details about what you are getting for that $3,000. You might even wonder what is being hidden due to the lack of details in the ad on the left.
These are not the sorts of feelings you want the audience for your budget to have. Having the details of your cloud budget available will help build trust with stakeholders and enable you to showcase the cost-effective work you’ve been doing. You would feel confident about what you were purchasing if you bought the laptop on the right; you want your budget audience to feel that same confidence when reviewing your numbers.
While it’s important to convey the details of cloud spend, the business tends to be more interested in the impact of a system. Ultimately, how does this system benefit the company? This relates back to “Requirements Gathering for Compute Design”: working with stakeholders to determine how to best meet their needs and making the right trade-offs in system design. While this Appendix focuses on the cloud cost numbers, make sure to include the impact of the system in your budget discussions.
At the highest level, your budget conveys the cost of cloud services you expect to incur over a particular time period. Working backward from this point, the next level to consider is the different areas where costs originate. Storage, data egress, and compute tend to be the dominant categories. Other areas include databases, monitoring, networking, and CSP-managed services, such as AWS Lambda or Athena.
Depending on where you are in the pipeline lifecycle, you can get a sense of these costs from your historical billing data or by coming up with an estimate.
Historical Data
If your pipelines have been up and running for a while, historical cloud costs can help you bootstrap your budget. CSPs offer ways to stratify your bill across different services and filter by tags, labels, and projects to help you zero in on the expenses that relate to your pipelines. Figure A-2 shows a very modest cloud bill where you can see different services broken out.
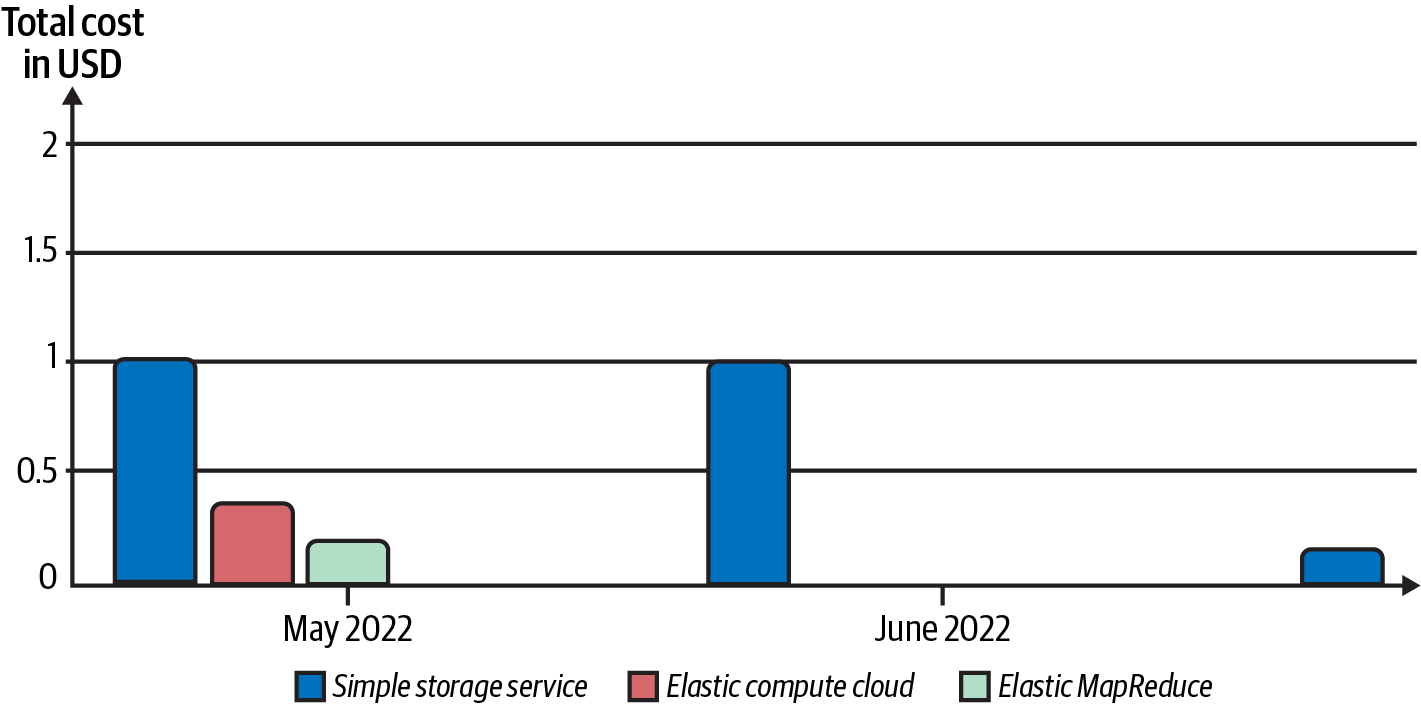
Figure A-2. The world’s smallest cloud bill, stratified by service type
If you haven’t looked at a cloud bill before, it’s definitely an eye-opening experience to see the myriad things you get charged for. Digging into the details can help you get a sense of how costs break down. As you learned in Chapter 3, cloud storage costs include storing the data at rest as well as events to request, create, and delete objects. Figure A-3 shows the breakdown of storage costs for the S3 costs in Figure A-2.
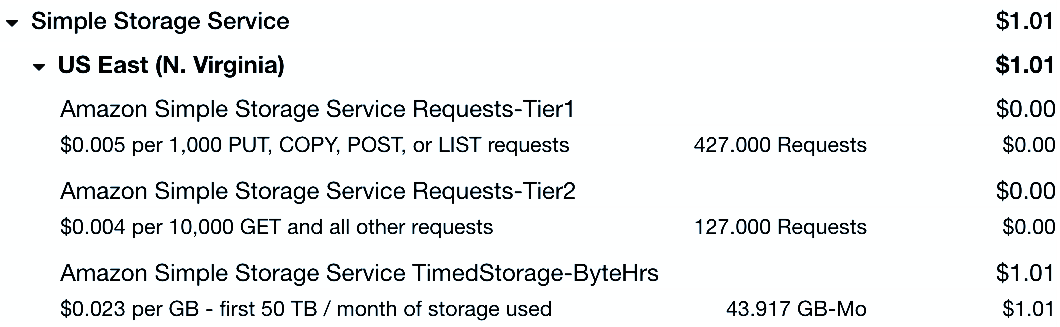
Figure A-3. Simple storage service cost breakdown
In this case, the primary cost driver is data storage, and you can see that there were so few service requests that they didn’t add to the overall cost at all.
Combining these billing details with your knowledge of the pipeline will help you create a mental model of how the cloud costs spread out across the system. Even a rough sense of the ratio of compute to storage costs can be helpful when trying to estimate future expenses.
This mental model will also help you evaluate forecasting data. Major CSPs offer forecasting tools as part of their billing services, using historical usage to predict future cloud bills. These forecasts are not always correct. Your knowledge of the system plus the historical usage data can help you determine whether a forecast is reliable.
As an example of how this mental model can help with budgeting, a project I worked on had a one-time event where we were tuning autoscaling settings. Over a few weeks, we ran large test ingestion jobs to assess different autoscaling rules, increasing our cloud compute costs.
When we looked at the billing forecast, this one-time increase was forecast as a month-over-month increase, making it appear as though our future cloud compute spend was going up. This was an important point to clarify to company leadership when reviewing the cloud budget, as the forecast provided by the CSP was not accurate.
Estimating for New Projects
If you are working on a new project or if it’s difficult to isolate pipeline costs from other projects in a cloud bill, you can come up with a rough cost estimate. CSPs offer cost estimation tools, such as the AWS pricing calculator, the Azure pricing calculator, and the Google Cloud pricing calculator, that can help with estimating.
Using the benchmarking process from Chapter 1 will help you get a sense of compute needs, which you can scale up for the volume of data and compute complexity you expect over the budget period.
Other costs will vary based on architecture. If you’re ingesting primarily to cloud storage, you can estimate storage and data transfer costs based on expected data size. Standing up a small prototype environment can help estimate costs for databases and other services, something IaC practices can help you with. Running this environment for some test ingestion events will populate billing data you can use to seed your estimation.
Whether you use existing cloud bills or come up with an estimate, you’ve now developed a baseline cost estimate for the pipeline. This might be the limit of what you can provide, which is quite valuable information.
You can think of this as a detailed receipt for the time period you’ve looked into. A budget goes beyond this to provide an expectation of what costs will look like in the future. In the next section, you’ll learn what to look for to determine how your costs might change, enabling you to come up with a budget.
Changes That Impact Costs
In the simplest scenario for a budget, your pipeline continues operating exactly as it has in the past; the same data load, the same data processing logic, and the same infrastructure. In this case, the billing history probably gives you a decent estimate of what to expect in the future.
I have yet to work on a pipeline where this is the case, which I suppose is fortunate because otherwise I’d be very bored. Realistically, you’ll be experiencing some kinds of changes over the budget time period that can impact cloud costs. In this section, you’ll learn some typical changes in data pipelines that can make cost forecasting challenging and ways to address the ambiguity they introduce.
Some of these changes you may be able to estimate, while others are entirely unforeseeable. Remember that a budget is about communicating; if you see changes on the horizon but can’t come up with a cost estimate, make note of these changes as possible risks. Even if you can estimate the cost impacts of changes, it is worthwhile to show that you’ve considered upcoming changes as a part of your budget.
Data landscape
A variety of changes that can happen in the data landscape can impact cloud costs. You might bring on additional data sources or see increased volumes in existing ones. Conversely, you may see reduced volumes or drop data sources from processing. Data source formats can change, which can increase or reduce storage and compute costs depending on whether it makes the data processing more or less complex.
Some of these changes can be anticipated. For example, if you are making a big push to bring new customers on board, you would expect costs to increase. Your sales and marketing team may be able to give you an idea of the number and types of prospective customers they are targeting, which could help you estimate the additional storage, compute, and egress costs.
In another example, perhaps development of an ML product is planned to start in the next quarter, requiring additional data storage to retain a history of raw, unprocessed source data. The costs for developing, training, and running an ML engine would be additional costs to consider if the ML product is expected to be part of the pipeline.
Other changes in the data landscape are difficult or impossible to predict. You don’t know whether a third-party API will shut down suddenly, whether the response data will change, or whether changes in API terms will enable you to access more or less data in a single request. In one project I worked on, our cloud compute costs spiked when a third-party API response changed, providing significantly more data than we needed.
Load
Changes in pipeline load can also impact cloud costs. This can be related to changes in the data landscape, such as processing more or less data. Changes in data processing approaches can also impact load. As an example, I worked on a project where our data processing logic increased in complexity to provide new features to our customers, which increased our cloud costs despite the data source characteristics remaining the same. If you know features are planned that can increase or reduce data processing complexity, that will be important to note in your budget.
Other changes in load can come from seasonality. Recall the streaming bird migration pipeline in Chapter 5. Except for seasonal migration events, this pipeline would be quiescent or perhaps entirely off for the rest of the year. When preparing a budget for a given time period, keep in mind how time of year could impact costs.
Tip
You can set up cloud budgets, including alerts if thresholds are exceeded, in Azure, AWS, and Google. This can help you avoid nasty surprises at the end of the billing cycle.
Load can also change due to changes in performance requirements for the pipeline. If the pipeline has to increase throughput, you would expect costs to increase as a result of the additional resources needed.
Unplanned changes in load will impact cloud costs but can’t be foreseen. Data reingestion due to pipeline bugs is another source of unplanned cost changes. Your CSP may have a major outage in the mainline region where you run your pipeline, incurring the cost of replicating data and running a DR system. While you can’t plan for these occurrences, you can make note of them if and when they occur. You’ll be able to speak to these impacts on the cloud budget if they come up in the next budgeting period.
Infrastructure
Infrastructure changes can be challenging to budget for. Examples of this are changes in data processing engine or migration from in-house services to managed, such as from an in-house Postgres deployment to RDS, or from managed services to in-house services, such as from an Airflow deployment in Google Cloud Composer to a self-hosted Airflow deployment. Adding a new service, such as the addition of the Lambda function for night heron data in Chapter 7, is another possibility.
When you’re swapping between managed and in-house services, you might be able to leverage historical billing data if data landscape and performance requirements remain the same. In the Airflow example, if you provision the same capacity that was provided by Google Cloud Composer and run the same DAGs, you can get an estimate of future costs when moving to an in-house deployment. If you’re using these kinds of estimates in your budget, it’s good to note this infrastructure change as a risk.
Creating a Budget
Now that you’ve learned how to come up with some cost numbers and assess budget risks, let’s take a look at how to pull these together into a budget spreadsheet. This will help you organize the details of your cost analysis, cost-saving strategies, and risks in a single place. Keep in mind that a budget is dynamic; needs and demand can change, necessitating revisiting prior budgeting decisions.
Throughout this section, I’ll refer to the example budget in Table A-1. An empty budget spreadsheet is available at the end of the Appendix for you to apply to your projects (see Table A-2).
Budget Summary
The budget summary is a short synopsis of the budget. This gives the budget audience a succinct description of what the budget covers, the total cost, assumptions, and risks.
Taking a look at rows 1 through 6 in Table A-1, you have the following sections:
- Project
- This tells you what the budget covers. In this case, the budget is for the HoD bird identification pipeline introduced in Chapter 6.
- Timeline
- The timeline refers to the time period the budget covers. In this example, the budget covers the fourth quarter of 2023. It’s important to make sure you present the time period in a way that everyone will understand. For example, Q4 2023 could refer to the fourth quarter of the calendar year, which is October through December. This could be different from the fourth quarter of the fiscal year, so make sure the way you present the timeline is clear to all potential recipients.
- Total
- This is the total budget for the time period.
- Assumptions
- Anything you are assuming could impact the budget should be spelled out here. In the example, an assumption is that the current data load from existing customers will be the same over the budget period. There are always going to be assumptions when you are forecasting costs. List major ones here to raise awareness of what you are basing your budget on.
- Risks
As you learned in “Changes That Impact Costs”, there are several things that can impact the budget that you might not be able to plan for. In this section, you can communicate what future changes could impact costs.
Don’t try to enumerate every possible scenario, such as detailing that every API you interact with could change. Rather, think about what is on the horizon that you can’t estimate costs for. In the example, the uncertainty of what new customer data will look like is cited. In this case, you know there is a push to bring new customers on board, but you don’t know how that will impact cloud bills because future customer data is unknown.
- Cost-saving measures
- This is where you can show off the cost-efficient measures you’ve taken. If you can put numbers to this section, all the better; for example, “Saved 40% on compute with reservations and improving data processing efficiency.”
| 1 | Project | HoD bird classification pipeline | |
| 2 | Timeline | Q4 2023 | |
| 3 | Total | $100,000 | |
| 4 | Assumptions | Load on pipeline for current customers remains stable; expect additional costs to support new customers | |
| 5 | Risks | Uncertain impact to compute, database costs for new customers; estimating based on past growth | |
| 6 | Cost-saving measures | Spot instances, minimizing data footprint, limited cloud service use in development | |
| 7 | Baseline | ||
| 8 | Number of customers | 8 | |
| 9 | Total data processed | 160 TB | |
| 10 | Total data stored | 50 TB | |
| 11 | Expected growth | ||
| 12 | Number of customers | 2–6 | |
| 13 | Data processing | 20–50 TB per customer | |
| 14 | Data stored | 1–10 TB per customer | |
| 15 | Cost breakdown | ||
| 16 | Production | ||
| 17 | Q3 2023 | Estimated Q4 2023 | |
| 18 | Compute | $54,000 | $77,000 |
| 19 | Storage | $4,000 | $7,300 |
| 20 | Egress | $600 | $900 |
| 21 | Databases | $4,000 | $7,300 |
| 22 | Other | $1,000 | $1,300 |
| 23 | Total | $63,600 | $93,800 |
| 24 | Disaster recovery | N/A | |
| 25 | Test and development | ||
| 26 | Compute | $3,000 | $3,000 |
| 27 | Storage | $375 | $375 |
| 28 | Egress | 0 | 0 |
| 29 | Databases | $780 | $780 |
| 30 | Other | $200 | $200 |
| 31 | Total | $4,355 | $4,355 |
Changes Between Previous and Next Budget Periods
Rows 7 through 14 in Table A-1 communicate important metrics about the system you are budgeting for. This will vary from project to project and can include metrics for system capacity, performance, number of customers supported, or SLAs.
Rows 7 through 10 show the baseline metrics covering the last budget period. Rows 8 through 14 show the expected change over the next budget period. Notice that the expected growth is presented as a range, which helps to further communicate the uncertainty around these impacts.
The metrics in Table A-1 are presented at a system level, but it can also be desirable to break down these metrics in different ways. For example, presenting a per-customer cost distribution can be helpful to inform how to charge for the service.
Cost Breakdown
Rows 15 to the end of Table A-1 are for breaking down the total cost into individual cloud cost categories across different environments. Showing the comparison with the previous budget period gives a sense of how costs are evolving and can also be an opportunity to discuss how costs differed from the prior budget expectations.
The sections you include will depend on where you incur costs. In this example, at a high level are the production, testing, and development environments. Production is, as expected, the largest contributor to the budget and gets its own distinct section. The testing and development environments are combined, as they contribute a fraction of the costs. Make sure to include a budget for all the test and development environments you run, recalling the DEV, TEST, STAGING, and PROD environment example in Chapter 5. In that case, you have PROD and three lower environments to budget for.
There is no DR for this pipeline, so that section is absent. If you have DR, how you represent it in a budget will depend on whether you have a hot, warm, or cold failover system. A hot system, where a production replica is running all the time, will give you a consistent baseline cost to use for a budget. Warm and cold systems are a bit less straightforward, since these only come online at capacity in response to an incident.
In the case of warm and cold DR, you can represent the cost in a budget on a per-incident basis, including an assumption of how long you expect the DR system to be in operation before switching back to the mainline. For example, if it costs $1,000 to bring a cold DR system online and run it for one day, you can represent this as $1,000 per incident in a budget. When estimating DR costs, don’t forget the cost of data replication and egress where appropriate.
Within the environments, the breakdown of cost categories, as shown in rows 18 through 22 in Table A-1, depends on your architecture. In the example, the major sections include compute, egress, storage, and databases. An “Other” category rolls up remaining costs that are too small to deserve their own line item. In this case, “Other” would include the Lambda function developed to alert on night heron content.
Communicating the Budget
You’ve researched the numbers and organized them into a concise spreadsheet. Now it’s time for the part of budgeting that technical contributors enjoy more than anything else: talking to other people.
Regardless of whether you relish the idea of presenting this information, the decisions you have made while designing cost-effectively are extremely valuable in budget conversations. A lot of folks can look at billing data and create a forecast, but only those who have designed and developed the underlying system can speak to how these costs translate to a (hopefully) profitable product and can consult on possible trade-offs.
For example, let’s say your simulations in Chapter 1 show that you need a 30% memory overhead to meet reliability performance goals for data ingestion. Your monitoring from Chapter 9 shows the amount of data processed over a given time period and the resource utilization of your compute resources, confirming that this overhead is helping you meet performance goals.
When Finance questions your cloud compute costs, noting that you have up to 30% idle compute capacity, you can present this trade-off: “We leave a 30% overhead to meet performance goals. Reducing this will impact performance and stability.” It could be that this is acceptable, or it could be that the business is willing to accept a slower data ingestion to cut costs. Because you’ve evaluated these trade-offs, you can provide this input to budget discussions, enabling the business to make informed decisions.
When it comes to communicating the budget numbers from the example in Table A-1, you’ll want to tailor the level of detail you provide based on the audience. The more removed someone is from the day-to-day engineering process, the less detail they tend to need—unless you’re talking to a FinOps person, in which case they may be removed from engineering but very interested in the details.
Regardless of who I present a budget to, I like to have all the details available, if not broadcast as part of my presentation. That way, if more detailed questions arise, I can speak to them. You don’t want to leave the audience thinking you’re just hand waving, so having specifics on hand can bolster your credibility.
Summary
With just a little more investment in understanding cloud bills and cost estimation, you can increase the impact of your cost-effective designs by contributing to a cloud cost budget. Bringing your expertise into budget conversations can increase trust that engineering is using resources wisely, improve the effectiveness of putting FinOps practices in place, and help companies consider cloud costs alongside pipeline performance and scalability.
Combining your design knowledge with historical cloud billing data and estimating tools will help you come up with estimates across different cloud service areas. You can further refine these estimates by looking ahead for changes in the data landscape, load, and infrastructure over the budget period to identify budget risks.
Consolidating your estimates, assumptions, risks, and cost-saving strategies into a budget spreadsheet gives you a single source to refer to in budget conversations. Whether your audience is only interested in the overall cost or wants to know how your compute costs are allocated, this spreadsheet will help you communicate the desired details. This detail and transparency helps create trust and improves visibility into the hard work you’ve been doing to develop data pipelines cost-effectively.
| Project | ||
| Timeline | ||
| Total | ||
| Assumptions | ||
| Budget risks | ||
| Cost-saving measures | ||
| Baseline | ||
| Number of customers | ||
| Total data storage | ||
| Expected growth | ||
| Number of customers | ||
| Data storage | ||
| Cost breakdown | ||
| Production | Previous costs | Budget period costs |
| Compute | ||
| Storage | ||
| Egress | ||
| Networking | ||
| Databases | ||
| Other | ||
| Total | ||
| Disaster recovery | ||
| Compute | ||
| Storage | ||
| Egress | ||
| Networking | ||
| Databases | ||
| Other | ||
| Total | ||
| Test and development | ||
| Compute | ||
| Storage | ||
| Egress | ||
| Networking | ||
| Databases | ||
| Other | ||
| Total | ||