9
Big Data Analytics in Real Time for Enterprise Applications to Produce Useful Intelligence
Prashant Vats1 and Siddhartha Sankar Biswas2*
1Department of Computer Science & Engineering, Faculty of Engineering & Technology, SGT University, Gurugram, Haryana, India
2Department of Computer Science & Engineering, Jamia Hamdard, New Delhi, India
Abstract
Big data is a technique for storing and analyzing massive amounts of data. The use of this technical edge allows businesses and scientists to focus on revolutionary change. The extraordinary efficacy of this technology outperforms database management systems based on relational databases (RDBMS) and provides a number of computational approaches to help with storage bottlenecks, noise detection, and heterogeneous datasets, among other things. It also covers a range of analytic and computational approaches for extracting meaningful insights from massive amounts of data generated from a variety of sources. The ERP or SAP in data processing is a framework for coordinating essential operations and with the customer relationship and supply chain management. The business arrangements are transferred to optimize the whole inventory network. Despite the fact that an organization may have a variety of business processes, this article focuses on two continuous business use cases. The first is a data-processing model produced by a machine, the general design of this method, as well as the results of a variety of analytics scenarios. A commercial agreement based on diverse human-generated data is the second model. This model’s data analytics describe the type of information needed for decision making in that industry. It also offers a variety of new viewpoints on big data analytics and computer techniques. The final section discusses the difficulties of dealing with enormous amounts of data.
Keywords: Big data, IoT, business intellectual, data integrity, industrial production
9.1 Introduction
In recent decades, IoT technology and data science have become the most discussed technologies on the planet. These two developments work together to collect data regularly. IoT will vastly increase the amount of information available for investigation by all sorts of organizations. Regardless, there are still significant issues to overcome even before anticipated advantages may be fully realized. The Internet of Things (IoT) and big data are certainly developing rapidly, and they are causing changes in a variety of industries and also in everyday situations. Due to the obvious connection of sensors, the Internet of Things generates a massive input of massive data. The Internet of Things will determine the course of business intelligence tools. Organizations can deliver memorable sector reforms by drawing actionable intelligence from massive amounts of data. The fundamental concept is to deploy IoT onto Business Applications in industrial automation. To identify the needs of something like the decisional analytical support system in the cloud environments, the manufacturing process requirement must be considered. The enterprise concept and present IT setup are investigated to identify methodological gaps in using the concept of the Internet of Things as a framework for smart manufacturing. IoT opens the way for industrial businesses to grow by enhancing existing systems in a globalized and fragmented environment. In any event, IoT operations are still in their early stages in many businesses, and more study is needed before moving forward with deployment.
The potential of big data is speculated by inside and then remotely gathered information using linked gadgets. The Internet of Things refers to Internet connections to the physical universe and ordinary things. This advancement brings up a plethora of new possibilities. Because embedding infrastructures and informational technologies are directly integrated into the transition, smart physical devices play an important role in the concept of IoT technology. IoT may be defined as the connecting of physical worlds, detectors within and connected with objects, and the internet via remotely through hardwired system connections. The phrase “data science” refers to the massive amounts of data administration and the provision of information via an inquiry that exceeds the capability of traditional database management systems (RDBMS). Data science is not only changing data storage and administration techniques but also provides competent continual analytics and graphic representations, which imply the qualitative information necessary for the enterprise. Big data is becoming increasingly essential for many companies. The activities necessitate a broader range of applications that can handle an increasing number of data that is constantly generated from different data sources. Data science manages data that cannot be used or handled in a typical manner. A conventional DBMS has less storage, it is harder to address problems in the data set, and processing is quite simple. However, in the case of huge data, special emphasis is required for data cleansing and the calculating method. Continuous data pouring necessitates decisions regarding which parts of the streaming data should be captured for analytical purposes.
Data science analytics should be lauded for freeing a competitive advantage over its competitor’s market for the benefit of the company. In the conventional framework, interpretations from various findings, such as sales reports and inventory status may be captured using readily available business predictive analytical tools. The combination of conventional and big data decides the actionable, intelligent analytical findings required by the organization. Consequently, scheduling and forecasting apps derive information from big data. To generate understanding from this vast amount of big data, businesses must use data analytics. The word analytics is most commonly used to refer to data-driven decision making. The assessment is used for both business and academic research. Although those are separate types of research, the identical data contained in commercial examination necessitates knowledge in data mining, commercial factual methods, and visualization to satisfy the inquiries of corporate visionaries. Analytics plays an important role in gaining valuable understandings of business operations and finance. It should look into the requests made by consumers, items, sales, and so forth. The combination of corporate interests’ information and big data aided in predicting the behavior of customers in the selection of the materials. In any event, whenever an instance of a scholarly article occurs, these must always be examined to investigate the hypothesis and create new ideas. Industrial revolution 4.0 is a contemporary transformation that is paving the way for IoT-based smart industrial production. Integrating IoT and data science is indeed a multidisciplinary activity that needs a special set of skills to provide the most extreme benefits from frameworks. Intellectual networking may be built up in the production process framework to link, manage, and correlate to one another automatically with significantly decreased interference by administrators. It also has the tangible potential to affect important company necessities and is now in the process of renovating industrial segments. Data wrangling analytics is a way of bursting large volumes of data that contain many types of information, i.e., big data, to expose all underlying patterns, undiscovered linkages, industry trends, customer decisions, as well as other useful enterprise data.
The results of said analytics can lead to much more clever advertising, new enterprise possibilities, and better customer service, as well as increased performance improvement, gain competitive advantage, and other economic advantages. The primary goal of predictive analytics is to assist organizations in making quite beneficial management decisions by enabling data researchers, analytics professionals, and other business intelligence experts to analyze large amounts of data from various operations, as well as other kinds of data that may go unnoticed by other more typical Business Intellectual capacity (BI) programs. Website logs, social networking sites, online trade, online communities, web click information, mails from consumers, survey results, mobile telephone call records, and machine data created by gadgets connected with IoT-based networks may all be included. This chapter describes the application of IoT, data science, and other analytical tools and methods for exploiting the massive volume of structured and unstructured data generated in the commercial setting. Data wrangling-based business intelligence plays an important role in achieving extraordinary results by offering cognitive insights from accessible data to utilize operations and business expertise. It provides accurate historical trends, as well as online monitors for effective decision making throughout the enterprise’s organizational levels. In this article, two corporate use cases are used as examples and addressed. In both situations, the massive quantities of information are accelerated. The first is concerned with the knowledge freed from different equipment in the IoT ecosystem. It generates a high quantity of data in a short period. Another example is human-created knowledge using an industrial business system. Section 9.2 discusses the connection between big data and IoT. Section 9.3 discusses big data infrastructure, framework, and technologies. Section 9.4 covers the rationale for and significance of big data. Section 9.5 discusses industrial use cases, operational challenges, methodology, and the importance of data analysis. Section 9.6 discusses several limitations. Section 9.7 brought this chapter to a conclusion.
9.2 The Internet of Things and Big Data Correlation
The Internet of Things is poised to usher with the next industrialization. According to Gartner, revenue produced by IoT devices and related applications would exceed $3 trillion by 2021. The digitalization using IoT will generate a massive percentage of money and information, and its impact will indeed be felt throughout the world of big data, intriguing enterprises to upgrade existing methods and technology, as well as develop the appropriate advanced technologies to facilitate this increased data volume as well as capitalize on the knowledge and insight from newly conquered data. The massive volume of data generated by IoT would indeed be meaningless without the analytic capability of big data. The Internet of Things and big data are inextricably connected by engineering and commerce. No law says IoT and data science must be linked at the groin; nonetheless, it logically follows them as compatible companions since it is useless to run complicated equipment or devices lacking predictive modeling. This necessitates the use of large amounts of data related to predictive data science for analytics. The “enormous growth of datasets” caused by IoT necessitates the use of big data. Without the finest data collection, companies cannot evaluate the data freed by sensors. Machine and device data are frequently in a basic and simplistic manner; to be used for quantitative choices, the data must be further organized, processed, and supplemented.
9.3 Design, Structure, and Techniques for Big Data Technology
Data analysis, like big data, is defined by three main traits: quantity, speed, and diversity. There seems to be little question that knowledge will continue to be created and acquired, resulting in an amazing volume of data. Furthermore, this data is now being acquired in live time and at a high rate. This is really a sign of speed. Third, various sorts of information are collected in standardized formats and maintained in workbooks or database systems. Addressing the data captured in terms of volume, velocities, and variation, the analytic approaches have evolved to accommodate these characteristics in order to further expand to the sophisticated and nuanced analytics required. Another fourth quality has been proposed by several scholars and researchers: truthfulness. As a result, data integrity is achieved. As a result, the acquired business intelligence tools are extremely trustworthy and error-free. Data analytics is not the same as standard business intelligence technologies. The effectiveness of business intelligence is determined by its infrastructure, instruments, techniques, and methodologies. The Atmospheric & Oceanographic Administering body of the United States uses big data analytics for assist with meteorological conditions & atmospheric surroundings, pattern discovery, and conventional operations.
Data analysis is used by the US Space Agency NASA for its aeronautical and other kinds of research.in the banking industry for investments, loans, customer experiences, and so on. Data analysis is also being used for research by financial, medical, and entertainment firms. To capture and utilize the possibilities of business intelligence, challenges relating to design and infrastructure, resources, techniques, and connections must be resolved. The fundamental infrastructure of big data and analytics is visualized in Figure 9.1. The very first row displays several sorts of large data providers. The information can come from both various sources, and it can be in a variety of forms and locations in a variety of classic and non-traditional processes. All of this information must be gathered for analytics purposes. The original data that had been obtained needed to be converted. Various kinds of sources, in general, release huge data. The upper vertical according to the above structure represents the various services which are used to query, acquire, and analysis the information.
A database engine collects information from diverse sources and makes it accessible for the further investigation. The next one described several big data analysis and infrastructures. The number of mainstream available data is fully accessible. The last one is a representation of the methodologies employed in big data and analytics. Inquiries, summaries, online data analysis preparation (OLAP), and text mining are all part of it. The key result of the overall data science approach is visualization. To gather, process, analyze, and display big data, several approaches and systems have been utilized and developed. Such methods and approaches come from a variety of disciplines.

Figure 9.1 Architecture for large-scale data computing in standard.
9.4 Aspiration for Meaningful Analyses and Big Data Visualization Tools
Data science does not simply imply a gradual shift from conventional data processing; it also includes the appropriate real-time business intelligence and visualization tools, as well as the capability to automatically incorporate with conventional networks that are required for business assistance programs, business process management, marketing automation, and decision support systems. Information from disparate data analytic bridge the gap among conventional networks and big data to produce critical results. Consumers’ abnormalities, customer support, and online marketing are all examples of smart intelligence. In the end, this one will strengthen the user experience with their merchandise. Private citizens with experience have done well enough in recent years to get into the corporate world. In today’s modern circumstances, the legitimate business professionals identify greater insight to reduce company value from huge amounts of data. Business intelligence will assist them in choosing a superior esteem suited for generating the finest company analysis results.
The Internet of Things (IoT) is becoming increasingly important in facilitating access to various devices and equipment in the commercial setting. This change propels us toward digitalization. With the help of IoT, the conventional manufacturing model is transformed into a much more innovative and reliable manufacturing environment. The primary new strategy against an intelligent production facility is to facilitate communication among today’s modern external companions with the ultimate objective of relating including an IoT-based production architecture. The IoT-based approach asserts the pyramidal and controlled industrial automation hierarchy by allowing the aforementioned participants to monitor respective services to different layer flattened production environments [1]. It means that the architecture can continue to operate in a shared natural setting rather than in an entangled and significantly linked manner. The interconnected physical environment offers a framework for the creation of novel applications. Organizations are attempting to get even more insights from data by utilizing business intelligence, cloud infrastructures, and a variety of other techniques. Significant challenges associated with the technologically paradigm include rationality, network connection, and architectural environment compatibility.
The lack of a standard current approach for production planning leads to custom-made software or the use of a handcrafted procedure. Furthermore, a joining combined assumption of highly nonlinear components and telecommunication systems is crucial [1]. The notion of ambience cognition is explored in [2]. The article depicts smart classroom rooms, intelligent college campuses, and associated structures. A TensorFlow K-NN classification technique is described in [3]. The Genomic dataset has 90,000,000 pairings. This information will be utilized in the minimization. The Genetic dataset’s disequilibrium data was decreased to correct findings without compromising performance [4], addresses the use of Twitter tweets for meta descriptions sentiment analysis. This approach was developed to provide a better knowledge of consumer inclinations. It will aid in advertising strategies and strategic directions. Facebook online data creates a large amount of information. Another sophisticated Fb-Mapping technology [5] has been developed to oversee Facebook data. Emotional responses are unnecessary and hazardous to excellent logic and common sense [6, 7]. A pattern recognition tool [7] is necessary for investigating background and hypotheses emotional states [7]. The document [8] discusses the examination of sociological interpretations based on advances in science and technology with surveillance technology and social scientific studies.
The work proposed by the investigators in respective [9–11] address the use of IoT and machine learning in medical institutions and data analysis. The Economist Intelligence Unit presented a paper a paper [12] considers the implications of exporting production in the region as a whole. The data analyst predicted that they will enter the industrialization, which would focus on industrial digitalization, often known as smart production. The Internet of Things (IoT) is a critical element of industrial automation. Regardless of the fact since M2M communication, digitalization, Scada, PC-based microcontroller, and biosensor usage are all currently in use in various companies, they are mostly disconnected from IT and functional structures. As a result, timely decision making and actions are lacking in many undertakings. Following a role is critical for any organization to push toward the information examination.
9.4.1 From Information to Guidance
Information is only helpful when this is decoded into significant meaningful insights. The great majority of businesses rely on data to make sound decisions. The three critical important factors necessary for persuasive making decision in the commercial environment are the right kind of people, the right moment, and the appropriate facts. Figure 9.2 shows essential judgment call factors necessary in an industrial context. The innermost triangle in the image represents different organizational decisions need to be made. Choices are made more quickly if the appropriate data is provided to the right audience at the right moment. Individuals, knowledge, and opportunity are the three fundamental necessary components.
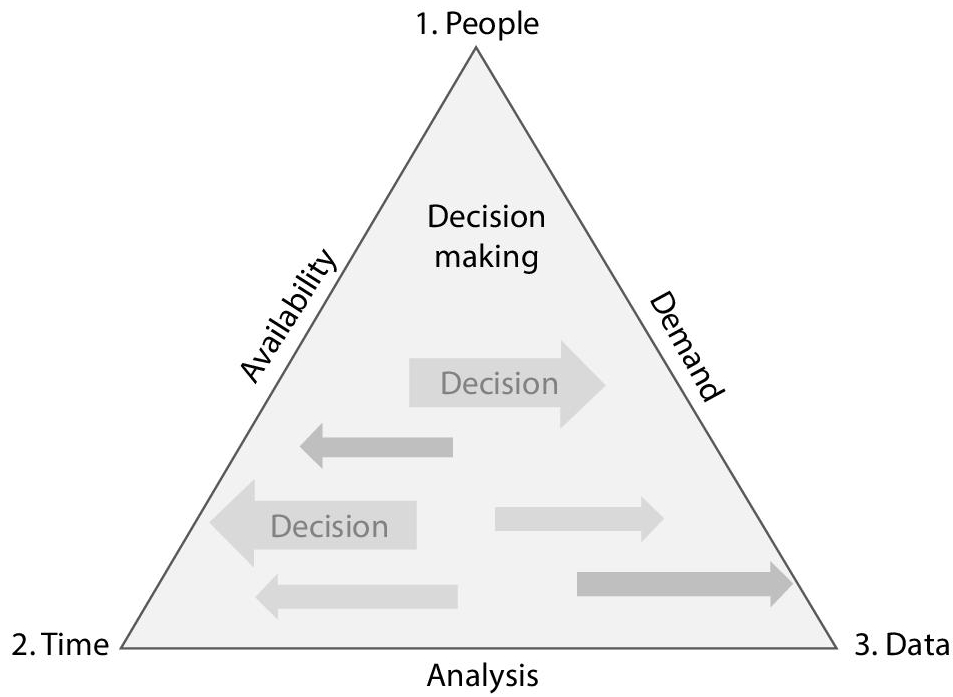
Figure 9.2 Important decision-making considerations.
Accessibility to be recognized to the individuals at the appropriate moment, desire may be calculated from available information and acknowledged to the people in addition, the acquired data had to be evaluated in real - time basis. Analytics-derived insights drive forceful strategic planning. A most successful strategic planning incorporates a smorgasbord of sources of data and provides a comprehensive perspective of the business. Irrelevant data can occasionally become a crucial component in large data. Organizations must understand the critical data relationships that exist among diverse data sources categories.
9.4.2 The Transition from Information Management to Valuation Offerings
As from standpoint of creativity, today’s volume of information is a gigantic quantity, continuous knowledge availability, and semi - structured and unstructured content. A reliable data analytics platform should be capable of transforming a large amount of data into meaningful and informative encounters. This will lead to better business decisions.
To fully explore the benefits of business intelligence, the system should be developed with legitimate and analytic applications to facilitate informed decision for continual results from computers. Meaningful data analysis gives significant knowledge into processes. It boosts operational effectiveness. This is very useful for performance monitoring and management software. Big data has been used in a variety of endeavors, and it derives value from a huge database and answers in real time.
- Smart buildings provide an innovative perspective on how metropolitan areas work. Urban areas are meant to satisfy the pressing management in liveliness requests, preventative social security method, transportation infrastructure, electronic and computerized voting options, etc, which necessitates successful efficient large - scale data administration.
- Science and medicine facilities release and analyze a vast range of healthcare data, and information generated by diagnostic instruments has accelerated the use of data science. Extensive dataset consists interested in the development of Genomic DNA, diagnostic imaging, molecular characterization, clinical records, and inquiry, among other things. Extracting useful information insight from such a huge data set would assist clinicians in making prompt decisions.
- Massive developments are taking place in the realm of communications devices. Mobile phone is rising by the day. Huge amount of data are used to derive insights to achieve the greatest amount of network quality by evaluating traffic management, hardware requirements, predicting broken equipment, and so forth.
- Manufacturing businesses commonly integrate different types of sensors in manufacturing equipment to monitor the effectiveness of the equipment, which aids in the prevention of maintenance issues. The eventual aim of digitalization is to adopt better at each and every stage of the production process. The sensor used is affected by the nature of the activity and the merchandise. As a general rule, delivering the correct information to the correct individual time is a critical component of industrial automation.
9.5 Big Data Applications in the Commercial Surroundings
The first step in realizing the concept of device-to-device communication or intelligent systems is to understand the current production system. The IoT-based solutions are thought to be capable of transforming the traditional manufacturing configuration into industrial automation. The informational system is an essential transformational component in directing industrial businesses into the next transition. This section represents two usage examples for data science with in manufacturing enterprise. The machinery unified data analytics paradigm is depicted inside one utilization case, while the humanly directed organizational business plan is depicted in the other.
9.5.1 IoT and Data Science Applications in the Production Industry
IoT is an element in the development of digitalization and product improvement. The primary requirement for Industrial revolution 4.0 is the inclusion of IoT-based smart industrial flavors. The information network in the production setup significantly reduces human involvement and allows for automatic control. IoT will assist policymakers in inferring decisions and will maximize efficiency and transparency of manufacturing line statistics. It provides immediate input from the industrial plant’s activities. This provides you the opportunity to act quickly if the plan deviates from actuality. This section outlines how the Internet of Things is implemented in the production line. The overall design of sensing connection with machinery is depicted in Figure 9.3.
Its architectural style consists of five phases. Its main stage communicates well with machineries that are linked to various sensors and devices in order to obtain information. The message signal is routed via the central hub. The network communicates via a remote or connected way. The information was then sent to support additional judgment call. The revolutionary advanced analytics platform is indeed the end result of the IoT infrastructure as a whole. This part describes the many strategies used for collection of data as elements of IoT, as well as the translation of information received into the appropriate data structure including data analysis procedures.
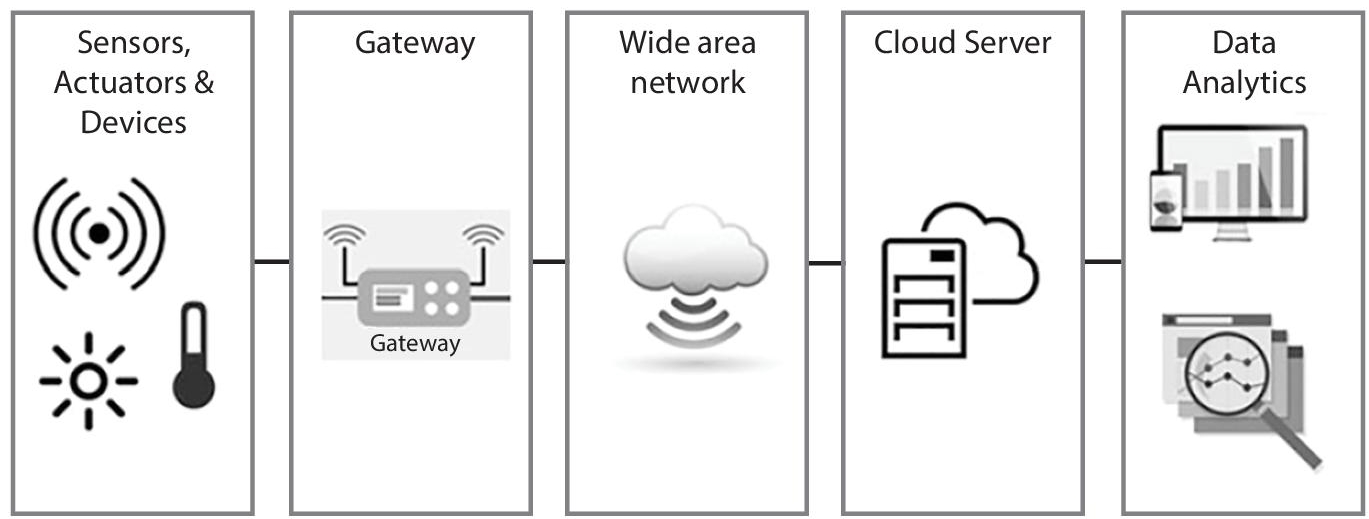
Figure 9.3 To show the overall design of sensing connection with machinery.
Following the adoption of IoT in companies, there has been a huge increase in the number and complexity of data provided by equipment. Examining huge amounts of data reveals a new technique for creating improvement initiatives. Huge data analytics enable the extraction of knowledge through machine-generated large datasets. It provides an opportunity to make companies more adaptable and to respond to calls that have been previously thought to be out of our grasp. With above Figure 9.4 depicts the basic layout of the IoT interconnected in a production-based industrial enterprise.
The first process is to establish a sensor system with instruments. An effective information analytics platform created and implemented to enable employees at all organizational levels to produce better quality decisions based on available information collected from several systems. The procedures that go along with information processing are incorporated in the given data analytic system. The overall structure is divided into three key stages. All of the important steps are covered in detail here.

Figure 9.4 To show the basic layout of the IoT interconnected in a production-based industrial enterprise.
9.5.1.1 Devices that are Inter Linked
A scanner is a device that transforms physical parameters into equivalent electrical impulses. Sensors are chosen depending on the attributes and kinds of commodities, operations, and equipment. Many probes are commercially available, such as a thermal imaging sensor, a Reed gauge, a metal gauge sensor, and so on. Preferential sensors may then be linked to machinery depending on the information gathering requirements. The impulses sent by machineries are then routed to the acquisition system. Each instrument connected to the detectors is designated as a distinct cluster. The information gathered from sensors are being sent to the commonly used data collection equipment. Figure 9.5 depicts the information transfer. Each device includes a sensor that converts mechanical characteristic features into electrical impulses.
9.5.1.2 Data Transformation
Data collection is the process of converting physical electrical impulses into binary signals that could be managed by one computing device. It usually converts the signal conditioning impulses supplied by detectors to electronic information for subsequent processing. Figure 9.6 depicts the analogue-to-digital conversion. Managing the information recorded by machinery is a significant problem in the industrial setting. The data processing device’s source is mechanical impulses, and its return is alphanumeric numbers sent from the acquisition system.

Figure 9.5 Signal transmission from multiple equipment toward a data acquisition system.

Figure 9.6 To show the analogue-to-digital conversion.

Figure 9.7 To show the overall organization of information acquirer operations.
Figure 9.7 depicts the overall organization of information acquirer operations. Data collection is an essential stage in industrial automation. It frees huge amounts of data at incredible speeds. While operating, it transfers data every second. Such information is massive, complicated, and contains a lot of information. Because the dataset is large, an efficient and effective gathering and conversion procedure is necessary. The entire acquiring procedure is conducted in the following steps.
Step I: Information Collection and Storage
This device serves as a bridge among different sensors, as well as a computer architecture. The constant information is transferred from various equipment are the most essential element of the data acquisition system. The interface is in charge of data transport. It gathers information each 20 milliseconds. Application software is used to carry out data collecting activities. These appropriate statistical instructions are product dependent and differ from one instrument to the next. The alphanumeric format was then converted to binary in order to differentiate between active and dormant devices, as well as their respective statuses. Each port corresponds to a single device. The most difficult problem, therefore, is getting the proper data. A buffering is added to the program to minimize problems while data transmission. In certain situations, the information generated by detectors is incomplete and banal. The result of one sensing instrument is not as much as same as the output from others. Legitimate analysis of the data necessitates an accessible and faster processing of data.
Step II: Cleaning and Processing of Data
Typically, the collected data will not be in the suitable form for analysis purposes. The information filtering procedure extracts the important data from the sensor information that is appropriate for analysis. Obtaining the appropriate facts is a technological issue.
Step III: Representing Data
The data processing approach is a difficult process that necessitates a high degree of information unification and consolidation in an autonomous way, ensuring effective and thorough analysis. This procedure necessitates the use of a data model to hold operational data in a system setting.
Step IV: Analytical Input
The IoT-enabled data enables the company to derive meaningful insights with both the assistance of a smart analytical technique. Data analytics assist companies in outfitting existing information and assisting businesses in determining open entryways. This improved research helps the company make, better strategic company actions, better profitable activities, and increased customer retention. The search method is not like in typical database. These data have been collected from the devices in this scenario. Occasionally chaotic data may join the collection of data as a result of environmental disruptions. Detection and eradication of such material is strongly advised in big data [14].
To obtain personal experience from the provided data, query processing options must be used intelligently. It should give actionable concrete answers. At that time, the data gleaned will be stored in a file for subsequent examination. Monitoring is a critical stage for machine-to-machine communication. This is a point of contact between humans and machines. The interface’s data should be in a client-acceptable format. Policymakers must understand the graphical types of assessment and extracting meaningful intelligent findings. Figure 9.7 depicts a snapshot of a facility’s rotating machines normal operating condition. Every square represents the device’s condition.
The white tone indicates that the equipment is operational. The devices indicated by white shade areas are unaffected. The grey hues indicate that the equipment is functioning at a reduced production potential. This increases the performance of both the operator and the device. The dark shade tiles represent the device’s idle condition. The idle state could be intentional or unintentional. The image below is from a huge monitor at the production factory. So that everyone in the plant is aware of the immobility and can act immediately. The idle situation is addressed for that in Figure 9.8 for the devices M12, device M24, device M42, and device M44. The devices M21, device M32, device M31, and device M46 are grey, indicating that they are functioning at a low performance. There were no difficulties detected in any of the remaining white-shaded devices. The standard machine condition obtained in Figure 9.8 is displayed on a larger screen at the production site.
Each device’s operational condition may be viewed by personnel in the production plant. By this transparency, action may be taken immediately. This causes the manufacturing team to move quickly. A good visualization structure will communicate the best results of the queries in a more understandable manner. Figure 9.9 shows a sample snapshot of the device’s current condition.
This graph represents the device’s inactivity and operating status. This is an outcall supervisory to make rapid actions. It displays not only the device’s current state, as well as the device’s operating condition. The starting numbers in Figure 9.9 were inactive in the chart, and the condition altered when the device began. The chart’s history clearly demonstrates this. This display is handy for viewing the overall pattern of all devices. Figure 9.10 depicts the operational state of a single console.
The single processor condition displays extra information such as the product title, amount of output, and overall equipment effectiveness. The display pictures used here are examples of the architecture. This device may provide a variety of outcomes. With aid of legitimate dataset, predictive modeling ought to be feasible, so repair actions ought to be able to begin shortly after getting the incorrect signals from the device. By transferring the correct knowledge to the existing structure, this device coordinated information may reduce the need for manual data input.

Figure 9.8 To show the standard machine condition.

Figure 9.9 To show the overall working efficiency of the production devices.
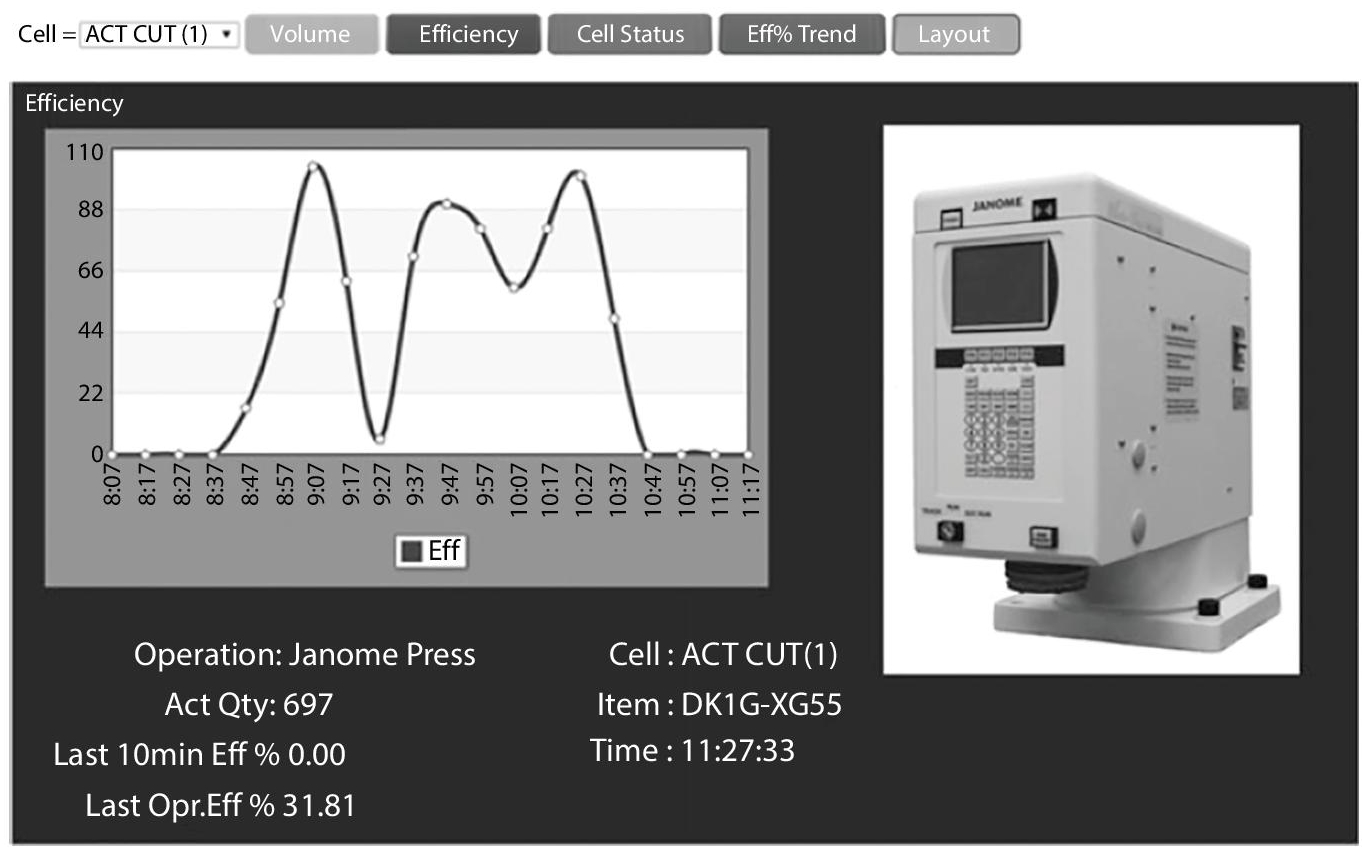
Figure 9.10 To show the operating condition of every individual device.
9.5.2 Predictive Analysis for Corporate Enterprise Applications in the Industrial Sector
Resource planning data may be used to analyze sales, inventories, and productivity. The information is stored in many database systems. The information in this application case is stored in Mysql with Ms Access databases. All have a diverse data structure. In the event of large datasets, integrating both and delivering meaningful intelligence is a critical responsibility. Many what-if analyses are quite beneficial in comprehending and breaking down the facts from inside. In the finance industry, what-if analysis. quantitative analysis, and demand forecasting yield a wide range of findings from massive amounts of data. To advance, upper executives need judgment assessment. Forecasts in time keep many concerns out of making decisions. Figure 9.11 describes the correlation of a top company’s revenues per year ago vs in the year.
All client identities are concealed in the network for privacy reasons. But rather one of measuring the data with some columns, this analytics platform successfully obtains the areas of data. Figure 9.12 depicts product-specific revenues. It generates a graph based on the data collected in the automated corporate business model.
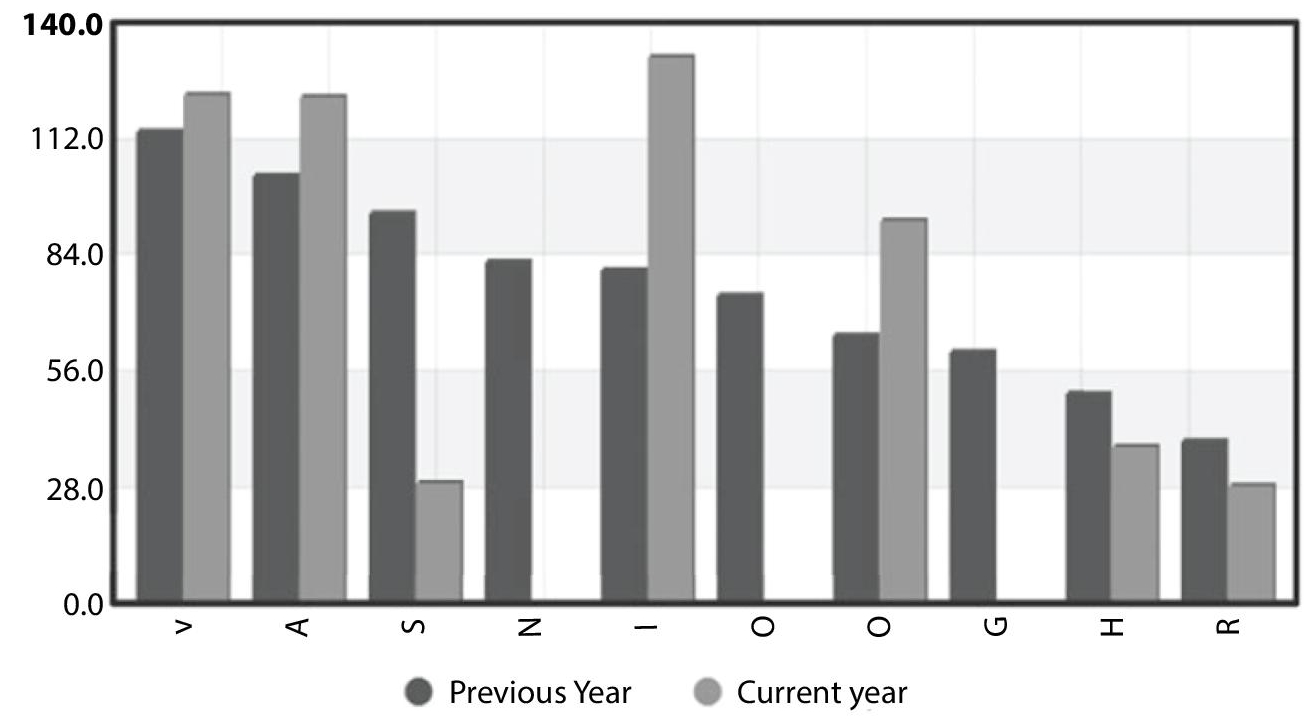
Figure 9.11 To show the correlation of a top company’s revenues per year ago vs in the year.

Figure 9.12 To show the product-specific revenues.
This aids in comprehending the demand for various market segments. Organizations can opt for better choices in product categories in which more precision of thought is required. Figure 9.13 below depicts a pay period inventory check. This computational modeling was obtained from of the corporate business program’s accessible values. The corporate system comprises a massive dataset including all of the firm’s information. Computational modeling is used to route and visualize data that is useful for corporate decision making. Figures 9.11 and 9.12 depict marketing and customer data, whereas Figure 9.13 depicts material-related data. This information is available on the cloud.
As a result, businesses may observe and make decisions from any location. For both situations, intelligence assists upper managers in formulating timely and major decisions. Figure 9.14 depicts the many systems that comprise a conventional manufacturing business.

Figure 9.13 To show material-related data available on the cloud.

Figure 9.14 To show systems that comprise a conventional manufacturing business.
A cloud-based enterprise resource or system services and commodities framework assists businesses in managing critical aspects of their operations. It combines all of the company’s current business operations into a single structure. The integration of organizational resource planning and supply chain operations improves the whole distribution network in the production industry. The arrival of IoT and advancements in computer technology give a much more significant opportunity to develop stronger client interactions. Each organization’s overall business goal is to increase revenue; the Customer Connection Management software opens the possibility of a better experience while decreasing communication overhead.
The Costumer Connection Management software paves the change for a successful connection while reducing communication costs. Resource Chain Management is the accomplishment of the connection with the objective of exchanging more loyal consumer value of a product in the production. IoT application scenarios are a clever way of gathering input. The IoT connection does not need human involvement. It collects data from of the device periodically. Data analysis is a way of extracting, modifying, analyzing, and organizing huge amounts of data using computational equations to generate knowledge and information that can be used to make important selections. Despite the fact that business intelligence provides a lot of useful information from a large number of data, it also has certain problems. These difficulties are addressed in the following section.
9.6 Big Data Insights’ Constraints
Managing massive amounts of data is the most difficult problem in big data technology. Converting unorganized data into an organized information is a major concern, and afterwards cleansing it first before applying the data analytics is another major issue. Data information available in the traditional model provides data product related, related to a client or a provider, the durability of the material, and so on. Many businesses are taking creative steps to meet the Smart manufacturing requirement. This requirement necessitates the use of IoT. As demonstrated in case study 1, the architecture should be capable of accurately anticipating and assisting individuals in making better decisions in real time. Major companies have started to alter their operations in order to address the difficulties posed by big data.
9.6.1 Technological Developments
The current technique allows for appropriate information storage and retrieval. However, it necessitates a specific attention in the field of IoT and the processing of machine-generated data. Aside from mining techniques, these following steps should be taken:
- Formulate appropriate suitable technique and design
- Improved first most current application’s flexibility and reliability’
- Creating commercial value through large datasets.
Merely going towards business intelligence will not assist us till we understand and create economic potential from the long - standing research. Adopting innovative data science tactics, computation offloading, and unique tools will aid in the extraction of relevant insights in businesses. Businesses should indeed be prepared to accept these changes.
9.6.2 Representation of Data
The goal of large datasets is not merely to create a huge collection. It all comes down to producing advanced computers and intelligence. It is important to select a somewhat more suitable business intelligence technology. It ought to, since they visualize the combined information quality produced by the system and comprehension by the device. Its major benefits include
- Referred to collectively universal values via given assistance;
- To use an autonomous technique to speed computer produced analysis of data.
- Dilemma options and the relevance of data gathering.
9.6.3 Data That Is Fragmented and Imprecise
The management of unstructured and structured data is a significant problem in big data. During the troubleshooting step, the production machine ought to be able to interpret how to process the information. In the context of human data usage, variability is easily accepted. Filtering of flawed information is a difficult task in big data technology. Also, after information purification, there is still some tarnished and dirty information in the data collection. Coping with this during the data collection stage is by far the most severe challenge.
9.6.4 Extensibility
For a long period of time, managing large databases with constantly expanding data has been a difficult challenge. Regardless, current developments in network connection, sensing devices, and medical systems are producing massive amounts of data. Initially, this problem was alleviated by the introduction of high-end CPUs, storage systems, and simultaneous data analysis. The next new paradigm shift is upon using the cloud technology, which is based on resource sharing. It is not enough to provide technological platform for data handling. It necessitates a new level of data administration in terms of data preparation, search handling algorithms, database architecture, and fault management mechanisms.
9.6.5 Implementation in Real Time Scenarios
Performance is a critical component in real information execution. The output may be required rapidly in a spectrum of uses. In our first case study, the machine is linked to data gathering equipment for predictive analytics. On the machine, continuous selections such as device shutdown alarms and efficiency are established. So immediate action is necessary upon it. In the event of shopping online, banking transactions, detectors, and so on, rapid execution is necessary. Analyzing the entire data collection to respond the questions on the real time scenario is not feasible.
This problem would be solved by using the appropriate clustering algorithm. Nowadays, a most difficult problem for most businesses is turning mounds of data to findings and then transforming those findings into meaningful commercial benefit. KPMG Worldwide [13] surveyed many leaders in the sectors on real-time analytics. According to the results of the poll, the following are the most significant challenges in business intelligence.
- Choosing a corrective solution for precise data analysis.
- Identifying appropriate risk factors and measurements.
- Movement in real - time basis.
- Data analysis is critical.
- Offering predictive analytics in all areas of the company.
Whenever technology progresses, it becomes extremely difficult to get meaningful information. However, a new, technological superiority always will arise to forecast market development prospects. Despite the numerous obstacles of big data, each company needs predicted analysis to detect unexpected correlations in massive amounts of data.
9.7 Conclusion
This chapter has discussed the critical functions of data analysis in the industrial sector, namely in the IoT context and as a significant actor in the maneuverable business climate. Most companies’ success necessitates the acquisition of new skills and also different perspectives about how to manage big data, which has the potential to accelerate business operations. The modern advanced analytics that have emerged with real liberal company models are an important component of this creative method. The inventive capacities of the rising big data phenomena were explored and dealt in this chapter, as were numerous concerns surrounding its methodology for modifications. The major conclusions are supported by portraying real-life instances.
Various difficulties relating to big data’s expand the knowledge and modeling tactics adopted by a number of significant commercial companies. In truth, it is clear that big data is now included into the workflows of several organizations, not because of the buzz it generates transit for its innovative potential to completely transform the business landscape. Although novel big data approaches are always emerging, we been capable of covering a few major ones that are paving the way for the development of goods and services for so many businesses. We are living in the age of big data.
A data-driven business is very effective at forecasting consumer behavior, financial situation, and Supply Chain Management systems. Improved analysis allows businesses to gain deeper information that would increase revenue by delivering the correct goods, which would need more in-depth knowledge. Greater insights would be required for business decisions. The technological problems mentioned in this study must be overcome in order to fully exploit the stored information. Because although data analytics is a strong decision-making resource, information dependability is critical.
In the data and analytics paradigm, there are several possible research avenues. Many governments and industrial companies across the world are shifting their focus to industrial automation in order to attain Industry 4.0. The primary guiding principle for this vision is the concept of technologically operation, in which the manufacturer is heavily connected to be software focused, data driven, and digitized. Total system efficiency is a well-known manufacturing statistic used to offer a gauge of any work center’s success. Total system efficiency also provides businesses with a framework for contemplating on IoT application—rebuilding effectiveness, utilization, and reliability.
References
- 1. Vermesan, O. and Friess, P., Internet of things- from research and innovation to market deployment, pp. 74–75, 2014, River Publishers ISBN: 978-87-93102-94-1
- 2. Bureš, V., Application of ambient intelligence in educational institutions: Visions and architectures. Int. J. Ambient Comput. Intell., 7, 1, 94–120, 2016.
- 3. Kamal, S., Ripon, S.H., Dey, N., Ashour, A.S., Santhi, V., A MapReduce approach to diminish imbalance parameters for big deoxyribonucleic acid dataset. Comput. Methods Programs Biomed., 131, C, 191–206, 2016.
- 4. Baumgarten, M., Mulvenna, M., Rooney, N., Reid, J., Keyword-based sentiment mining using Twitter. Int. J. Ambient Comput. Intell., 5, 2, 56–69, 2013.
- 5. Kamal, S., Dey, N., Ashour, A.S., Ripon, S., Balas, V.E., Kaysar, M.S., FbMapping: An automated system for monitoring Facebook data. Neural Netw. World, 27, 1, 27, 2016.
- 6. Brun, G., Doguoglu, U., Kuenzle, D., Epistemology and emotions. Int. J. Synth. Emo., 4, 1, 92–94, 2013.
- 7. Alvandi, E.O., Emotions and information processing: A theoretical approach. Int. J. Synth. Emot., 2, 1, 1–14, 2011.
- 8. Odella, F., Technology studies and the sociological debate on monitoring of social interactions. Int. J. Ambient Comput. Intell., 7, 1, 1–26, 2016.
- 9. Bhatt, C., Dey, N., Ashour, A.S., Internet of Things and Big Data Technologies for next generation healthcare, Series Title Studies in Big Data, Springer International Publishing, AG, 2017 DOI: https://doi.org/10.1007/978-3-319-49736-5 eBook ISBN 978-3-319-49736-5 Published: 01 January 2017.
- 10. Kamal, M.S., Nimmy, S.F., Hossain, M., II, Dey, N., Ashour, A.S., Santhi, V., ExSep: An exon separation process using neural skyline filter, in: International conference onelectrical, electronics, and optimization techniques (ICEEOT), 2016, doi: 10.1109/ICEEOT.2016.7755515.
- 11. Zappi, P., Lombriser, C., Benini, L., Tröster, G., Collecting datasets from ambient intelligence environments. Int. J. Ambient Comput. Intell., 2, 2, 42–56, 2010.
- 12. Building Smarter Manufacturing With The Internet of Things (IoT), Lopez Research LLC2269, Chestnut Street 202 San Francisco, CA 94123 T(866) 849–5750W, Jan 2014, www.lopezresearch.com.
- 13. Going beyond the data: Achieving actionable insights with data and analytics, KPMG Capital, https://www.kpmg.com/Global/en/IssuesAndInsights/ArticlesPublications/Documents/going-beyond-data-and-analytics-v4.pdf [Date:11/11/2021].
- 14. Swetha, K.R. and N. M, A. M. P and M. Y. M, Prediction of pneumonia using big data, deep learning and machine learning techniques. 2021 6th International Conference on Communication and Electronics Systems (ICCES), pp. 1697–1700, 2021, doi: 10.1109/ICCES51350.2021.9489188.
Note
- *Corresponding author: [email protected]