
14 Algorithmic modelling, parametric thinking
There are several keywords associated with design methodologies and software tools associated with them, which include, generally, ‘computational design’ and ‘building information modelling’ (these terms somewhat replaced ‘computer-aided design’) and, more specifically, ‘parametric design’ and ‘algorithmic design’. I suggest that these latter two terms describe an approach to design as much as (or more than) a type of software tool created to enable this approach. In fact, special software tools (or even computers) are not necessary to design this way.
Computers and software tools, however, can substantially enable the designer to design and explore ‘design spaces’ to levels and to depths that would be a challenge without them. In my experience, at the office and also working in collaboration with artists and independently, I have found that the simplest software tools can also be the most powerful, that generic tools with the ability to be programmed or scripted can be more flexible and less encumbering than more powerful tools designed to be used in a particular way.
In this chapter, I will describe some of the innovative contributions to the field of computational design made by Skidmore, Owings & Merrill, as well as my own education and interest in geometrical modelling and algorithmic methods. The intersection of these two things has provided the opportunity for me to participate in many different ways on many projects at SOM – different ways in one aspect, which is a great variety of types of problems to work on; but usually participating with methods and an overall philosophy that is shared from project to project. A variety of examples of this will be presented.
Developing software tools for architects
Skidmore, Owings & Merrill is an interdisciplinary design firm, well known for designing very large and complex projects. Founded in 1936, SOM is internationally recognised as a leader in the design of skyscrapers and other building types, and for the development of technological innovations in structural design, building systems, curtain walls, as well as design software, all of which are integral to the buildings we design. In the 1970s and 1980s SOM developed its own software tools specifically to meet the needs of its practice: to enable it to model (design, analyse, document) large and complex projects (e.g. skyscrapers, hospitals, airports) and to enable large interdisciplinary teams to collaborate on these projects, sharing the same set of data. Initially called ‘DRAFT’ (an unfortunate name, I think, because it was much more than a drafting tool, but a full three-dimensional modelling tool, with some interesting features even lacking in today’s more sophisticated software), it was eventually further developed in collaboration with IBM to become a commercially available tool for the building industry called ‘AES’ (Architecture and Engineering Series).
Figure 14.1 The earlier ‘green-screens’ used by SOM. (Image © SOM.)
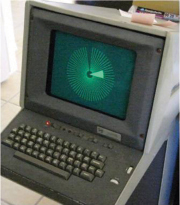
When I began working at SOM, while I was still a student of architecture at Pratt Institute, Draft was being used by a handful of (maybe a dozen) people in the New York office. I was hired as a ‘plotter operator’. Our computer system consisted of a mainframe computer and terminals distributed throughout the office. All processing was done on the central computer; the terminals basically consisted of just a screen and a keyboard. When more people wanted to use Draft than the one mainframe computer could handle, we had to get another mainframe computer – if too many ‘users’ were connected to a single computer, it slowed down everyone. Architects would generally work on their models and/or drawings during the day, and if they wanted printed documents of their work, they would fill out a form as they left the office in the evening and pick up their completed ‘plots’ the next morning. Printing was done overnight, otherwise it would slow everyone down during the day. It was my job to collect the forms and plot the drawings. When I wasn’t busy running the plotters, I was able to learn how to use the software (and when I started working full-time after graduating, was able to teach it to others).
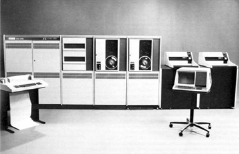
The equipment we were using at that time seems pretty dated today (Figure 14.1). We affectionately referred to them as ‘green-screens’. They created images on the screen in an analogue way; there were no pixels, the image was much like that you might see on an old oscilloscope. Figure 14.2 shows the mainframe computer and all its accessories. Technically it was a mini-computer, not quite as powerful as a mainframe. It needed its own huge air-conditioned room, with a raised floor for cables, disk drives for data storage, tape drives for back-ups, a terminal with a keyboard and screen and a dot-matrix printer. Instead of a mouse, the cursor was controlled by two thumbwheels (to the right of the keyboard) – one thumbwheel moved the cursor left and right, and the other up and down. These became as fast and intuitive to use as today’s mouse.
Figure 14.2 The ‘mini-computer’: The mainframe computer and all its accessories. (Image © SOM.)
We had two types of plotters: electrostatic plotters for black-and-white drawings, and a pen-plotter for colour drawings. Colour plots were done sparingly – it could take all night for a single plot of a complex drawing. In addition to placing different colour pens in the four-pen cartridge, we experimented with placing model-making tools (such as a hard-tipped stylus) to create parts for physical models. Eventually (in the late 1980s) we acquired a laser-cutter in our model shop.
In 1980, SOM published a booklet called ‘Computer Capability’. It was a brochure highlighting some of the features of Draft and how it was being used at the office. Intended as a marketing tool, it addressed how our projects were benefiting from using these tools that we had developed – how we were able to create better designs, and analyse and document them, more thoroughly and efficiently than could be done without such tools. In the booklet we referred to a relatively unique approach: ‘Information from a single data base is used to draw a variety of graphic illustrations.’ The same data was used for far more than to draw a variety of graphic illustrations – it was also used to perform many analyses, including structural analysis, environmental (particularly shadows) analysis, work schedules (e.g. doors, furniture, equipment) and so on. With our collaboration with IBM, AES became available on workstations that could be at someone’s desk instead of in a computer room. At first these were very powerful (and expensive) UNIX workstations, but eventually AES became available on standard PCs.
One aspect that made Draft so successful was that at the time it was developed and used, sharing of electronic information was an issue only internally; SOM had just about all the disciplines required to design and engineer the projects that we work on in-house. Anyone outside of the office we needed to share our information with (consultants, clients) could not use the electronic information (because they were not using computers), so they required paper documents, which we were easily able to provide, either as backgrounds or as final documents. When other entities began requiring from us electronic data in a different format than it was created, we began dealing with issues that were frustrating and had little to do with our design process. We did build translators into our software, but they are never perfect and rarely even acceptable (and that has not improved much, even today).
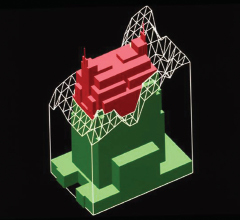
Figure 14.3 An early model developed for the World Trade Center, created with AES. (Image © SOM.)

There are a couple of features of Draft and AES that were particularly attractive to me, which did one or both of the following: allowed me to work in a way which was consistent with how I was beginning to think about the design process – that the result of the process was a system or a process itself rather than a particular design or form or product (and this thinking was directly related to my research in geometry and form) – or encouraged me to work that way.
One aspect of the software which did this was that the tool was extremely simple. This isn’t to diminish at all the incredible effort that went into designing and building the tool – in fact, to say that the tool was simple is meant to be an extremely positive statement, and to create the tool to be simple probably required more effort than to create a complex tool. The basic set of primitives that the software used to create a model were points, lines and polygons. There weren’t even curved objects (e.g. arcs, circles, splines), which needed to be approximated with lines and straight-edged polygons.
Another aspect of the software was the ability to create simple ‘programs’ to create models. Today we would probably call this ‘scripting’. The interface to the application was command driven; this was one complaint that many people had, that there was too much typing, but this also made learning scripting much easier. As AES developed, new primitives were introduced, including arcs and circles, and eventually even architectural objects like wall and doors and windows. My favourite AES primitive was something called a ‘cell’, which was a collection of commands (a script) that could be placed as an object in the model. Like other objects (such as points), a cell’s attributes included its location in space, and that could be used as a parameter in the set of instructions embedded in the cell.
Figure 14.3 shows the last model that I created with AES, in late 2001 and early 2002. This is an early model of a scheme we were developing for the World Trade Center after 11 September 2001. This is one of many models experimenting with variations of a structural system, which featured a diagrid at the exterior of the tower. These variations were created with a script.
Figure 14.4 The ‘no-shadow’ envelope for a project in Boston. (Image © SOM.)
SOM had a team of programmers that were responsible for writing the code for Draft and AES. In addition to creating the main modules of these systems (which included the basic graphics-creation module, a rendering module, a plotting module and various analysis modules), they also created special smaller applications to meet particular office or project requirements (usually when scripting was not powerful enough). We have implemented this in an analysis for a project in Boston (Figure 14.4). We were in the process of designing a building while a new law was being proposed that would prevent new buildings from casting shadows onto the Boston Commons. We were concerned that this law would be affect our project (it did). The law prevented a building from casting a shadow in addition to shadows which were already being cast by existing buildings, and within some reasonable time range (not too close to sunrise and sunset). We created an application that considered the following: the building site (its shape and location within the analysis context as well as its geographical location on earth), the park (shape and location), surrounding context buildings in three dimensions (which were already casting shadows onto the park) and a set of dates and times (for example the 21st day of each month, and from one hour past sunrise to one hour before sunset on these dates). The program generated a ‘no-shadow envelope’, which is seen in white in the image. We compared the building we had already been working on to this envelope: the part of the building shown in red, which penetrates the no-shadow envelope, would at some point – even maybe for an instant – cast a shadow onto the park.
For projects in New York City, we go through an extensive zoning analysis process. The city has restrictions on the massing of new buildings, intended primarily to let daylight onto sidewalks and streets surrounding buildings. The zoning code for buildings in midtown Manhattan gives us a choice between two methods. The first is ‘encroachment and compensating recess’, which prescribes a zoning envelope, with setbacks increasing as height increases (encroachments of this envelope are allowed but each encroachment must have a compensating recess, and there are rules and limitations). Figure 14.5 shows a proposed building and its encroachment and recess in relation to the zoning envelope for its site. The other method is ‘daylight evaluation’, which defines a ‘skygrid’ and viewpoints, and a method of projecting the proposed building from these viewpoints (the projection is called ‘Waldram’) and deducting points for each cell in the skygrid that the projection of the building touches. The first method can be done quite easily with simple modelling tools, but the second method is much more difficult. SOM’s team of programmers created an application for this analysis, which read a 3-D model of the building, a site polygon, and asked questions about street widths (which are used in setting views). In minutes we had a score for the building, as well as a graphical representation of the analysis (the city requires both of these to be submitted). This graphical representation is shown in Figure 14.6 (this is the same building shown in Figure 14.5). The speed at which we could do this analysis made it as useful as a design tool. We could immediately respond to the results and modify the building to get a passing score. How does one decide which method of zoning analysis to use, if we have this choice? It’s very tempting to choose the easier method, but each analysis method favours a slightly different massing, and a model that might fail one of the analysis methods might pass the other one.
Figure 14.5 The encroachment and recess of a building in relation to the zoning envelope for its site. (Image © SOM.)
Both of these custom applications were written to work with Draft format graphics files, and to run on our old UNIX workstations. We don’t have either of these any more and, because these applications are not typical and used consistently, they were never updated. We still do these analyses, but instead of depending on a dedicated application, they are performed, one might say, ‘manually’. For the Waldram zoning analysis, what took just a few minutes in the 1980s now takes a full day of computing projections and scores.
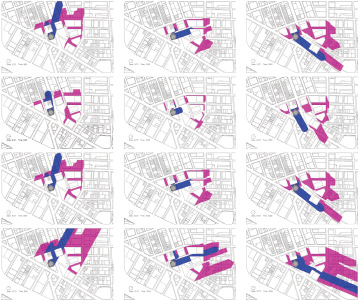
For most projects we perform some sort of shadow analysis. It is unusual to be as restricted in terms of shadows as we are near the Boston Commons, but we often want to know what effect the shadows of our proposed projects will have on their surrounding context (particularly open spaces), and also how shadows of surrounding buildings will affect our project. We often want to graphically distinguish our project’s shadows from the context shadows, and also often want to present a matrix of dates and times, giving on one sheet an overall picture, spanning times and dates, of the shadows changing as the sun’s position is changing (Figure 14.7).
Figure 14.6 A ‘waldram’ zoning analysis for a building in midtown Manhattan (same building as shown in Figure 14.5). (Image © SOM.)

In each case discussed in the following sections, a particular aspect of the project is presented, each with a unique problem to be solved or design issue to be addressed. Due to the fact that our projects are usually large and complex, our project teams are also quite large. The organisation of the team, and how I fit into the team, varies from project to project.
Figure 14.7 A shadow matrix for a project in Long Island City, New York. (Image © SOM.)
Project example: World Trade Center Tower One, New York – spire
Larry Silverstein had asked SOM to look at options for the site shortly after the World Trade Center towers were destroyed. We developed a masterplan for the site, and preliminary design ideas for the tall tower that was part of that masterplan (Figure 14.8). The tower featured a diagrid structure defining a massing which transformed from a triangle at the base to a circle at the top. Several of the diagrid experiments we looked at used a pure cylinder as the form, making the process of modelling the diagrid a bit easier, and allowing us to focus on certain aspects without the distraction of the transforming shape. These models were initially created with AES.
It was about this time that SOM was experiencing a transition from AES to AutoCAD. I should mention a few words about this transition in the office, and my own transition from one modelling tool to another. It is never easy to make a switch like that. (It is often not easy even to upgrade to a new version of the same software.) Our New York office had a clear distinction between people who worked on the design of projects (from conceptual and schematic design through to design development) and those who worked on documentation or ‘production’ (people belonged to either the ‘design’ department or the ‘technical’ department). (That distinction is becoming more and more obscured, partly due to the tools we are using and the changing way in which projects progress.) Our technical group was able to make the switch from AES to AutoCAD more quickly and easily than our design group. But in order to facilitate this, we spent much time and effort customising AutoCAD to make it behave, at least conceptually, like AES. AutoCAD’s early versions were not designed for large, multidisciplinary and very collaborative projects and methods of working, so we created a set of tools to help people load and save the data that they needed to work on, and in fact to allow people to update a database of the building information rather than work on one drawing or file at a time.
Figure 14.8 Preliminary structural diagrid design ideas for the World Trade Center Tower. (Image © SOM.)
My own introduction to AutoCAD was earlier than our transition at SOM: I was asked to teach it. I believe one needs to learn something differently when the goal is to teach it as opposed to when the goal is to use it to get something done, and this undoubtedly affected the way I began to use AutoCAD at SOM when we did make that switch.
How should people who are ‘computational designers’, or specialists in computational techniques such as parametric modelling or building information modelling, be implemented on projects at offices such as mine? Of course there is no single or correct answer, and I have been ‘implemented’ in a variety of ways, each of which has pros and cons for me, for the teams that I work with and for the office. I could generally work in one of two ways: as a resource for the office, not assigned to a particular project or team, but with several teams at once; or as a dedicated project team member. For the World Trade Center project, I was a full member of the team. One advantage of this way of working is that I become intimately familiar with the project and all its aspects, including team members and leaders and their capabilities and expectations.
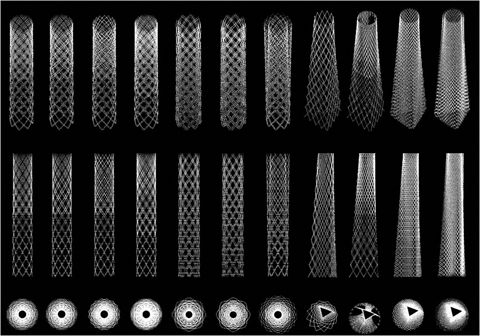
The design of the World Trade Center went through several iterations. After a competition for the master plan of the site (SOM did not become the master planners), SOM was awarded the design of One World Trade Center, the tallest of five towers on the site. The current design, under construction, is a square at the base, whose corners are chamfered as we go up the tower, to become an inscribed rotated square at the top, at 1368 feet to match the height of the original towers. Above that is a spire, containing broadcasting equipment, bringing the tower to an ultimate height of 1776 feet (as prescribed in the master plan). As a team member, I was involved in all aspects of the design, analysis, modelling, and documentation of the project. Most particularly and extensively, however, I was involved with the design, analysis and documentation of the spire. Initially the spire was conceived as a lattice structure, enclosing the broadcasting equipment, each piece or set of equipment with its own protective casing. The shape of the spire needed to satisfy several conditions, including being large enough to contain the enclosed equipment and to span the vertical distance from the top of the roof to the prescribed height, satisfy the structural stiffness requirements (the stiffness requirements of the broadcasters were more severe than we otherwise needed to follow; they didn’t want their equipment to move very much at all) and architecturally to work well as an icon for this monumental site and also be an architecturally integral part of the building. While we can consider the entire structure, including the broadcasting equipment, as the ‘spire’, we referred to the enclosing element itself as the ‘shroud’. Factors which were incorporated as parameters into the script that built the model include critical dimensions of the shroud, vertical spacing between lattice nodes and rings, number of nodes in each ring and thicknesses of the members (which could either be consistent throughout the structure or vary).
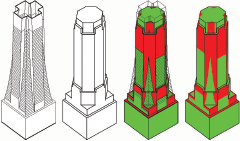
Figure 14.9 Examples of the variable parameters in the model of the spire of the World Trade Center Tower. (Image © SOM.)
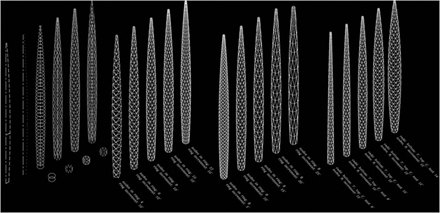
As mentioned earlier, with scripts we can loop through many values of a parameter and create a new model for each value, even create a set of models within a model, which can be extremely useful for comparative analysis (Figure 14.9). Rendered images or even diagrammatical representations of a model are often useful for evaluating the effects of changing values of one or more parameters. We can create representations which most clearly identify these effects and differences (by selecting appropriate views, for example, or colour-coding particular aspects of a model). Sometimes a more tangible representation is desired or required, as in the form of a 3-D printed physical model, or to compare different experimentations with different parameters. Figure 14.10 shows the effect of varying the thickness parameter of the members. While our structural engineers had a lot to say about this aspect, there were architectural reasons for making the members thicker than required in order to make the spire more visible from a distance. If the members were too small, we were concerned the spire would become invisible. Ultimately, the spire was designed not as a lattice but as composed of solid panels, as shown in Figure 14.11.
Figure 14.10 The effect of varying the thickness parameter of the members. (Image © SOM.)

Figure 14.11 The final design of the spire (rendering Ajmal Aqtash). (Image © SOM.)
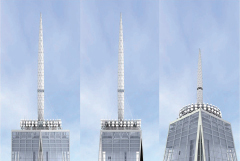
Fairly early in the design process we met with potential fabricators of the spire, to help us determine constraints from the points of view of manufacturing and fabrication (and even delivery and installation). We talked about how large individual panels can be, how they can be grouped together, how beneficial (and cost-saving) minimising the number of different panels is and so on. Within each ‘ring’ there are two types of panels (up facing and down facing) and in our model there are eight of each of these in a ring, but each ring is different from every other ring. We also created a horizontal symmetry plane, so that panels equally spaced above and below this plane can be identical. This had an insignificant effect on the visual appearance of the spire, but reduced the cost. One (very strong) reason for switching to a solid panel spire from a lattice spire is structural – the solid panel spire is stiffer in the wind than the lattice spire – but subsequent analysis showed that it was still not stiff enough. Our engineers gave us a couple of options to address this. One option was perforating some of the panels; they suggested a perforation pattern for the panel itself, and we looked at options for which panels were perforated (to create an interesting and desired architectural effect). The second option was to add ‘helical strakes’ to the spire, vertical ‘fins’ which follow the spiralling edges between the panels. The depth of these fins varies with the thickness of the spire, so at its widest point these fins are very deep, and when the diameter of the spire becomes smaller, the depth of the fin decreases as well (Figure 14.12). The design
Figure 14.12 The depth of the fin becomes smaller as the diameter of the spire decreases. (Image © SOM.)

Figure 14.13 The process of transforming the original image to the perforation pattern of dots. (Image © SOM.)

team preferred this option. The visual effect of these helical strakes, particularly as the sun’s position changes during the day and throughout the year, becomes very interesting.
Project example: Cathedral of Christ the Light, Oakland, CA – Omega Wall
When the bishop voiced his desire to include a strong representational image of Christ in the building, [design partner Craig] Hartman wanted to make it integral to the architecture. As a guide, the church supplied a digital image of a carved stone relief at Chartres Cathedral. A team of architects, environmental graphic designers, and members of SOM’s digital design group worked together to create an algorithm that sorted the pixels according to brightness. The image was tweaked to enhance its legibility before then being mapped onto the 3-D surface. In finished form, the backlit image will rise more than 50 feet high, composed of more than 90 000 holes, ranging in size from 4mm to 24mm, laser cut into the anodized aluminum panels. (Architect Magazine, 2008)
This part of the Cathedral project was done in close collaboration with the graphics department in our San Francisco office. It is always interesting to work with a new group of people, who usually have different points of view, sets of priorities and ways of working. They created the ‘explanation’ of the process of transforming the original image to the perforation pattern of dots, as shown in Figure 14.13. The ‘wall’ is made of large, flat triangular panels which are arranged to create a three-dimensional surface, with a vertical ridge at the front face. The image is projected onto the panels on the wall, and then each panel must be rotated or ‘unfolded’, so that all panels can be sent to the fabricator as a true shape and not a projection, as shown in Figure 14.14.
Figure 14.14 The projected image on the panels on the wall, one mock-up panel. (Image © SOM.)
The fabricator asked us to identify each perforation on each panel with a number and a diameter and circumference. This information was documented graphically as well as in a spreadsheet (one page for each panel, with each hole identified by its number, location on the panel – x and y location from a reference point on the panel – and diameter and circumference). Figure 14.15 show the completed Omega Wall.
Project example: Koch Center/Science Math Technology Building, Deerfield
Academy, Deerfield, MA – skylight
For several of our school projects, we have collaborated with artists. For the Koch Center/Science Math Technology Building at Deerfield Academy in Deerfield, Massachusetts, we collaborated with James Turrell, an artist who works with light and space. We had collaborated with Mr Turrell before and his work seemed particularly appropriate for this building. Because of the nature of his art, Mr Turrell worked closely with an astronomer, Dick Walker. An interesting aspect of the project designed in collaboration with James Turrell and Dick Walker is the ‘analemma skylight’.
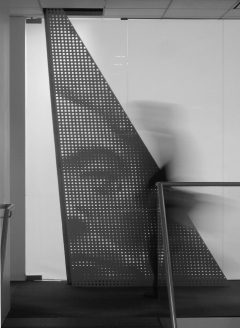
Figure 14.15 The completed Omega Wall. (Image © César Rubio/courtesy of SOM.)

Just outside the auditorium is a common space in the building. Part of the space is three storeys tall. On the ceiling of this space is a hole, six inches in diameter, which is open to the sky (covered with a glass dome). Sunlight comes through this hole and projects a spot on the curved brick wall. On the brick wall there is a curve, etched in metal, in the shape of a tall, thin figure. This curve is called an ‘analemma’. Every day at precisely noon, the spot of light which is projected through the opening will align with this analemma. The original intention was as follows: in the morning the spot will appear on one side of the wall, and as the sun moves during the day the spot will move as well. At exactly noon the spot will coincide with the etched analemma. The spot will continue moving through the afternoon until it disappears. During the summer months, when the sun is high in the sky, the spot of light will appear low on the wall. During the winter months, when the sun is low in the sky, the spot of light will appear high on the wall. During most of the year, the spot will move between the two extremes.
In order to allow the spot of light to come through the small opening in the ceiling surface, the opening in the roof surface must be much larger. To allow the ‘sun-spot’ to appear from sunrise to sunset, or early morning to late afternoon, the opening on the roof surface would need to be impossibly large, which would present too many structural and roofing system challenges. So we limited the time period during which light would be permitted to come through the skylight to create the spot. This became a parameter in the procedure which generated the opening, and we experimented with several different values. We determined that the opening resulting from allowing the sunlight to enter from one hour before noon until one hour after noon was acceptable, and that that time period during which the spot was visible was also acceptable.
Figure 14.16 The projection of the path of the spot of light through the hole in the ceiling. (Image © SOM.)
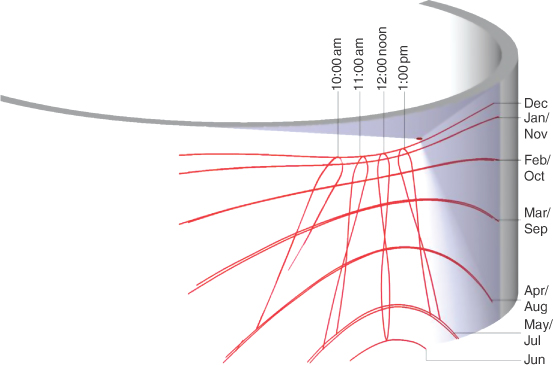
Figure 14.16 demonstrates the projection of the path of the spot of light through the hole in the ceiling. The lines labeled with month names are the path of the spot (if allowed to come through the hole all day) on the 21st day of the month indicated. The line for December is high on the wall, and the line for June is low on the wall, as described above. Lines for the other months seem to almost coincide, for example February and October are almost identical. The dates 21 October and 21 February are symmetrical around 21 December (and 21 June). There are the same number of days between 21 October and 21 December as there are between 21 December and 21 February. If, on 21 October, we were to mark with a piece of chalk the centre of the sunspot every x minutes (5 minutes, 15 minutes, 60 minutes) and then connect these marks, we would create that same line. If, every day of the year at noon, we were to mark with a piece of chalk the centre of the sunspot, we would create the noon analemma. If we were to mark the centre of the spot at 11 a.m. or 1 p.m. instead of noon, we would create different analemmas. In fact, when the building was completed, the noon analemma was not in fact etched in the wall, but the intention was that for one year, the students of the school would do just that – mark the location of the sun every day at noon, and at the end of a full year they would have created the analemma, and then it would be permanently marked in metal.
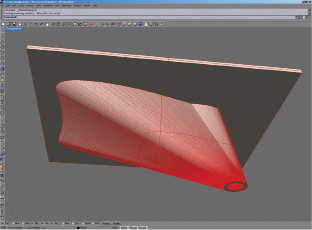
Figure 14.17 STL file needed for the 3-D printing was creating from a Rhino model. (Image © SOM.)
In order to fabricate the skylight, which only admitted the sunspot of light into the space between 11 a.m. and 1 p.m., we had to define the form to be sent to the fabricator, which was computed algorithmically. The function of the skylight was to allow light into the interior space, through the small opening at the base of the skylight, which is in the plane of the ceiling, only within a two-hour time period – from one hour before noon until one hour after noon, throughout the year. The computation of this form used the following parameters: the geographical location on earth of the project (latitude and longitude), the distance between the ceiling and roof planes, the extreme times (11 a.m. and 1 p.m.) and the extreme dates (21 June and 21 December). Changing any of these parameters would result in a different skylight shape. Since the depth of the skylight is fixed, exactly 37 inches (about one metre), the size of the skylight is determined: it is about 3 feet wide by about 8 feet long (about 1 metre by 2.5 metres). It was fabricated in fibreglass.
Because the fabrication of this skylight was expensive, we wanted to be able to test it somehow before it was built. During the time this project was being designed the office acquired a 3-D printer, a rapid-prototyping machine. Our skylight was a perfect application of this technology. We created an STL file for 3-D printing (using Rhino instead of AutoCAD, since people in the office had more experience with STL files in Rhino), as shown in Figure 14.17. Due to the size restraint of the 3-D printer, the model was printed in two parts and then glued together. We also created a model of the space in which the skylight is located, including the floor, ceiling and curved wall. We brought the model to the sight in Deerfield on a sunny June day for the test. Initially we thought we had a problem – the light was first admitted through the opening at 12 noon instead of 11 a.m. – which seemed to be off by exactly one hour. The system is, of course, ‘calibrated’ for Standard Time and the ‘error’ was due to Daylight Saving Time. Knowing this, it worked perfectly.
The examples presented are a very small subset of the projects that I have been involved with at SOM, but are representative of a philosophy of working on architectural projects which I began developing in school, and which has been supported by my firm. That philosophy – perhaps ‘methodology’ is a better term – is difficult for me to articulate clearly (hopefully my examples have done a good-enough job), but is more concerned with investigating methods and processes of solving design problems, and addressing these processes in a very systematic way, than with the specific forms that can result. These methods and processes are greatly enabled by computational power (but sometimes more by simple generic tools than more sophisticated but specific ones) and I believe are most enabled by the algorithmic and procedural thinking process of the investigator.
Because of the nature of our field our studies are three dimensional in form, but this methodology can work for any creative endeavour, including two-dimensional form. In our practice, each project has its own fascinating set of issues to be addressed; articulating (and sometimes inventing) these issues is a fascinating task in itself. We deal with structural issues, sustainability and environmental concerns, economical fabrication and the desire to create iconic and architecturally interesting, exciting, innovative, functional and efficient buildings. We create ways of form-finding, analysis (as an integral part of the design process) and documenting our work. Parametric and algorithmic thinking and modelling have been excellent tools in this work.
The processes that went into the examples shown and many others are shared and distributed in several ways and at several levels. The overall method of working and philosophy is applied to each project that I work on. The hope is, of course, that the approach and method of exploring a design space are the reason I am asked to participate in these projects, but that the result of my participation is often a solution space of choices which meets the design criteria, which is often more important to many than how they were derived.
Some of us in the office are using tools such as Digital Project, Generative Components and Grasshopper. Some tools are better at addressing some design tasks than others, but the biggest factor in deciding which tool to use is usually the comfort level with a tool of the individual who will be performing the task. If the tool is flexible enough, and the person has reached a certain skill level, then any task can be done. And another very important aspect of our work process is possibly that skills and concepts developed in solving one problem are usually re-used to solve similar problems (scripts can be partially or completely re-used as well), even on a different project, by different people or teams and with different software.
All images in this chapter are copyright of SOM. The author would like to acknowledge the following people who took part in the projects described:
World Trade Center Tower One: SOM partners David Childs, design; T. J. Gottesdiener, management; Carl Galioto, technical; William Baker, structures. Senior designers Ross Wimer (first phase), Jeffrey Holmes; project manager Kenneth Lewis.
Cathedral of Christ the Light: SOM partners Craig Hartmann, design; Gene Schnair, management; Mark Sarkisian, structures; Keith Boswell, technical. Senior designers Patrick Daly; Omega Wall Lonny Israel, Alan Sinclair; project manager Raymond Kuca.
Deerfield Academy: SOM partner Roger Duffy, design; project manager Chris McCready. Consultants for analemma skylight James Turrell, artist; Richard Walker, astronomer.
Reference
Architect Magazine (2008). ‘Building the modern cathedral’. February.