Chapter 7: Mapping the Current State (VSM Step 4)
In the two preceding chapters, you learned the purpose of value stream management (VSM) and how to plan a VSM initiative. We’re now going to get into the details of the type of analysis performed during a VSM initiative. Specifically, you will learn how to create value stream maps to describe your current processes. This is Step 4 in our eight-step VSM methodology.
While it may be tempting to jump right in and start work to implement changes to eliminate perceived areas of waste, the problem is that, without proper analysis, your efforts may not get the results you and your VSM team expect. Without a current state value stream map, you may not be aware of the system-wide impacts associated with your current value stream activities. Specifically, we need to document our existing activity flows, order entry system, production control system, cycle times, equipment setup and product changeover times, lot and batch sizes, quality levels, defects, and unsynchronized material and information flows.
In this chapter, we’re going to cover the following main topics:
- Evaluating the current state of Lean practices
- Getting started with mapping
- Beginning the map
- Creating an Information Technology (IT) value stream map
With the instructions provided in this chapter, you will have the ability to create a current state value stream map in virtually any type of value stream. Moreover, the continuous integration/continuous delivery (CI/CD) use case employed in this exercise will help you visualize how to use value stream mapping to assess your software development-oriented value streams.
Evaluating the current state of Lean practices
In classic business process analysis techniques, a common practice is to analyze the current way things are done (as-is state), then assess areas for improvement to achieve a desired future state (to-be state), conduct analysis to understand the full scope of work to make the desired changes (gap analysis), and finally create and execute a transition plan. You will find that VSM practices follow a similar pattern. This chapter introduces how to use value stream mapping to assess the current as-is state of our CI/CD activities from a Lean-oriented perspective.
As noted previously in Chapter 4, Defining Value Stream Management, the concept of value stream mapping has been around for a while. However, it is primarily attributed to an analytical approach used at Toyota, referred to as materials and information flow mapping. As the term materials and information flow suggests, value stream mapping provides a graphical technique to simultaneously model the flow of materials and information across value stream activities. But before we get into the details of value stream mapping, let’s first understand how this technique differs from other business modeling techniques.
Contrasting business process modeling techniques
Those involved in business process improvement (BPI) or computer-aided systems engineering (CASE) tools are probably familiar with business process modeling techniques. For example, the Object Management Group® (OMG®) Business Process Model and Notation (BPMN) specification is a standard specification for business process modeling within the IT community.
Other standards for process modeling include activity diagrams from the Unified Modeling Language (UML) and the Integrated DEFinition for Process Description Capture Method (IDEF3). The UML was initially created by Rational Software but is now an OMG standard, while the United States (US) Air Force developed IDEF3 under the Integrated Computer-Aided Manufacturing (ICAM) program. Additionally, IT specialists may also be familiar with various workflow modeling tools and techniques, such as the Web Services Business Process Execution Language (WS-BPEL), which is often shortened to simply BPEL. BPEL is a standard executable language for specifying business process actions within web services.
With so many formal standards for modeling business processes, you may be wondering why we need a different standard for modeling Lean business practices. The answer lies in the focus of each type of modeling technique.
Value stream maps provide a high-level view of the flow of information and materials and provide an ideal infographic design to document, communicate, and ultimately eliminate waste that affects efficiencies and an organization’s ability to deliver customer-centric value. As its name implies, value stream mapping forces an organization to isolate activities that add value from other activities and wasteful practices accumulated from bureaucratic bloat. The overall objective of value stream mapping is to identify and eliminate waste that hinders productivity—from ideation through the delivery of products and services—and hinders an organization’s ability to deliver customer-centric value.
Another important aspect of value stream mapping is to provide a vehicle for visual collaborations among VSM and value stream team members and other stakeholders. The maps allow participants to communicate their understanding of the current operations better and later assess and communicate alternative change scenarios.
In contrast, business process improvement and workflow-oriented process modeling techniques focus on identifying the coordination of workflows with detailed information on data and data flows as part of a business process automation effort. BPMN is a classic approach to facilitate BPIs via software applications. In contrast, BPEL is a modern approach to model and improve business process data and information flows via web-based applications.
Business process models provide detailed visual displays of the interactions of technical and organizational activities in cross-domain and cross-function business environments, underscoring complex interactions and decision points. Business process models are often used to support business process reengineering and improvement activities and create business systems to automate those improvements.
In other words, standardized business process modeling techniques used within the IT community and BPI analysts focus on modeling business processes to automate them. In contrast, value stream mapping techniques model the flow of work and information across value streams to eliminate waste as part of a Lean improvement initiative.
As a quick side note, in the early-to-mid 1990s, as the product manager leading the CASE tool and workflow strategies at AT&T Global Information Solutions (AT&T GIS), I worked with Gloria Gery, the author of the book titled Electronic Performance Support Systems (Gery, 1991). Our collaborations’ objective was to ensure the Electronic Performance Support Systems (EPSS) built by our professional service organizations supported the needs of both the expert and the novice practitioners of our customers’ business processes.
One of the biggest concerns I had then, and still have today, is that too many business systems do not help support the flow of work from a value stream perspective. For example, suppose your business system does not help enforce the desired to-be state of both work and information flows. In that case, you will have difficulty achieving the goals and objectives of your VSM initiatives.
The automation of business processes is not inconsistent with Lean practices, as you will see in the next section. So, both types of modeling—a mix of value stream mapping and process modeling—are essential to achieve the broader efficiency goals of the VSM initiative.
Automating business processes
It’s not inconsistent in Lean practices to employ process modeling tools (especially BPEL) to automate business processes, as such activities are consistent with the Toyota Production System (TPS) concept of Jidoka, a.k.a. autonomation. But it also makes no sense to automate a business process until and unless we know it’s efficient and value-adding.
True—it may be possible to employ automated and digital information systems, perhaps as a mix of commercial-off-the-shelf (COTS)-based solutions, to make our processes more efficient. But the danger of moving too fast is having a process that is so mismatched in throughput or hiding defects, or bloated with non-value-adding work, that we end up automating waste. Moreover, even COTS-based solutions often require a high degree of customization to implement business processes that make the organization efficient, value-adding, and competitive.
Having laid this groundwork, let’s get started with our value stream mapping exercise.
Getting started with mapping
For this section, let’s assume your organization and VSM team are fully primed and committed to Lean practices. You’ve also chosen your value stream and have learned the fundamentals of Lean practices. Now, it’s time to start doing the work to begin your transition to a Lean enterprise. There’s no reason to delay any further. In the immortal words of Taiichi Ohno:
Since this is a book on VSM driving development-operations (DevOps) capabilities, our examples follow Lean improvements across the continuous integration (CI) and continuous delivery (CD) sections of an IT value stream. As you learned in Chapter 5, Driving Business Value through a DevOps Pipeline, CI/CD practices are a subset of a more extensive DevOps pipeline. Therefore, our CI/CD VSM use-case example aims to simplify the scope of analysis to focus on employing VSM methods and tools.
Don’t forget that DevOps is a critical enabler of virtually all value stream improvements in a digital economy. Nevertheless, the principles and techniques presented in this book apply equally well to all VSM initiatives, regardless of the value stream undergoing improvements.
One final note: please take a moment to review the VSM Storyboard in Appendix B. It is the primary tool for documenting both current and future state value stream mapping activities.
Building a value stream mapping icon standard
An essential component of value stream mapping is sticking to specific icons to describe your value stream system elements—for example, Figure 7.1, which you will see shortly, shows the most common value stream mapping symbols as icons. Of course, your organization or VSM team may elect to use other icons. That is OK, as there is no definitive standard body governing the iconology of value stream mapping.
However, make sure everyone fully understands the definition of the icons used in your value stream maps, and do not allow people to create non-standard icons without appropriate agreement and communication. Without standards, communication and understanding quickly deteriorate among VSM team members and other stakeholders who review the maps. The value stream mapping icons used within this book are organized into separate categories, as identified in the following list:
- Process: Identifies work activities spanning customers and suppliers, dedicated and shared processes, activity work cells, and data boxes to show critical information and metrics.
- Materials: Indicates how materials are handled at various stages of the value stream, including inventories and buffer stocks, and production control strategies such as supermarket, pull, and First In, First Out (FIFO).
- Shipment: Includes all identified mechanisms for transporting materials, parts, and products, including air, forklift, truck, boat, or ship. But your organization might also include transport icons to show movements conducted by rail, automated lines, robots, or third-party shipping companies.
- Information: Capture metrics to inform our current state (as-is) and desired future state (to-be) analytics and provide information to support the flow of work across our development and operational value streams. The icons displayed in Figure 7.1 indicate information gathered from several sources, such as the following:
a) Gemba (go to see) activities or verbal communications
b) Information maintained in enterprise resource planning (ERP)/materials requirement planning (MRP) systems
c) Information from production control data or strategies
- Value stream map: Used to show specific points in the value stream where the team wishes to point out specific areas of interest on the map, such as Kaizen burst (that is, a Rapid Process Improvement (RPI) initiative requirement) operators, timeliness, or quality problems.
- Kanban arrows: Show the flow of materials and information across shipping and production processes. Note that straight arrows typically indicate push-oriented product control strategies, while curved arrows indicate pull-oriented strategies. Kinked arrows indicate electronic information flows.
You can see the most common value stream mapping icons in the following screenshot:

Figure 7.1 – Common value stream mapping symbols
Note that the common value stream mapping symbols shown in Figure 7.1 contain 41 standard Lean icons used throughout this book. The graphic displays symbols across the previously identified seven VSM icon categories.
Every VSM tool provider provides a value stream mapping tool with its own set of icons. While most modern VSM tools have a value stream mapping capability, many graphical tools offer easy-to-use graphical user interface (GUI)-based tools with predefined icons to map value streams, often at a considerably lower price.
The VSM team can map the work and information flow across their target value stream with the standard set of value stream mapping symbols. However, another step precedes mapping, and that is gathering data to understand the flow of work and information across the value stream’s activities.
The level of understanding required to create an accurate value stream map won’t come from reading specifications and documentation. Instead, they must walk the floors, meet with the people doing the work, ask lots of questions, and see for themselves how work and information flow across the value stream.
Going to see (Gemba)
The current value stream mapping exercise’s primary objective is to identify the activities that add value while eliminating those that add waste (Muda). Therefore, before starting the current state mapping exercise, our VSM team must go to see (Gemba) and understand how the value stream operates before mapping and recommending changes.
Some books make it appear that a Gemba walk is a simple one-time event. That’s unfortunate because one tour of a value stream will not get the job done. For example, as a young manufacturing and industrial engineering project manager at Texas Instruments, I spent a much larger portion of my time out on the shop floor than I did at my desk. My job involved planning and guiding three large factory improvement programs involving two geographically separated manufacturing facilities. The production information I needed was not at my desk; it was out on the shop floor and mainly in the heads of the people performing the work.
The Gemba and current state mapping activities provide insights into the waste areas that hinder material and information flows. Another way to think about waste is that it almost always leads to further administrative overhead and processing time. Our focus always has to be on the customer, and such administrative tasks are mostly overheads and non-value-adding.
There are three fundamental rules when practicing Gemba, outlined as follows:
- Go and see what’s going on for yourself.
- Ask why multiple times to get to the root cause of an issue (that is, 5 Ws or 5 Whys).
- Respect people: Your job is to help resolve problems, not find faults.
When VSM team members conduct Gemba walks, they need to do so in an organized fashion. The following steps outline a sensible Gemba Walk strategy:
- Identify goals and objectives.
- Let the value stream team know you are coming and the reasons for the visit.
- Go as a team of two or more VSM team members.
- Follow the value stream’s flows.
- Focus on identifying issues with value stream processes and work activities, not people.
- Document findings.
- Ask questions—that is, 5 Ws (who, what, when, where, and why) or “Why” five times to fully understand problems and identify root causes.
- Listen—don’t recommend changes in the initial walks. Your goal is to learn.
- Follow up with the value stream employees at a later date with your observations and recommendations.
- Gemba again to confirm the results of implementations and improvements.
- Gemba again to start the new Kaizen improvement cycle.
A synchronized and organized value stream virtually automates itself from the perspective of flow. There is a natural and straight-line order to the flow of work in a well-organized value stream. Information and materials flow without impediments or bottlenecks. The correct information and materials are immediately at hand when needed, and not before or after. That is the idealized future state. Use your Gemba walks to identify the areas and reasons why these things are not happening in the current state.
Finally, the VSM team must understand the need to collect accurate and real-time information on actual work activities and information and material flows, whether the existing activities are value-added (VA) or full of waste. Failure to document all unsynchronized flows and waste makes it impossible to evaluate the value stream as a holistic system. Furthermore, without a holistic view of the value stream as a system, it is impossible to understand the dynamics that affect its performance.
Starting our map with the customer in mind
Start your current state mapping exercise from final customer deliveries and work your way upstream (backward) through the various processes. Remember—the goal is to deliver a product, service, or result that your customer wants. Your VSM team runs the risk of missing how beginning or mid-stream activities negatively impact value delivery if you don’t start your current state assessments without the customer’s needs and expected outcomes in mind.
The following diagram graphically depicts how value flows downstream to the customer:

Figure 7.2 – Value stream maps start with the customer
In traditional process models, we tend to start with the first activity and work our way forward, mapping workflow across activities and work locations. In value stream mapping, we collect data from the point at which the customer receives value and then work our way backward (upstream). At each step, we ask ourselves whether the current activity is aligned with our customers’ needs or is adding waste in some form.
The order of analysis doesn’t mean we plan to resolve issues of waste in that order. Instead, the VSM team must prioritize improvements in terms of the highest-value impacts. We’ll get to that subject in Chapter 9, Mapping the Future State (VSM Step 6), but for now, it’s essential to know that there are several reasons for mapping our way backward through the value stream, including the following:
- It keeps the focus on the needs of the customer.
- It orients our minds to think in terms of pull-based flows.
- We can better work our way through complex flows in production environments having multiple assembly branches.
The later issue, managing multiple branches, creates a bit more complexity in terms of managing flows. In push-oriented production scheduling systems, it’s nearly impossible to synch the materials’ flow to be available when needed and avoid queuing and waiting. However, as you will find out in Chapter 9, Mapping the Future State (VSM Step 6), it’s much easier to prevent bottlenecks with pull-oriented production schedules and Just-in-Time (JIT) material and information deliveries.
Here, you can see a value stream map with multiple branches:
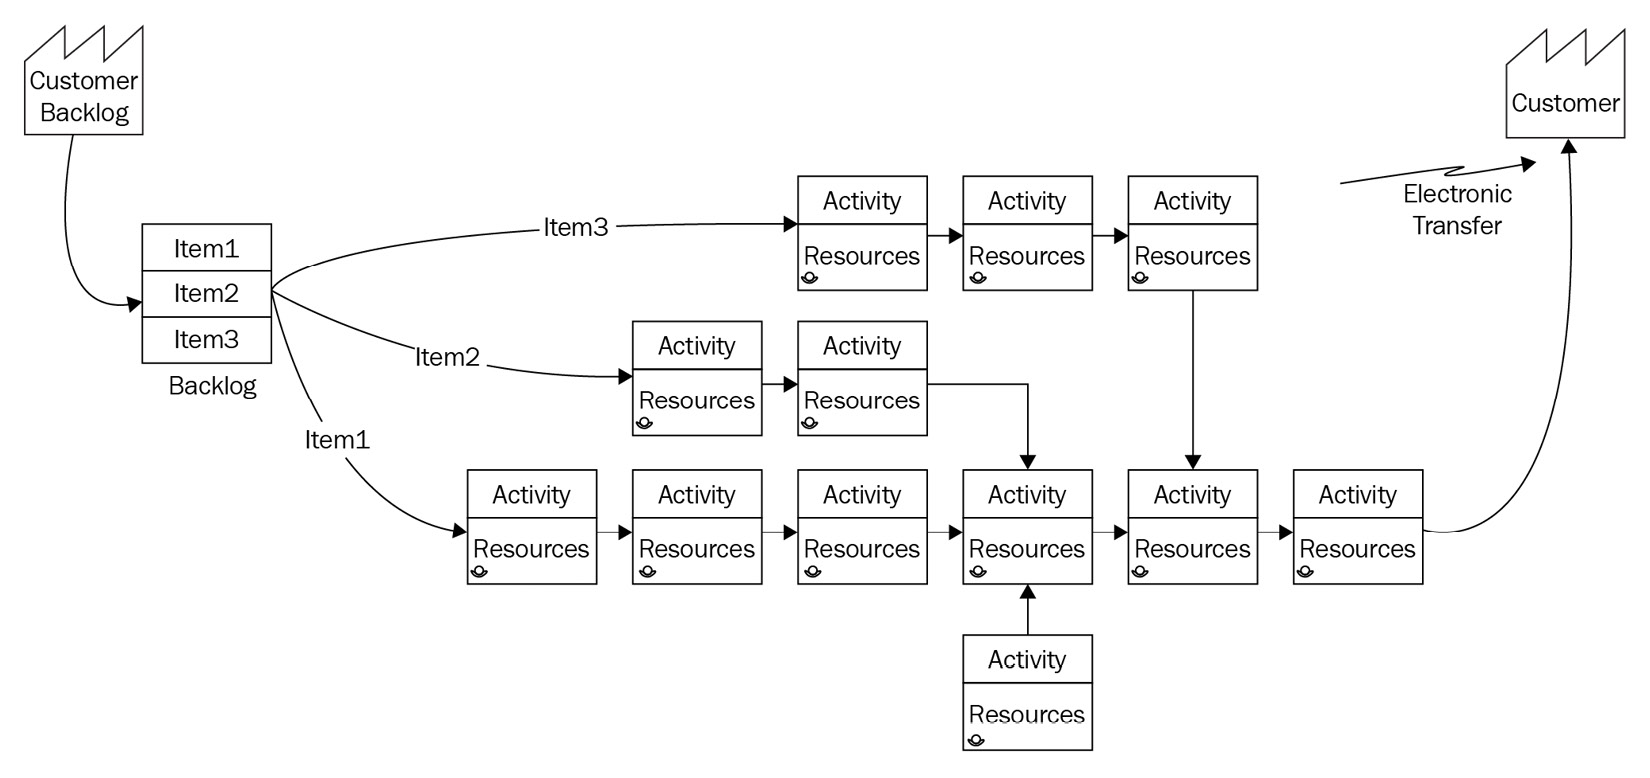
Figure 7.3 – Value stream map with multiple branches
Now that we understand that we need to start our VSM maps with our customers in mind, let’s understand what we need to do to prepare for the current state mapping exercise.
Preparing to map
You’ve already learned the essential steps of Gemba to collect information for your current state map, but let’s take a closer look at the preparation work required before the current state mapping exercise. There are four common steps the VSM team can take before mapping, outlined as follows:
- Determine VSM team member assignments
- Draw a rough sketch of the value stream flows
- Begin your Gemba exercise
- Discuss the data
The VSM team needs to assign individuals to specific roles that streamline their data capture and mapping activities in any current state mapping exercise. While the VSM team can use an electronic tool or flip chart to create their maps, it’s better to start with an erasable whiteboard. You’ll update this regularly throughout the exercise, and a larger whiteboard is more manageable for everyone to get around to see and participate in the discussions. It’s also helpful to either assign someone as a scribe or, better yet, rotate that role among the team members.
Someone else needs to be responsible for facilitating the mapping activity, keeping folks focused on the goals at hand, and monitoring the time. Teams find it easier to focus their attention and accomplish the work if they keep to a schedule and have time for breaks—more time can be scheduled later to come back and finish up the work, if necessary. And it may even be beneficial to allow time between mapping updates for the team to rest and reflect on the work they have completed and review the map to identify any information they may be missing.
We also need someone to act as a timekeeper during the Gemba walks. Their responsibility is to record the cycle and changeover times for the value stream’s activities, as observed during their Gemba walks. They should also record other important information discovered during the walks, such as issues, causes, effects, delays, or other waste areas discovered during the walks.
Let’s stop for a moment to discuss the nature of creative work versus standardized work. Developers who create software architectures and designs and who write code perform creative work. No two business requirements are the same, and the developers must think through the work involved to design an appropriate approach. In contrast, standard work includes repetitive tasks that should not significantly vary in a controlled environment.
Standardized work is the whole point of Lean, eliminating waste and thereby improving the predictability of outcomes. Unfortunately, standardized work practices are often frowned upon in Agile practices, as many Agilists do not want to be bound to specific ways of doing things. But there is added risk when an organization attempts to build and maintain continuous flows across CI/CD and DevOps pipelines, or any other Lean value stream, without standardized methods and tools.
For example, suppose we’ve spent the time, effort, and money to design streamlined value streams, including procurement of tools. In that case, we should not haphazardly make changes without thoroughly assessing our needs and objectives and assessing the potential negative consequences of changing our activities and flows. VSM is the appropriate approach to evaluate ongoing improvements across our Lean enterprise.
Whether using Agile or Lean concepts, we still want to maintain a production flow that matches our takt time. In other words, ideally, our production rates (Takt) match our customers’ demand rates. The one area where this is challenging is in the frontend of the software development life cycle (SDLC), where the product owner and the team identify, prioritize, and refine requirements. Next, the software team must evaluate the work involved to design and implement the requirements as software features and functions. Finally, there is a creative nature to product backlog refinement that makes it more challenging to predict work scope and duration.
Once a work item enters the development cycle as refined tasks, the flow of work can follow a standard set of time-bound activities that are reasonably standardized and predictable. However, it’s much more challenging to force arbitrary time-bound restrictions on a product backlog refinement’s creative endeavors. Instead, the best strategy to improve design-related work predictability is to break the initial high-level requirements down into the smallest bites possible.
Microservices-based architectures decompose requirements at the smallest level of scale to describe unique business services at their most granular level. Besides better design predictability, other benefits from microservices-based architectures include the ability to create highly maintainable, testable, and independently deployable units of functionality as loosely coupled business services.
The objective of drawing a rough sketch of the current state map before Gemba walks is to make sure the VSM team members understand the work within the value stream. Therefore, it may be helpful to have someone familiar with the value stream guide this effort.
The rough map helps improve the VSM team’s understanding of the value stream activities before a Gemba walk, making their time on the walks much more effective. Moreover, the draft drawing helps the team later identify the value stream areas that do not reflect their original expectations of how the process should work.
When a team begins their Gemba walk, they should be prepared to capture the following information:
- Total work time per shift or day
- Planned downtimes and breaks within the value stream
- Available time to actually perform work
- The number of employees and contractors or partners supporting the value stream
- Quantity of work performed by each value stream worker
- Frequency of delivery for each activity within the value stream
- Cycle time for each activity, from start to finish
- Waiting (queue) times and quantities at each value stream activity
- Any exceptions to the standard processes
- Other relevant information items unique to the value stream
Before they begin Gemba walks, the team should respect the value stream workers’ time and efforts. As a matter of courtesy, the VSM team members need to seek out the value stream managers’ approval and plan their walks around the VA managers’ and employees’ schedules to minimize their work impact.
Take time to communicate where you plan to conduct your walks and what you want to accomplish. Then, when you show up for the Gemba walk, make sure you and your team members introduce yourselves and remind the team of the purpose of your visit. Answer their questions honestly, and don’t hold back on explaining the objectives and benefits of Lean production practices.
Remember that you need to get their buy-in to support your efforts. While you are walking the area, be respectful of the workers’ time and their work areas. Above all, remember that they are the experts in the work performed in the value stream.
The VSM team can now begin their Gemba walks. The VSM team members should not attempt to analyze the data they collect until they return to their meeting room. That will only take valuable time away from the value stream’s workers and hinder the VSM team’s data gathering objectives. There will be plenty of time to reflect on and analyze the data after the Gemba walks.
Now that we’ve conducted our Gemba walk and returned with the data, it’s time to begin our current state mapping exercise.
Beginning the map
So far, you have performed the following steps to prepare for the current state mapping exercise:
- Determined customer needs and priorities
- Put a value stream mapping plan together
- Assigned roles and responsibilities
- Conducted information-gathering Gemba walks
- Developed a rough pre-draft of the current state map
Now, it’s time to use this information to put our current state value stream map together. Again, use a large whiteboard or poster board for this purpose, and use erasable markers or pencils, as the case may be, so that you can correct any errors or omissions. Again, you can use a software tool to create your maps, but make sure you have a large enough screen for everyone to gather around and see.
While digital VSM mapping tools make better-looking and easier-to-read drawings, they can also slow the mapping process down, though some tools are easier to use than others. It may make more sense to create a manual drawing until the team is ready to show and distribute their work. The team needs to use their judgment to decide which approach works best for them.
Drawing the current state map in eight steps
There is no single best approach to drawing a value stream map. However, it’s best to have a common strategy to guide the process from start to finish, ensuring nothing is left out. With that goal in mind, the following eight steps, applied in this order, provides a practical approach to current state mapping.
- Draw customers and suppliers: Identify external or internal customers who provide requirements and receive the deliverables. Note that in Figure 7.3, the map identifies the product backlog from the customer’s perspective. Also, note that Figure 7.3 shows the customer icon twice, which isn’t necessary. In this case, using the icon twice—once for requirements and the other time for delivery—indicates that the product backlog contains all customer requirements, while the deliverables go to specific customers. Finally, identify any suppliers, contractors, or partners who contribute materials, products, or parts to the value stream.
- Draw the entry and exit activities: In an IT development-oriented value stream, the entry point might be the backlog refinement or identifying of Sprint goals. In contrast, the exit point might be a deployment activity. Since activities represent work, a good practice is to use verbs and verb phrases when naming your activities. Also, since our activities’ expected outputs are tangible things— in the form of products, services, or results—a good practice is to use nouns and noun phrases to name the outputs.
- Draw all activities between entry and exit processes: While you initially collected your data from the customer backward, you can map the activities starting with the furthest downstream (that is, from left to right). This approach makes it easier to depict the flow of work graphically. Make sure to use activity boxes with segmented fields to record essential data, such as cycle and changeover times, waiting times, resources, lot or batch size, defects, and other essential details.
- List all activity attributes: These include lead times, cycle, changeover times, waiting times, resources, lot or batch size, defects, and other essential details.
- Draw queues and waiting times between activities: Use separate icons to indicate the type of queues, such as waiting materials, safety stocks, buffer stocks, and anticipation inventories. Waiting materials are queues that form between work cells due to mismatched production rates. Safety stock is a store of materials to ensure we can continue to work during unanticipated material shortages. Buffer stocks help hedge against customer-induced variations or spikes in demand. Finally, anticipation inventory includes finished goods kept on hand to support expected spikes in demand, such as holiday demands.
- Draw all communications that occur within the value stream: Use different arrow types to indicate whether communications involve verbal, mail, or electronic information flows.
- Draw push or pull icons to identify the type of workflow: Use straight arrows to indicate push-oriented flows. Use circular arrows to indicate pull-based flows. Use different arrow types to indicate external shipments of materials and products versus the value stream’s movement of materials and products.
- Document all other collected data: Use the value stream storyboard shown in Appendix B to illustrate the type of information you may need to collect— that is, date of the map, value stream name, VSM champion, team members, problem categories, and other important activity- and flow-related information.
It may be tempting to move through the current state map exercise quickly—but don’t. The team will make mistakes and omissions that can later impact the team’s credibility and the accuracy of their future state maps and recommendations.
Also, don’t be tempted to apply existing information on standardized practices within your current state value stream maps, such as shop processes or guides. Those sources typically represent an idealized approach and expected metrics, but may not be indicative of actual practices. Again, this issue is why we use Gemba to go and see for ourselves.
Creating an IT value stream map
VSM has become a critical capability to implement and improve Lean practices across IT-related value streams. Commonly, organizations that employ VSM methods and tools may have already established Agile practices and perhaps implemented CI/CD toolchains. But now, their goal is to move to implement CI/CD practices as Lean pipelines. The VSM team’s primary goals are improving collaborations and synchronizing information and workflows across development-oriented value streams.
None of those activities guarantees the IT department has taken the effort to eliminate waste from the customer-centric perspective of Lean. However, VSM helps us do just that. Also, for this mapping exercise, assume executive management working with the VSM team has selected a software development program as its targeted value stream for improvement.
More precisely, in our examples of using the standardized eight-step VSM methodology for this book, we assume the organization has one or more software development teams using Agile practices and purchased toolchains to implement CI/CD capabilities. We do not assume any efforts to integrate or automate SDLC processes using the purchased tools.
Additionally, our corporate executives have approved or even mandated DevOps practices, but may not completely understand the issues involved in executing such a significant value delivery transformation. The resolution of that issue is beyond the scope of this CI/CD use case, but we address this in Part 3 of this book, Installing DevOps Pipelines to Compete in Our Digital Economy.
Before they begin their work, the VSM team members must receive all the instructions in Lean practices—assuming this is their first VSM initiative. After receiving their Lean training, the team meets again before conducting their current state mapping exercise to prepare for the mapping exercise. As part of that preparation, they assign roles and responsibilities and develop a rough sketch of the IT development processes they expect to see. Finally, they conduct Gemba walks to collect the necessary data.
At this stage, the VSM team discusses the data they have uncovered and constructs their current state map. During the mapping exercise, the team discusses the data and builds their current state map over several meetings. They may have also conducted additional Gemba walks to collect more data and verify previously collected data that later seemed incomplete or inaccurate.
Documenting our Gemba walk findings
Before we start drawing the current state map, we need to gather sufficient information for our map. For our example, the VSM team must document the following activities, from front to end of the program’s IT value stream:
- Planning: Tasks include user story refinement, updating backlog priorities, conducting architecture and design reviews, making team assignments, and updating release schedules.
- Coding: Tasks include developing tests, developing software code and configurations, checking in the source code under version control to the source code repository, performing static code analysis, and conducting automated and peer reviews of code.
- Building: Tasks include compiling code, conducting unit tests, reviewing code metrics (size, complexity, coupling, cohesion, and inheritance), building code containers or packages, preparing or updating deployment configurations, and monitoring dashboards. However, the VSM team notes that the build process varies significantly, depending on the programming language and tools used.
- Testing: Tasks include—but are not limited to—smoke/build verification, regression, performance, load, stress, user interface (UI), end-to-end (E2E), and systems testing, and—depending on needs—perhaps other unique tests.
Tests can be executed manually, or preferably by running automated testing scripts to provision the servers and initiate the tests. Ideally multiple tests run in parallel on separate test servers or containers. But that’s a future state concern. Instead, the VSM team needs to learn how the IT organization sets up their testing environments, the types of required tests, and how the development teams conduct their testing activities for the current state map.
- Merging: Tasks to create branches and push, pull, and merge code in the source code management (SCM) repository.
- Provisioning: Tasks include setting up or updating the infrastructure configurations to include, as appropriate, development/engineering, quality assurance (QA)/test, staging, and production environments.
As the VSM team conducts their Gemba walks, they note that the development team re-executes their smoke tests on all new testing instances, including staging and production environments. Their objective is to verify that the latest software installations are stable and conform to all acceptance criteria.
- Deploying: Part of the formal release process, and includes tasks to prepare the release notes, plus decisions to freeze the code, configurations, and features, plus the development of system administrator (sysadmin), user, and process guides and training aids (as necessary).
- Operating: Tasks include monitoring performance and security through dashboards and error logs. The monitoring tools usually include capabilities to trigger alarms when the networks, servers, or applications become unstable, fail, or malfunction in prespecified performance and security metrics. Security information and event management (SIEM) is another critical component of operations monitoring.
During their Gemba walks, the VSM team also notes that the operations department has implemented Information Technology Infrastructure Library (ITIL)-based practices for IT operations management (ITOM) and IT service management (ITSM). However, for the initial VSM engagement, the team has elected to focus on documenting the development team’s IT value stream work and information flows to improve their CI/CD pipeline flows.
The VSM team plans to address the operations-oriented team’s work and information flows later. The current issue is that the development and operations teams are not operating as an integrated IT value stream. Though the implementation of DevOps capabilities as a strategy is a stated objective of the organization’s executive management team, the VSM team decides that value stream improvement work is beyond their approved scope and requires a separate charter.
As the VSM team observes these activities, they monitor and record activity lead times, VA time, mean time between failures (MTBF) and mean time to recovery (MTTR) times, and the percent of activity-related work that is complete and accurate at each value stream stage. In addition, the VSM team has observed work and information flows across the value stream and documented exceptions to the IT organization’s standard software delivery process.
Mapping the IT current state value stream
For this section, please turn to Figure 7.4, displaying the final picture of the VSM team’s current state IT value stream map.
Note that the IT value stream map in Figure 7.4 includes monitoring activities, which is fundamentally an IT operations-oriented task. The VSM team elected to show the monitoring activities as a source of information and backlog items for the product backlog. The product backlog is shown as an activity to document the refinement process, but you could show an inventory or waiting queue of desired customer backlog items.
The current state map depicted in Figure 7.4 seems relatively detailed and complex; however, it’s not that detailed. The information provided is relatively high-level, and the VSM team would need to expend additional efforts to decompose these activities further.
For example, Karen Martin and Mike Osterling, in their book Value Stream Mapping, depict the change request (CR) process within a Scrum-based IT development organization, which is a tiny subset of the overall IT value stream. Their current state map for the CR process includes ten distinct activities and six information systems to manage work and information flows (Martin, Osterling; pages 181-186, 2014).
Take a moment to review Figure 7.4, shown next, including the metrics that the VSM collected. LT (denoting lead time) is a measure that sums both the cycle times and waiting times at each activity within the value stream. In contrast, VA is the amount of time the developers perform the work associated with the activities, enhancing the value of the work items across each activity. Finally, %C/A (for percent complete and accurate) is a metric for the percentage of work items that pass through this activity without having to come back for rework of some sort:
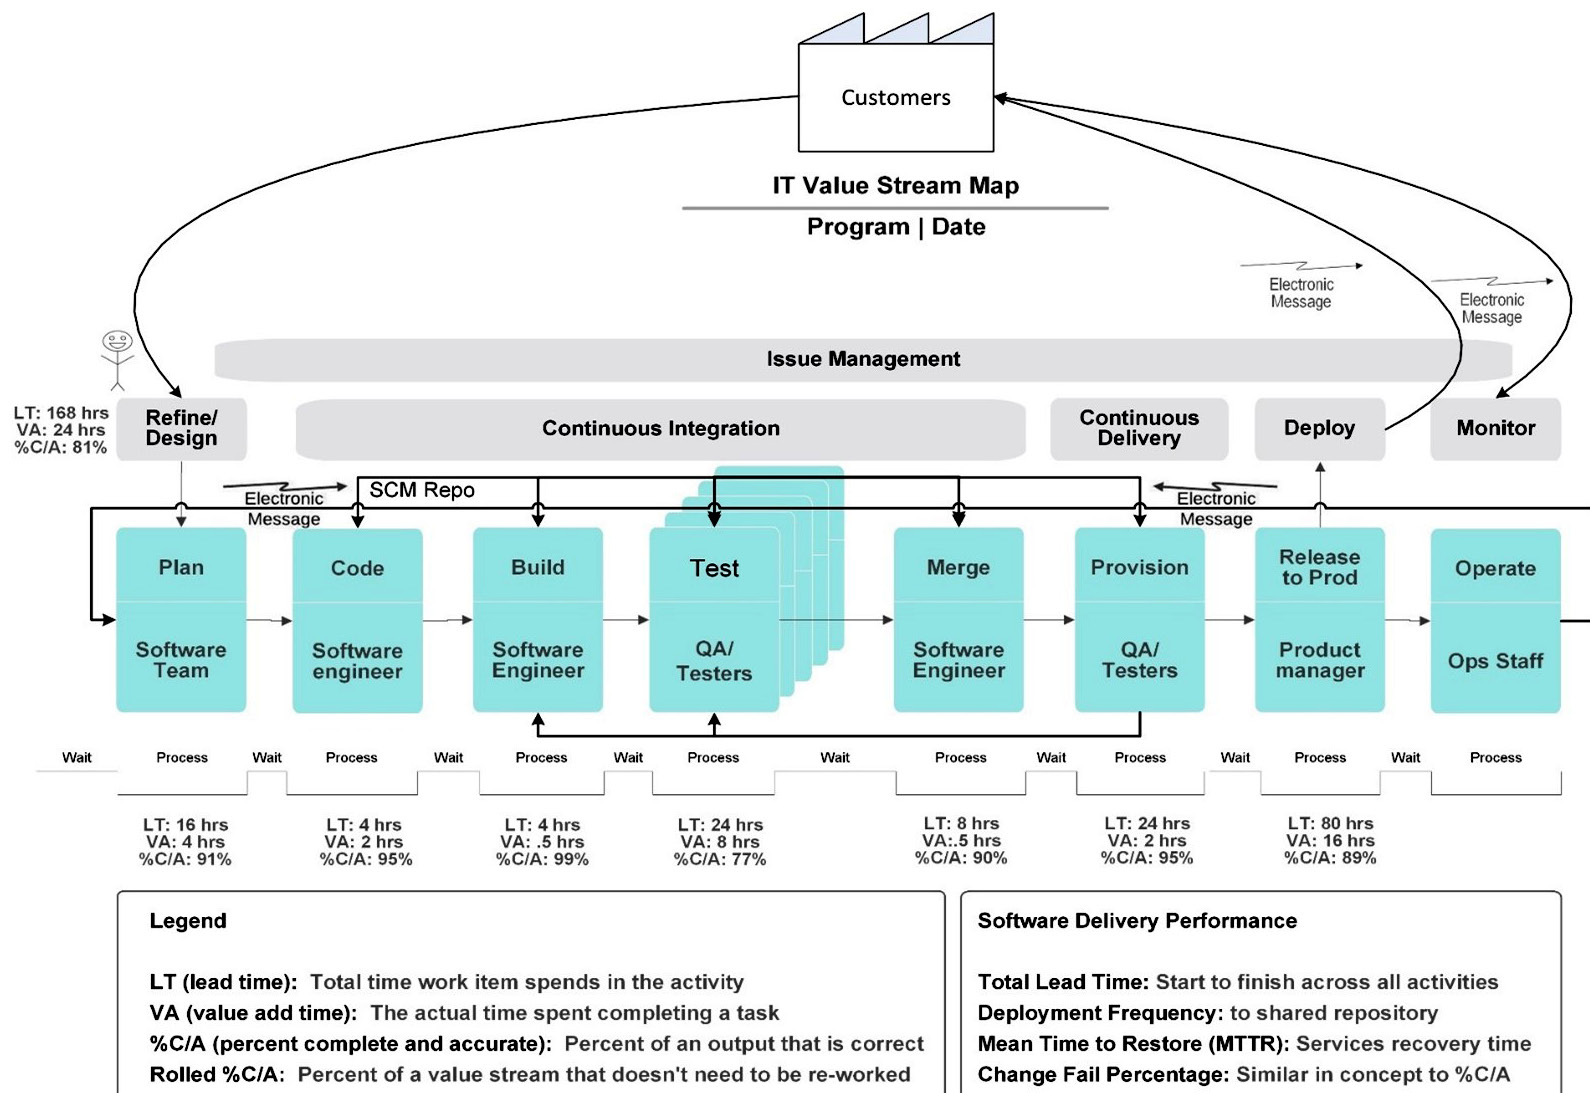
Figure 7.4 – DevOps value stream map
These are the standard Lean metrics monitored across any type of Lean improvement initiative, but there are many more. The following section takes us forward to Step 5 in the VSM approach to Lean improvements—Identifying Lean metrics, but before we get to that section, let’s take a moment to review the tools we used in mapping the current state.
Mapping the current state – tools
This section summarizes the tools used in current state mapping, most of which we have already identified in this chapter—for example, the tools used for current state mapping include the value stream mapping symbols identified in Figure 7.1. You also need a large poster board or whiteboard so that everyone can view the information and participate in the mapping exercise. As shown in Appendix B, a value stream storyboard is another vital tool used to record value stream data and your current value stream map. Whiteboards are best for team collaborations, but a value stream storyboard provides a more permanent record of VSM mapping activities and analysis.
Before heading out to perform your Gemba walks in the value stream work areas, your team should develop a checklist of activities and key metrics (that is, attributes) that you wish to record. Then, your team documents the metrics directly on the value stream map. A good strategy is to develop a bullet list of activities and related attributes to record the information you uncover during your Gemba walks.
When you and your VSM teammates get back from your Gemba walks, you can begin to draw your current state map.
This section introduced another eight-step mapping process as a tool to draw your value stream map and document critical attributes and activity information, completing our discussion on conducting a current state value stream mapping exercise, the fourth step in our VSM methodology.
Summary
In this chapter, you learned how to create a map of the current state of a value stream to evaluate work and information flow from the perspective of Lean production concepts. You also learned how value stream mapping differs from other process modeling concepts such as UML, IDEF3, and BPEL.
As part of the mapping exercise, you learned how to employ a standard set of Lean symbols as graphical icons. This strategy aims to simplify your value stream maps while also ensuring others understand what the map indicates.
Perhaps the most crucial aspect of mapping is getting valid information, which has nothing to do with constructing the map. In this chapter, you learned how to employ Gemba walks to see what is going on in work locations for yourself. In addition, you learned that the operators who perform the work are your best sources of information on how work is performed and for ideas on improving the flow of work and information.
In the next chapter, you will learn the value of using metrics to analyze a value stream’s performance, both in the current and desired future states.
Questions
- Why is it not recommended to jump straight into mapping the desired future state of a value stream?
- How does value stream mapping differ from process modeling techniques?
- Why shouldn’t we automate a business process until we have made improvements to work and information flows?
- Once the VSM team, value stream operators, and other critical stakeholders learn Lean processes, is there anything else they should do before executing their VSM plan?
- What is the reason for having a standard set of symbols and icons for value stream mapping?
- Collectively, what is the purpose of conducting Gemba walks as part of value stream mapping?
- What are the three fundamental rules when practicing Gemba?
- In which direction do you start to draw your current state map, and why?
- In which order does a VSM team implement Lean improvements to a value stream?
- What are the eight steps to draw a current state map?
Further reading
- Gery, G. (1991). Electronic Performance Support Systems. How and why to remake the workplace through the strategic use of technology. ISBN 978-0-9617968-1-5. Weingarten Publications, Inc. Boston, MA.
- Tapping, D., Luyster, T., Shuker, T. (2002) Value Stream Management. Eight Steps to Planning, Mapping, and Sustaining Lean Improvements. Productivity Press. New York, NY.
- Tapping, D., Luyster, T., Shuker, T. (2003) Value Stream Management for the Lean Office. Eight Steps to Planning, Mapping, and Sustaining Lean Improvements. Productivity Press. New York, NY.
- Tapping, D., Kozlowski, S., Archbold, L., Sperl, T. (2009) Value Stream Management for Lean Healthcare. Four steps to Planning, Mapping, Implementing, and Controlling Improvements in all types of Healthcare Environments. MCS Media, Inc. Chelsea, MI.
- Martin, K., Osterling, M. (2014). Value Stream Mapping. How to Visualize Work and Align Leadership for Organizational Transformation. McGraw-Hill Education Books. New York, NY.