
Chapter 2. Logging, Alerts, and Output Plug-ins
Introduction
All the time, money, and effort invested into an IDS can quickly become meaningless if you’re not looking at the logs and monitoring the alerts. If you’re administering a fairly large network, this could take significant time and resources. Even if you’re administering a small home network, looking at logs can still be a tedious task! Fortunately, Snort and many of its add-on products include numerous ways to make logging and alerting easier and more efficient. You can configure Snort to use a variety of output plug-ins, allowing you to log data as ASCII text files, binary files, databases, and more. Add-on products such as Swatch and Barnyard analyze the logs and alerts in easy-to-use formats. This chapter introduces you to the many options for viewing log and alert data, so there is no reason to let your IDS go a day unnoticed!
Remember to consider security when transmitting log data via methods such as syslog, email, and pager notifications. Your logging methods should comply with your company’s overall security policy. The event data that is logged and transmitted should be considered confidential, and possibly encrypted in transit and/or in storage.
2.1. Logging to a File Quickly
Solution
Edit the /etc/snort.conf file to use unified logging:
output alert_unified: filename snort.alert, limit 128
output log_unified: filename snort.log, limit 128
Discussion
Unified logging uses a Snort output plug-in to reduce the load on the Snort processing engine. To enable unified logging, you must uncomment and configure the following output plug-ins in the /etc/snort.conf file:
# unified: Snort unified binary format alerting and logging
# -------------------------------------------------------------
# The unified output plugin provides two new formats for logging and
# generating alerts from Snort, the "unified" format.  The unified
# format is a straight binary format for logging data out of Snort
# that is designed to be fast and efficient.  Used with barnyard (the
# new alert/log processor), most of the overhead for logging and
# alerting to various slow storage mechanisms such as databases or the
# network can now be avoided.
#
# Check out the spo_unified.h file for the data formats.
#
# Two arguments are supported.
#    filename - base filename to write to (current time_t is appended)
#    limit    - maximum size of spool file in MB (default: 128)
#
output alert_unified: filename snort.alert, limit 128
output log_unified: filename snort.log, limit 128
Both the filename and
file size limit parameters are configurable. Unified
logs have a varying number assigned to them after the .alert and .log filename extensions. In our example,
running Snort with the following command-line options created the
unified logging files snort.alert.1086463191
and snort.log.1086463191 in the C:Snortlog directory:
C:Snortin> snort -l c:snortlog -c c:snortetcsnort.confIf you’re using Snort on a very high-speed network, such as 1Gbps or greater, you benefit from unified logging. This allows the Snort engine to write logs and alerts quickly to a binary file, while offloading the spooling and processing to another program. Offloading the processing of the logs and alerts means that Snort can spend more time capturing data, thus decreasing the likelihood that packets are dropped. You must use a unified log reader, such as Barnyard, to process the logfiles.
See Also
2.2. Logging Only Alerts
Solution
Use the fast alert mode with the -A fast command-line option:
[testuser@localhost snort]# snort -de -c /etc/snort.conf -A fastYou can also use the Barnyard alert_fast plug-in in the /etc/barnyard.conf file:
# alert_fast
#-----------------------------
# Converts data from the dp_alert plugin into an approximation of
# Snort's "fast alert" mode.  Argument: <filename>

output alert_fast /var/log/snort/fast_output
Discussion
By default, Snort logs in a decoded ASCII format and uses full alerts. A full alert includes the alert message and the full packet header. Snort also includes other alert output options and logging methods, such as fast, full, console, or none.
To produce less output, you can use the fast alert mode with the -A fast command-line option:
[testuser@localhost snort]# snort -de -c /etc/snort.conf -A fastThe -d command-line option
logs application-layer information and -e logs data link-layer information. The
output then looks like the following:
11/05-22:08:59.705515  [**] [1:469:3] ICMP PING NMAP [**]
[Classification: Attempted Information Leak][Priority: 2] {ICMP}
192.168.206.129 -> 192.168.100.5
If you are using unified logging and the Barnyard output
utility, you can also log alerts by using the alert_fast output plug-in. Barnyard takes
the log processing load off of the Snort engine. Barnyard processing
is controlled by input processors and output plug-ins. Chapter 5 contains more information.
The following example is from the /etc/barnyard.conf file:
# alert_fast
#-----------------------------
# Converts data from the dp_alert plugin into an approximation of
# Snort's "fast alert" mode.  Argument: <filename>

output alert_fast /var/log/snort/fast_output
The Snort output passes to the Barnyard utility via the unified logging plug-in. By default, Barnyard processes the output and logs the alerts to the /var/log/snort/fast_output file. The output looks like the following:
[testuser@localhost snort]# more fast_output
11/06/04-00:32:05.706661 {ICMP} 192.168.206.129 -> 192.168.100.5
[**] [1:469:3] ICMP PING NMAP [**]
[Classification: Attempted Information Leak] [Priority: 2]
[Xref => http://www.whitehats.com/info/IDS162]
---------------------------------------------------------------------
11/06/04-00:32:10.896823 {ICMP} 192.168.206.129 -> 192.168.100.5
[**] [1:469:3] ICMP PING NMAP [**]
[Classification: Attempted Information Leak] [Priority: 2]
[Xref => http://www.whitehats.com/info/IDS162]
---------------------------------------------------------------------2.3. Logging to a CSV File
Solution
Use the Barnyard alert_csv
plug-in by editing the /etc/barnyard.conf
file:
output alert_csv: /var/log/snort/csv.out timestamp,msg,srcip,sport,
dstip,dport,protoname,itype,icode
Discussion
Snort alerts can be logged in comma-separated value format for
ease of use with databases and spreadsheets. This also allows
portability of output data to numerous software applications on a
variety of operating systems. To do this, you must use the Barnyard
output utility and Snort’s unified logging feature. Barnyard contains
the alert_csv module, which you can
configure to log your choice of the fields in the output, in any order
you specify. You can use the Barnyard alert_csv plug-in by editing the /etc/barnyard.conf file:
# alert_csv (experimental)
#---------------------------
# Creates a CSV output file of alerts (optionally using a user
# specified format) Arguments:  filepath [format]
#
# The format is a comma-seperated list of fields to output (no spaces
# allowed)
# The available fields are:
#   sig_gen         - signature generator
#   sig_id          - signature id
#   sig_rev         - signatrue revision
#   sid             - SID triplet
#   class           - class id
#   classname       - textual name of class
#   priority        - priority id
#   event_id        - event id
#   event_reference - event reference
#   ref_tv_sec      - reference seconds
#   ref_tv_usec     - reference microseconds
#   tv_sec          - event seconds
#   tv_usec         - event microseconds
#   timestamp       - timestamp (2001-01-01 01:02:03) in UTC
#   src             - src address as a u_int32_t
#   srcip           - src address as a dotted quad
#   dst             - dst address as a u_int32_t
#   dstip           - dst address as a dotted quad
#   sport_itype     - source port or ICMP type (or 0)
#   sport           - source port (if UDP or TCP)
#   itype           - ICMP type (if ICMP)
#   dport_icode     - dest port or ICMP code (or 0)
#   dport           - dest port
#   icode           - ICMP code (if ICMP)
#   proto           - protocol number
#   protoname       - protocol name
#   flags           - flags from UnifiedAlertRecord
#   msg             - message text
#   hostname        - hostname (from barnyard.conf)
#   interface       - interface (from barnyard.conf)
#
# Examples:
#   output alert_csv: /var/log/snort/csv.out
#   output alert_csv: /var/log/snort/csv.out  timestamp,
msg,srcip,sport,dstip,dport,protoname,itype,icode
#   output alert_csv: csv.out  timestamp,msg,srcip,sport,
dstip,dport,protoname,itype,icode

output alert_csv: /var/log/snort/csv.out timestamp,msg,
srcip,sport,dstip,dport,protoname,itype,icode
This logs the fields specified, in the order specified, to the file /var/log/snort/csv.out. The output looks like the following:
[testuser@localhost snort]# more csv.out
"2004-11-06 00:32:05",ICMP PING NMAP,192.168.206.129,,192.168.100.5,,
"ICMP",8,0
"2004-11-06 00:32:10",ICMP PING NMAP,192.168.206.129,,192.168.100.5,,
"ICMP",8,0
"2004-11-06 00:35:35",SNMP request tcp,192.168.206.129,36252,192.168.100.5,161,"TCP",,2.4. Logging to a Specific File
Solution
Use the -L <filename> option to
log to a specific file:
[testuser@localhost snort]# snort -L test1You can also specify a location by using the -l
<directory> command-line
option:
[testuser@localhost snort]# snort -l /snort/log -L test2Discussion
Logging traffic in binary mode is far less resource intensive than in other modes. Binary files can then be reviewed later using Snort, TCPDump, Ethereal, or other binary log-compatible programs.
You can log to a specific file by specifying the -L
<filename> command-line option. This
logs the network traffic to a binary file. The following command logs
all traffic to the file called test1 in the default Snort log
directory:
[testuser@localhost snort]# snort -L test1This command creates a file called test1.1084554709 in the /var/log/snort directory. You can also
specify a location by using the -l
<directory> command-line
option:
[testuser@localhost snort]# snort -l /snort/log -L test2This command creates a file called test1.1084554711 in the /snort/log directory.
See Also
2.5. Logging to Multiple Locations
Solution
Use various output plug-ins such as the Snort output plug-ins in /etc/snort.conf:
output alert_syslog: LOG_AUTH LOG_ALERT
output log_tcpdump: tcpdump.log
output database: log, mysql, user=root password=test dbname=db
host=localhost
output alert_unified: filename snort.alert, limit 128
output log_unified: filename snort.log, limit 128
You may also use the Barnyard plug-ins in the /etc/barnyard.conf file:
output alert_fast /var/log/snort/fast_alert
output log_dump /var/log/snort/dump_output
output alert_csv: /var/log/snort/csv.out  timestamp,msg,srcip,
sport,dstip,dport,protoname,itype,icode
output alert_syslog
output log_pcap /var/log/snort/pcap_log
Discussion
You can log your Snort output to multiple locations by using multiple output plug-ins. These can be the standard Snort output plug-ins, as well as the Barnyard output utility plug-ins. For example, you can log fast alerts, CSV, and to a database all at the same time. The snort.conf file currently supports the syslog, TCPDump, database, and unified output plug-ins. Barnyard supports the fast alerts, ASCII log dump, CSV, syslog, pcap, ACID database, and SGUIL. However, the more ways you log, the more load it places on the Snort engine and the CPU. You must choose your hardware and operating system carefully when logging to multiple locations.
Using the Snort output plug-ins in the /etc/snort.conf file and the following examples, you can log to syslog:
output alert_syslog: LOG_AUTH LOG_ALERT
A TCPDump file:
output log_tcpdump: tcpdump.log
A database:
output database: log, mysql, user=root password=test dbname=db
host=localhost
And unified logging:
output alert_unified: filename snort.alert, limit 128
output log_unified: filename snort.log, limit 128
The Barnyard output plug-ins can be configured in the /etc/barnyard.conf file using the following examples to log fast alerts with less information:
output alert_fast /var/log/snort/fast_alert
Output ASCII packet dumps:
output log_dump /var/log/snort/dump_output
Create a comma-separated value output file with various fields:
output alert_csv: /var/log/snort/csv.out
timestamp,msg,srcip,sport,dstip,dport,protoname,itype,icode
Create syslog output:
output alert_syslog
And create pcap output:
output log_pcap /var/log/snort/pcap_log
See Also
2.6. Logging in Binary
Solution
There are several options available to log packets in binary format.
Use the -b command-line option along with the -l
<directory> option:
C:Snortin>snort -l c:snortlog -bUse the -L <filename> option to
specify a name for the binary file:
C:Snortin>snort -l c:snortlog -L testUse the /etc/snort.conf
file to enable the log_tcpdump
output plug-in:
# log_tcpdump: log packets in binary tcpdump format
# -------------------------------------------------
# The only argument is the output file name.
#
output log_tcpdump: tcpdump.log
Use the /etc/snort.conf file to enable the unified output plug-in
output alert_unified: filename snort.alert, limit 128
output log_unified: filename snort.log, limit 128
Discussion
To log in binary format, you use the -b command-line option in conjunction with
-l. The -b option specifies to log the packets in
binary format. You won’t see any data output on the screen when you
are logging in binary format, unless you also use the -v command-line option. You don’t need to
specify the -d or -e command-line options, because by default,
the binary option logs the entire packet.
C:Snortin>snort -l c:snortlog -bThe previous command creates a file called snort.log.1084553605 in the C:Snortlog directory. In addition, you
can specify a name for the logfile by using the -L
<filename> option. When using the -L
option, you don’t need to specify the -b option because it automatically logs in
binary format.
C:Snortin>snort -l c:snortlog -L testThe previous command creates a file called test.1084554709 in the C:Snortlog directory.
If you run Snort in network intrusion detection (NIDS) mode, you can also perform binary logging by uncommenting the following line from the /etc/snort.conf file:
# log_tcpdump: log packets in binary tcpdump format
# -------------------------------------------------
# The only argument is the output file name.
#
output log_tcpdump: tcpdump.log
Unified logging also logs in binary format; however, it uses a Snort output plug-in to reduce the load on the Snort processing engine. To enable unified logging, uncomment and configure the following output plug-ins in the /etc/snort.conf file:
# unified: Snort unified binary format alerting and logging
# -------------------------------------------------------------
# The unified output plugin provides two new formats for logging and
# generating alerts from Snort, the "unified" format.  The unified
# format is a straight binary format for logging data out of Snort
# that is designed to be fast and efficient.  Used with barnyard (the
# new alert/log processor), most of the overhead for logging and
# alerting to various slow storage mechanisms such as databases or the
# network can now be avoided.
#
# Check out the spo_unified.h file for the data formats.
#
# Two arguments are supported.
#    filename - base filename to write to (current time_t is appended)
#    limit    - maximum size of spool file in MB (default: 128)
#
output alert_unified: filename snort.alert, limit 128
output log_unified: filename snort.log, limit 128
Both the filename and
file size limit parameters are configurable. Unified
logs have a unique, varying number appended to the filename (e.g.,
snort.alert.1099412241) to ensure
that existing files are not overwritten. This number is known as Epoch
time: the number of seconds since 01-01-1970.
Binary logging makes logging more efficient because the Snort engine doesn’t have to translate the data into human-readable format. Logging traffic in binary mode is far less resource intensive than in other modes. Binary files can then be reviewed later using Snort, TCPDump, Ethereal, or other binary log-compatible programs. If you are using Snort on a high-speed network, such as 1Gbps or greater, you benefit more from unified logging. This allows the Snort engine to write logs and alerts quickly to a binary file, while offloading the spooling and processing to another program. Offloading the processing of the logs and alerts means that Snort can spend more time capturing data, thus decreasing the likelihood that packets are dropped. Use a unified log reader, such as Barnyard, to process the logfiles.
See Also
2.7. Viewing Traffic While Logging
Problem
You are logging your traffic to files, or some other output means, but you also want to view the traffic on the screen.
Solution
Use the -v (verbose)
command-line option when running Snort:
C:Snortin>snort -vde -l c:snortlogDiscussion
Using -v on the command line
always allows you to see your network traffic. Just remember, this can
create a larger load on the CPU of the system running Snort. For
networks with high, steady traffic, you probably won’t want to run
Snort in this mode very often, since it could become overloaded and
drop packets.
To see what is going on while your packets are being logged,
simply use the -v (verbose)
command-line option when running Snort:
C:Snortin>snort -vde -l c:snortlog
Running in packet logging mode
Log directory = c:snortlog

Initializing Network Interface DeviceNPF_
{572FF0E6-9A1E-42B5-A2AF-A5A307B613EF}

        --=  = Initializing Snort =  =--
Initializing Output Plugins!
Decoding Ethernet on interface DeviceNPF_
{572FF0E6-9A1E-42B5-A2AF-A5A307B613EF}

        --=  = Initialization Complete =  =--

-*> Snort! <*-
Version 2.2.0-ODBC-MySQL-FlexRESP-WIN32 (Build 30)
By Martin Roesch ([email protected], www.snort.org)
1.7-WIN32 Port By Michael Davis ([email protected],
www.datanerds.net/~mike)
1.8 - 2.x WIN32 Port By Chris Reid
([email protected])

11/01-11:44:37.537461 0:C:F1:11:D:66 -> 0:5:5D:ED:3B:C6 type:0x800
len:0x3E
192.168.100.70:4258 -> 192.168.129.201:4243 TCP TTL:128 TOS:0x0
ID:45294 IpLen:2 0 DgmLen:48 DF
******S* Seq: 0x6C0D8FB0  Ack: 0x0  Win: 0x4000  TcpLen: 28
TCP Options (4) => MSS: 1460 NOP NOP SackOK
See Also
2.8. Logging Application Data
Problem
You want to capture the application data from network traffic—for example MySQL, HTTP, or FTP traffic.
Solution
To see the actual application payload data in ASCII format, you
can use the -C command-line option
to print out payloads with character data only (no hex). You must use
this in conjunction with the -d
command-line option, which dumps the application layer:
C:Snortin>snort -vdCDiscussion
There are times when you may want to record all transactions
related to a specific application. This may be for legal reasons,
content checking, or usage monitoring. Another reason to log
application data is to help application developers find bugs in
network applications. By default, Snort displays only the header
information of the packet. If you would like to see the actual payload
data in ASCII format, you can use the -C command-line option. You must use this in
conjunction with the -d
command-line option, which dumps the application layer, as well as the
-v option:
C:Snortin>snort -vdC
Running in packet dump mode
Log directory = log
Initializing Network Interface DeviceNPF_
{572FF0E6-9A1E-42B5-A2AF-A5A307B613EF}
--= = Initializing Snort = =--
Initializing Output Plugins!
Decoding Ethernet on interface DeviceNPF_
{572FF0E6-9A1E-42B5-A2AF-A5A307B613EF}
--= = Initialization Complete = =--
-*> Snort! <*-
Version 2.2.0-ODBC-MySQL-FlexRESP-WIN32 (Build 30)
By Martin Roesch ([email protected], www.snort.org)
1.7-WIN32 Port By Michael Davis ([email protected],
www.datanerds.net/~mike)
1.8 - 2.x WIN32 Port By Chris Reid
([email protected])
11/01-12:15:26.305595 192.168.100.70:4435 -> 216.239.51.147:80
TCP TTL:128 TOS:0x0 ID:50695 IpLen:20 DgmLen:323 DF
***AP*** Seq: 0x880283FF Ack: 0xD0CF219E Win: 0x4470 TcpLen: 20
GET / HTTP/1.1..Accept: */*..Accept-Language: en-us..Accept-Enco
ding: gzip, deflate..User-Agent: Mozilla/4.0 (compatible; MSIE 6
.0; Windows NT 5.0)..Host: www.google.com..Connection: Keep-Aliv
e..Cookie: PREF=ID=1c67539b15a71c3d:TM=1078849240:LM=1078849469:
TB=2:S=8BR7CQ3QdlExQhyo....
=+=+=+=+=+=+=+=+=+=+=+=+=+=+=+=+=+=+=+=+=+=+=+=+=+=+=+=+=+=+=+=+=+=+
11/01-12:15:26.341166 216.239.51.147:80 -> 192.168.100.70:4435
TCP TTL:52 TOS:0x10 ID:34185 IpLen:20 DgmLen:1400
***AP*** Seq: 0xD0CF219E Ack: 0x8802851A Win: 0x7AE4 TcpLen: 20
HTTP/1.1 200 OK..Cache-Control: private..Content-Type: text/html
..Content-Encoding: gzip..Server: GWS/2.1..Content-Length: 1192.
.Date: Thu, 01 Jul 2004 16:14:53 GMT...............Vmo.6..._.([b
..h.q.....X....t-.a..Z:ID$.&)+^....^...i.....{.w.....,. ..DA....
Z5.e.W..KaA..]+.H7.=...:.9.s........c/.,..D.Rf........kw<.Y.d=..
.....oR49NY.......#.....<........'.p.....&...'{.|...(......@;..5
W.?.dZ..r).I...D.U...S...80.ac.t&zU...9L.Y.....C...~2!..Wa..Y..
.l......4m..8.,...Q....1`lQ.YH...'$..0..d.H.$iF(...'^f..8.(/Y..
.2.~.S..<.yx..%..g.......Iks.)...u.h..{...T...&Rh...q...J.......
....!..)..$..?B..."........>.<{'K%....VL.%.......bE...3...kH}4.
....o.z..p<Ek.Z..hP..a .&.?N.......'o8r./.h..@a`.."........[iA._
...Sv....Yk.H�c.e.8V..j......H..*....u...E./.F......$...6iB....
.M^`.........].....v...97....5D.(....#.L..@[email protected][email protected]...'.~.
..0.G0.n...P.$.{.u.'.0..........}.F..1J..S.lY......a...%...3:G..
f?v...p..U&..'q.*K..s.$ .6....H..6....`.....7.8tj^.H..%.>..5..l
.a6kU....4...M.(.....F.....V.>.rvP.....3r^.W...Y..........m..V.a
..SM.)KVL..|i.hK..m7...N7..=~......&.t&..3Oj.Ld....+e.+.w....l..
.Z..]..w...k.e....}...`H[7...4+..2&[y<.W.}G..+..c.`..j....e.Y..J
.....n.m.AE..?.......A...^.)........{...^.(m.4w........_......N
(.....P?.%[email protected][.)....sz..~.bx.u...x.....K/..]A..
...4....u...woF....[=$q,.z~8.....]Q.29....F...G.^....D..EG..F..A
..._M.......^...
=+=+=+=+=+=+=+=+=+=+=+=+=+=+=+=+=+=+=+=+=+=+=+=+=+=+=+=+=+=+=+=+=+=+
11/01-12:15:26.373894 192.168.100.70:4435 -> 216.239.51.147:80
TCP TTL:128 TOS:0x0 ID:50697 IpLen:20 DgmLen:421 DF
***AP*** Seq: 0x8802851A Ack: 0xD0CF26EE Win: 0x3F20 TcpLen: 20
GET /images/logo.gif HTTP/1.1..Accept: */*..Referer: http://www.
google.com/..Accept-Language: en-us..Accept-Encoding: gzip, defl
ate..If-Modified-Since: Mon, 22 Mar 2004 23:04:23 GMT..User-Agen
t: Mozilla/4.0 (compatible; MSIE 6.0; Windows NT 5.0)..Host: www
.google.com..Connection: Keep-Alive..Cookie: PREF=ID=1c67539b15a
71c3d:TM=1078849240:LM=1078849469:TB=2:S=8BR7CQ3QdlExQhyo....
=+=+=+=+=+=+=+=+=+=+=+=+=+=+=+=+=+=+=+=+=+=+=+=+=+=+=+=+=+=+=+=+=+=+You can use the -C and
-d command-line options in any of
Snort’s modes: packet dump, packet logger, and NIDS. Although Snort
inspects the payload information, it doesn’t print or log this
information by default.
2.9. Logging to the Windows Event Viewer
Solution
Log your Snort alert messages to the Windows Event log by using
the -E command-line option:
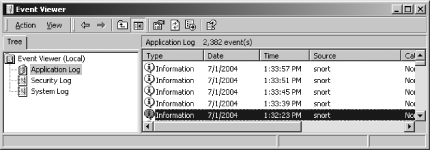
C:Snortin>snort -E -l C:snortlog -c c:snortetcsnort.confDiscussion
The -E command-line option is
available only on Snort for Windows. However, this does make log
viewing convenient by consolidating it into the same method as all
other Windows events. You must use this command-line option when
running Snort in NIDS mode so that alerts get properly generated in
Windows Event log format. Figure
2-1 shows what a Snort event looks like in the Event Viewer.
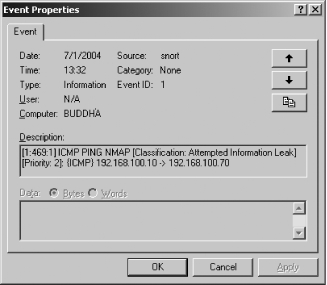
You can see the details of the log entry by double-clicking on it, as
shown in Figure
2-2.
See Also
2.10. Logging Alerts to a Database
Solution
Snort can log to a database by using the database output plug-ins in the snort.conf file. The following is the section of the snort.conf file where you must uncomment and configure the particular line for the database you are using:
# database: log to a variety of databases
# ---------------------------------------
# See the README.database file for more information about configuring
# and using this plugin.
#
# output database: log, mysql, user=root password=test dbname=db
# host=localhost
# output database: alert, postgresql, user=snort dbname=snort
# output database: log, odbc, user=snort dbname=snort
# output database: log, mssql, dbname=snort user=snort password=test
# output database: log, oracle, dbname=snort user=snort password=test
You must run Snort in NIDS mode so that it uses the snort.conf file to invoke the output plug-in:
C:Snortin>snort -l c:snortlog -c c:snortetcsnort.confDiscussion
Currently, Snort has database output plug-ins for MySQL, PostgresSQL, unixODBC, Oracle, and MS-SQL Server. You must make sure that you have the appropriate parameters for the database configured including database type, username, password, and database name. You must also determine if you want to log both alerts and logs. If the database plug-in is configured for “alert,” it only logs output from alert rules. If it is configured for “log,” it logs both log and alert rules. You can log to multiple databases at once, including multiple instances of the same database, if desired. However, the more ways you log, the more load it places on the Snort engine and the CPU. Choose your hardware and operating system carefully when logging to multiple databases.
2.11. Installing and Configuring MySQL
Solution
Before you install MySQL, you must create a group and user for MySQL to run as:
[root@localhost root]#groupadd mysql[root@localhost root]#useradd -g mysql mysql
Next, download MySQL (we saved it in the /root directory). Use the following commands to install and configure MySQL:
[root@localhost root]#cd /usr/local [root@localhost local]#tar zxvf/root/mysql-standard-4.0.20-pc-linux-i686.tar.gz[root@localhost local]#ln -s/usr/local/mysql-standard-4.0.20-pc-linux-i686/ mysql[root@localhost local]#cd mysql[root@localhost mysql]#scripts/mysql_install_db --user=mysql[root@localhost mysql]#chown -R root .[root@localhost mysql]#chown -R mysql data[root@localhost mysql]#chgrp -R mysql .
Next, to start the MySQL server, you can use the following command:
[root@localhost mysql]# bin/mysqld_safe --user=mysql &Finally, once MySQL is started, you must assign passwords to the local accounts for the database:
[root@localhost mysql]#./bin/mysqladmin -u root password newpassword[root@localhost mysql]#./bin/mysqladmin -u root -hlocalhost.localdomain password newpassword
Discussion
MySQL is a popular open source freeware database. Snort has built-in support for logging to a MySQL database. MySQL can be downloaded from the following site: http://dev.mysql.com/downloads/. Be sure to download the latest production release for your platform, such as mysql-standard-4.x.yy-pc-linux-i686.tar.gz.
The MySQL installation creates a directory with a long name for
the version of MySQL that you are installing in the /usr/local directory. It’s easier to work
with it if you create a symbolic link to it with the simple name
mysql, allowing you to refer to
the directory as /usr/local/mysql. The mysql_install_db script, located in the
scripts subdirectory, initializes
the database and creates the appropriate grant tables. Next you must
change the ownership of the program binaries to root and the data
directory to the user that MySQL runs as (which is mysql, in this case). Once you start the
MySQL server, you should see it listed in the process list by viewing
it with ps -aef. After starting the
server, you should assign passwords to the accounts that were created
with the grant tables. You must use a stronger password than newpassword, which we used in the example.
Now that MySQL is officially installed and configured, you can access
it by typing /usr/local/mysql/bin/mysql.
If you would like MySQL to start up automatically when you boot the system, you can add the following commands:
[root@localhost root]#cp /usr/local/mysql/support-files/mysql.server /etc/init.d/mysql[root@localhost root]#cd /etc/rc3.d[root@localhost rc3.d]#ln -s ../init.d/mysql S85mysql[root@localhost rc3.d]#ln -s ../init.d/mysql K85mysql[root@localhost rc3.d]#cd /etc/rc5.d[root@localhost rc5.d]#ln -s ../init.d/mysql S85mysql[root@localhost rc5.d]#ln -s ../init.d/mysql K85mysql[root@localhost rc5.d]#cd ../init.d[root@localhost init.d]#chmod 755 mysql
2.12. Configuring MySQL for Snort
Solution
Install Snort with MySQL support with the following:
[root@localhost snort-2.2.x]#./configure--with-mysql=/usr/local/mysql[root@localhost snort-2.2.x]#make[root@localhost snort-2.2.x]#make install
Next, create the Snort database, set the password, and grant permissions:
[root@localhost root]#/usr/local/mysql/bin/mysql -u root -pEnter password: Welcome to the MySQL monitor. Commands end with ; or g. Your MySQL connection id is 4 to server version: 4.0.20-standard Type 'help;' or 'h' for help. Type 'c' to clear the buffer. mysql>create database snort;Query OK, 1 row affected (0.07 sec) mysql>SET PASSWORD FOR snort@localhost=PASSWORD('password'),Query OK, 0 rows affected (0.00 sec) mysql>grant CREATE,INSERT,SELECT,DELETE,UPDATE on snort.* tosnort@localhost;Query OK, 0 rows affected (0.00 sec) mysql>grant CREATE,INSERT,SELECT,DELETE,UPDATE on snort.* to snort;Query OK, 0 rows affected (0.00 sec) mysql>exit
Next, run the Snort create_mysql script and snortdb-extra.gz to generate the appropriate tables in the database:
[root@localhost root]#cd snort-2.2.x[root@localhost snort-2.2.x]#/usr/local/mysql/bin/mysql -u root -p < ./contrib/create_mysql snortEnter password: [root@localhost snort-2.2.x]#cd contrib[root@localhost contrib]#zcat snortdb-extra.gz |/usr/local/mysql/bin/mysql -p snortEnter password:
Finally, add a line in the snort.conf file to use the database output plug-in, making sure you configure it with the right parameters for your database:
output database: log, mysql, user=snort password=password dbname=snort host=localhost
Discussion
Once you have MySQL installed and configured, you must make the necessary Snort configurations. First, when you install Snort, you need to install it with MySQL support. There are quite a few things you must do when configuring Snort to interact with MySQL. Once you have followed the preceding steps, you can use the following commands to check that the Snort database was created correctly. First, log into MySQL using the following command and supply the password that you previously created:
[root@localhost contrib]# /usr/local/mysql/bin/mysql -p
Enter password:
Welcome to the MySQL monitor.  Commands end with ; or g.
Your MySQL connection id is 7 to server version: 4.0.20-standard

Type 'help;' or 'h' for help. Type 'c' to clear the buffer.
The following command will show the current MySQL databases; make sure that your newly created Snort database is listed:
mysql> show databases;
+----------+
| Database |
+----------+
| mysql    |
| snort    |
| test     |
+----------+
3 rows in set (0.00 sec)
The following commands will select the Snort database as the current database and then show the existing Snort tables:
mysql>use snort;Reading table information for completion of table and column names You can turn off this feature to get a quicker startup with -A Database changed mysql>show tables;+------------------+ | Tables_in_snort | +------------------+ | data | | detail | | encoding | | event | | flags | | icmphdr | | iphdr | | opt | | protocols | | reference | | reference_system | | schema | | sensor | | services | | sig_class | | sig_reference | | signature | | tcphdr | | udphdr | +------------------+ 19 rows in set (0.00 sec) mysql>exit
Next, you can run some traffic that creates events—such as an Nmap scan—and check the database to make sure the events are logged:
mysql> select * from event;
+-----+-----+-----------+---------------------+
| sid | cid | signature | timestamp           |
+-----+-----+-----------+---------------------+
|   1 |   1 |         1 | 2004-11-06 03:24:51 |
|   1 |   2 |         1 | 2004-11-06 03:24:57 |
|   1 |   3 |         2 | 2004-11-06 03:32:41 |
|   1 |   4 |         2 | 2004-11-06 03:32:47 |
|   1 |   5 |         3 | 2004-11-06 03:33:29 |
|   1 |   6 |         3 | 2004-11-06 03:33:35 |
|   1 |   7 |         4 | 2004-11-06 03:33:41 |
|   1 |   8 |         4 | 2004-11-06 03:33:47 |
|   1 |   9 |         5 | 2004-11-06 03:34:53 |
|   1 |  10 |         5 | 2004-11-06 03:34:59 |
|   1 |  11 |         6 | 2004-11-06 03:35:05 |
|   1 |  12 |         6 | 2004-11-06 03:35:11 |
|   1 |  13 |         7 | 2004-11-06 03:35:17 |
|   1 |  14 |         7 | 2004-11-06 03:35:23 |
|   1 |  15 |         7 | 2004-11-06 03:37:42 |
+-----+-----+-----------+---------------------+
15 rows in set (0.00 sec)2.13. Using PostgreSQL with Snort and ACID
Solution
Setting up Snort to log to a PostgreSQL database is similar to how you’d set up MySQL. However, there are several different steps that have to be accomplished to get Snort to log there. For simplicity, we will set up Snort to use PostgreSQL as the database for an ACID web frontend, and we’ll compile from PostgreSQL source to tweak our database.
Discussion
The following steps enable a PostgreSQL database and Snort support.
Download the database source from http://www.postgresql.org. Then, place the source file postgresql-7.4.5.tar.gz in a temp directory such as /tmp to compile:
root#pwd/tmp root#lspostgresql-7.4.5.tar.gz root#tar xvfz postgresql-7.4.5.tar.gzroot#cd postgresql-7.4.5root#./configure <OPTIONAL: SET HOMEDIR:--prefix=/usr/local/postgres> ; make; make install
Create a user account to run as:
# Linux systemsuseradd postgres# BSD systemsecho "postgres;;;;;;;;;no" | adduser -w - -f "no"
Next, install the database using the optional --with-openssl configure option, if you are
considering encrypting your Snort-to-database connections:
root#./configure [--with-openssl]root#make; make install# Running make install places the database into the default directory # of "/usr/local/pgsql" with subdirectories.
Make a data directory in which to hold the databases:
root#mkdir /usr/local/pgsql/dataroot#chown -R postgres /usr/local/pgsql/data
Start the new PostgreSQL database:
root#su - postgrespostgres$/usr/local/pgsql/bin/initdb -D /usr/local/pgsql/datapostgres$/usr/local/pgsql/bin/postmaster -D /usr/local/pgsql/data &
To have the PostgreSQL database start automatically when you boot the system, try the following example script. Thanks go to the postgresql.org archives for this example:
##!/bin/sh

## Start postgres at boot time script
# from postgresql.org site
#
########

# INSTALLATION Prefix
prefix=/usr/local/pgsql

# Data directory
PGDATA="/usr/local/pgsql/data"

# Who to run as
PGUSER=postgres

# Where to keep a log file
PGLOG="$PGDATA/serverlog"

# Path for the script to use
PATH=/usr/local/sbin:/usr/local/bin:/sbin:/bin:/usr/bin:/usr/sbin

# What to use to start the postmaster
DAEMON="$prefix/bin/pg_ctl"

test -x "$DAEMON" || exit 0

case $1 in
        start)
        su  $PGUSER -c "$DAEMON start -D $PGDATA -s $PGLOG"
        echo -n ' postgresql'
        ;;
        stop)
        su  $PGUSER -c "$DAEMON stop -D $PGDATA -s -m fast"
        ;;
        restart)
        su  $PGUSER -c "$DAEMON restart -D $PGDATA -s -m fast"
        ;;
        status)
        su  $PGUSER -c "$DAEMON status -D $PGDATA"
        ;;
        *)
        # PRINT HELP
        echo "Usage: `basename $0` (start|stop|restart|status)" 1>&2
        exit 1
        ;;
esac
Next, since the new PostgreSQL instance has no databases or users, you must create them.
PostgreSQL has a much different look and feel to it if you are coming from a MySQL background. If you are uncomfortable running some of these commands from a console, try using a GUI application such as phpPgAdmin (available at http://phppgadmin.sourceforge.net) for ease of use and management. However, for the brave, read on to find out how to create a PostgreSQL database, user account, and grants for a user.
Create the database for Snort to log to:
root# /usr/local/pgsql/bin/createdb -U postgres acidpg
# IF YOU ARE RUNNNG AS user 'postgres' you don't need the
# "-U postgres"
Next, create the two user accounts: sensor(s) (snortpguser) and web interface(s) (webpguser):
root#/usr/local/pgsql/bin/createuser -U postgres -A -D-P <set password> snortpguserroot#/usr/local/pgsql/bin/createuser -U postgres -A -D -P<set password> webpguser
Next, import the correct database schema (structure) for Snort to use:
root#cat /tmp/snort-2.2.x/contrib/create_postgresql |/usr/local/pgsql/bin/psql -U postgres -d acidpgroot#gunzip /tmp/snort-2.2.x/contrib/snortdb-extra.gzroot#cat /tmp/snort-2.2.x/contrib/snortdb-extra |/usr/local/pgsql/bin/psql -U postgres -d acidpg
Grant the two user accounts permissions on the database:
root#/usr/local/pgsql/bin/psql -U postgres -D acidpgacidpg=#GRANT ALL PRIVILEGES ON DATABASE acidpg TO webpguser;acidpg=#GRANT ALL PRIVILEGES ON DATABASE acidpg TO snortpguser;
Tip
You can have more than two accounts if you want every sensor to have a unique account to log in with.
If you want to restrict what the sensor accounts have access to,
try pasting the following example into the PostgreSQL prompt in place
of the ALL PRIVILEGES line:
 GRANT UPDATE,SELECT,INSERT ON sensor to snortpguser;
 GRANT UPDATE,SELECT,INSERT ON sensor_sid_seq to snortpguser;
 GRANT UPDATE,SELECT,INSERT ON data to snortpguser;
 GRANT UPDATE,SELECT,INSERT ON detail to snortpguser;
 GRANT UPDATE,SELECT,INSERT ON encoding to snortpguser;
 GRANT UPDATE,SELECT,INSERT ON event to snortpguser;
 GRANT UPDATE,SELECT,INSERT ON flags to snortpguser;
 GRANT UPDATE,SELECT,INSERT ON icmphdr to snortpguser;
 GRANT UPDATE,SELECT,INSERT ON iphdr to snortpguser;
 GRANT UPDATE,SELECT,INSERT ON opt to snortpguser;
 GRANT UPDATE,SELECT,INSERT ON protocols to snortpguser;
 GRANT UPDATE,SELECT,INSERT ON reference to snortpguser;
 GRANT UPDATE,SELECT,INSERT ON reference_ref_id_seq to snortpguser;
 GRANT UPDATE,SELECT,INSERT ON reference_system to snortpguser;
 GRANT UPDATE,SELECT,INSERT ON reference_system_ref_system_id_seq to
 snortpguser;
 GRANT UPDATE,SELECT,INSERT ON schema to snortpguser;
 GRANT UPDATE,SELECT,INSERT ON services to snortpguser;
 GRANT UPDATE,SELECT,INSERT ON sig_class to snortpguser;
 GRANT UPDATE,SELECT,INSERT ON sig_class_sig_class_id_seq to
 snortpguser;
 GRANT UPDATE,SELECT,INSERT ON sig_reference to snortpguser;
 GRANT UPDATE,SELECT,INSERT ON signature to snortpguser;
 GRANT UPDATE,SELECT,INSERT ON signature_sig_id_seq to snortpguser;
 GRANT UPDATE,SELECT,INSERT ON tcphdr to snortpguser;
 GRANT UPDATE,SELECT,INSERT ON udphdr to snortpguser;
If you are already trying to connect to the database with one or both of the accounts and get errors such as:
ERROR: Relation `table_name' does not exist
then for some reason, one of the Snort database tables didn’t
apply all the correct privileges to that table. You can try to correct
this by either adjusting the single table manually with one of the
previous commands or pasting in the 24-line GRANT statement in the previous code.
ACID needs to add several additional tables to the PostgreSQL database to function properly. Unfortunately, the PostgreSQL language has changed since the original ACID code was written, so there is a small name change that must be implemented.
As of PostgreSQL 7.4x, the function DATETIME is now called TIMESTAMP. This means you need to change the
files found in the ACID directory that have to do with PostgreSQL
(.sql files) and the ACID
.html and .php files. This actually only involves
editing the following three files, replacing each occurrence of
DATETIME with TIMESTAMP:
Create_acid_tbls_psql.sql
Create_acid_tbls_pgsql_extra.sql
Acid_db_setup.php
Also, before you begin trying to set up PostgreSQL ACID, remember to check that your Apache server is compiled with PostgreSQL support. Apache should be configured using a command line similar to the following:
# ./configure --with-pgsql --with-your-other-options
Next, edit the file acid_conf.php with your database account:
$alert_dbname = "acidpg";
$alert_host = "localhost";
$alert_port = "5432";
$alert_user = "webpguser";
$alert_password = "webpass";
Next, set up the ACID schema through the ACID main page acid_main.php in a browser. This will redirect you to the acid_db_setup.php page to create the extra tables that ACID needs. If you get errors, check privileges in the database and try again.
If you got no errors with the database or ACID, then set up Snort to log to the database by editing your snort.conf file such as:
output database: log, postgresql, user=snortpguser,
password=snortpass, dbname=acidpg host=localhost
If you are going to use more than one sensor, it’s a good idea
to use the sensor_name parameter,
as in this example:
output database: log, postgresql, user=snortpguser,
password=snortpass, dbname=acidpg host=localhost
sensor_name=oreilly_test
Lastly, download and compile Snort from source again. First, extract the Snort source code:
root#lssnort-2.2.x.tar.gz root#tar xvfz snort-2.2.x.tar.gzroot#cd snort-2.2.x
Compile Snort to use your PostgreSQL database:
root#./configure --with-postgresql=/usr/local/pgsql (other options)root#make# WARNING! # YOU MAY HAVE TO PLACE THE FILE "libpq.so.3" in your /lib directory # in order for snort to work.
The last part of the build is testing. Run Snort with the
-T option to make sure everything
is working (see Recipe
3.12). If no errors occur, restart Snort. You’re now running
Snort logging to a PostgreSQL database
with an ACID frontend.
See Also
PostgreSQL home (http://www.postgresql.org)
Quick, local-only Snort/PostgreSQL setup (http://kellys.net/snort)
2.14. Logging in PCAP Format (TCPDump)
Solution
The Snort log_tcpdump output
plug-in allows you to log and store data in PCAP format. Configure the
snort.conf file with the name of
the TCPDump logfile to use:
# log_tcpdump: log packets in binary tcpdump format
# -------------------------------------------------
# The only argument is the output file name.
#
output log_tcpdump: tcpdump.log
Run Snort in NIDS mode so that it uses the snort.conf file to invoke the output plug-in:
C:Snortin>snort -l c:snortlog -c c:snortetcsnort.confDiscussion
Snort’s network architecture is based on the Packet Capture
Library (PCAP) and uses libpcap for its underlying data capture. Many
network analysis engines, sniffers, and statistics tools can read data
in the PCAP format. You can use the log_tcpdump output plug-in to save the data
and then view it with tools such as TCPDump and Ethereal.
2.15. Logging to Email
Solution
First, configure snort.conf to log alerts to syslog:
# alert_syslog: log alerts to syslog
# ----------------------------------
# Use one or more syslog facilities as arguments.  Win32 can also
# optionally specify a particular hostname/port.  Under Win32, the
# default hostname is '127.0.0.1', and the default port is 514.
#
# [Unix flavours should use this format...]
 output alert_syslog: LOG_AUTH LOG_ALERT
#
# [Win32 can use any of these formats...]
# output alert_syslog: LOG_AUTH LOG_ALERT
# output alert_syslog: host=hostname, LOG_AUTH LOG_ALERT
# output alert_syslog: host=hostname:port, LOG_AUTH LOG_ALERT
Snort sends alerts to the syslog file with the snort: prefix. Edit /.swatchrc to send an email when a Snort
event is added to the syslog:
watchfor /snort:/
mail [email protected],subject=Snort Alert!
Next, make sure you run Swatch to watch for syslog messages in /var/log/messages (some distributions use /var/log/syslog):
[root@localhost root]# swatch -t /var/log/messagesLastly, run Snort in NIDS mode to use the snort.conf file to invoke the syslog output plug-in:
[root@localhost snort-2.2.x]#snort -l /var/log/snort -c./etc/snort.conf
Discussion
The easiest way to receive Snort alerts via email is to configure Swatch (available at http://swatch.sourceforge.net/) to monitor syslog and send an email when a Snort event is produced. Swatch is a log-monitoring utility that can filter messages from logfiles to display or log elsewhere. Syslog messages are one line, whereas Snort alert files are multiple lines and often produce a separate email for each line. Swatch uses sendmail, the default mail server on most Unix platforms, to send the email alerts. You must have sendmail configured and running on your syslog system to send emails.
Configuring an outbound-only sendmail server is a simple matter of disabling the port 25/tcp listener. This prevents an internal attack from compromising your syslog server through a sendmail vulnerability.
On Red Hat platforms, simply edit the file /etc/sysconfig/sendmail and change the line
DAEMON=yes to DAEMON=no.
On BSD platforms or custom sendmail configurations, use the following command:
sendmail -q 5
This runs sendmail without a daemon listener and pushes out mail
in five minute intervals (-q
5). All mail that’s located on the
machine (your syslog server) will be sent out in five minute intervals
without leaving a port open for internal attack.
One point to remember is that if configured incorrectly, logging IDS alerts to email can quickly create a denial of service on your mail server.
2.16. Logging to a Pager or Cell Phone
Solution
First, configure the snort.conf to log alerts to syslog:
# alert_syslog: log alerts to syslog
# ----------------------------------
# Use one or more syslog facilities as arguments.  Win32 can also
# optionally specify a particular hostname/port.  Under Win32, the
# default hostname is '127.0.0.1', and the default port is 514.
#
# [Unix flavours should use this format...]
 output alert_syslog: LOG_AUTH LOG_ALERT
#
# [Win32 can use any of these formats...]
# output alert_syslog: LOG_AUTH LOG_ALERT
# output alert_syslog: host=hostname, LOG_AUTH LOG_ALERT
# output alert_syslog: host=hostname:port, LOG_AUTH LOG_ALERT
Snort sends alerts to the syslog file with the snort: prefix. Use Swatch again to filter the log messages. Then edit /.swatchrc to send a page when a Snort event is added to the syslog:
watchfor /snort:/
exec /usr/local/bin/qpage -p Security_Admin `$0'
This sends a page to the number that is configured for Security_Admin. The $0 parameter includes the entire Snort alert
as input to the qpage command.
Next, make sure you run Swatch to watch for syslog messages in
/var/log/messages:
[root@localhost root]# swatch -t /var/log/messagesLastly, run Snort in NIDS mode to use the snort.conf file to invoke the syslog output plug-in:
[root@localhost snort-2.2.x]#snort -l /var/log/snort -c./etc/snort.conf
Discussion
The best way to receive Snort alerts on a pager or cell phone is to use a third-party package, such as QuickPage. QuickPage is a free, Unix-compatible client/server software package that can send messages to an alphanumeric pager. You must configure Swatch to monitor alerts, and then use the exec command in the /.swatchrc file to initiate the paging program.
2.17. Optimizing Logging
Solution
To log in binary format, you must use the -b command-line option in conjunction with
the -l option:
C:Snortin>snort -l c:snortlog -bYou can also specify a name for the logfile by using the -L
<filename> option:
C:Snortin>snort -l c:snortlog -b -L testIf you are running Snort in NIDS mode, you can also perform
binary logging by configuring the log_tcpdump output plug-in in the /etc/snort.conf file:
output log_tcpdump: tcpdump.log
You can also use the unified output plug-in in the /etc/snort.conf file:
output alert_unified: filename snort.alert, limit 128
output log_unified: filename snort.log, limit 128
Discussion
Two methods can be used to optimize Snort logging: binary logging and unified logging.
To log in binary format you must use the -b command-line option in conjunction with
the -l option. The -b option specifies to log the packets in
binary format. You won’t see any data output on the screen when you
are logging in binary format, unless you also use the -v command-line option. You don’t need to
specify the -d or -e command-line options, because by default,
the binary option logs the entire packet.
C:Snortin>snort -l c:snortlog -bThis command creates a file called snort.log.1084553605 in the C:Snortlog directory. You can also
specify a name for the logfile by using the -L
<filename> option.
C:Snortin>snort -l c:snortlog -b -L testTip
The numbers assigned to snort.log.xxx or filename.yyy are known as Epoch time; this is the number of seconds since 01-01-1970.
This command creates a file called test.1084554709 in the C:Snortlog directory. If you are running Snort in NIDS mode, you can also perform binary logging by uncommenting the following line from the /etc/snort.conf file:
# log_tcpdump: log packets in binary tcpdump format
# -------------------------------------------------
# The only argument is the output file name.
#
output log_tcpdump: tcpdump.log
The following command runs Snort in NIDS mode and creates a binary file with the name tcpdump.log.number, such as tcpdump.log.1086466896, in the C:Snortlog directory:
C:Snortin> snort -l c:snortlog -c c:snortetcsnort.confUnified logging also logs in binary format; however, it uses a Snort output plug-in to reduce the load on the Snort processing engine. To enable unified logging, you must make a change to the /etc/snort.conf file by uncommenting and configuring the following output plug-ins:
# unified: Snort unified binary format alerting and logging
# -------------------------------------------------------------
# The unified output plugin provides two new formats for logging and
# generating alerts from Snort, the "unified" format.  The unified
# format is a straight binary format for logging data out of Snort
# that is designed to be fast and efficient.  Used with barnyard (the
# new alert/log processor), most of the overhead for logging and
# alerting to various slow storage mechanisms such as databases or the
# network can now be avoided.
#
# Check out the spo_unified.h file for the data formats.
#
# Two arguments are supported.
#    filename - base filename to write to (current time_t is appended)
#    limit    - maximum size of spool file in MB (default: 128)
#
output alert_unified: filename snort.alert, limit 128
output log_unified: filename snort.log, limit 128
Both the filename and
file size limit parameters are
configurable. Unified logs have a varying number assigned to them
after the .alert and .log filename extensions. In our example,
running Snort with the following command-line options created the
unified logging files snort.alert.1086463191 and snort.log.1086463191 in the C:Snortlog directory:
C:Snortin> snort -l c:snortlog -c c:snortetcsnort.confThe best way to optimize Snort logging is to use unified logging with a separate log-processing tool such as Barnyard. Binary logging makes logging more efficient because the Snort engine doesn’t have to translate the data into human-readable format. Logging traffic in binary mode is great for high-speed networks and compact storage. Binary files can then be reviewed later using Snort, TCPDump, Ethereal, or other binary log-compatible programs. If you are using Snort on a very high-speed network, such as 1 Gbps or greater, you benefit more from unified logging. This allows the Snort engine to write logs and alerts quickly to a binary file, while offloading the spooling and processing to another program. Offloading the processing of logs and alerts means Snort can spend more time capturing data, thus decreasing the likelihood that packets are dropped. You must use a unified log reader, such as Barnyard, to process the logfiles.
See Also
2.18. Reading Unified Logged Data
Solution
Download Barnyard from http://www.snort.org/dl and then install it with the following commands:
[root@localhost root]#tar zxvf barnyard-0.2.0.tar.gz[root@localhost barnyard-0.2.0]#cd barnyard-0.2.0[root@localhost barnyard-0.2.0]#./configure[root@localhost barnyard-0.2.0]#make[root@localhost barnyard-0.2.0]#make install
If you already have Snort configured to output unified logs, you can test Barnyard with the following:
[root@localhost root]# barnyard -o /var/log/snort/*This creates the human-readable dump.log and fast.alert files in your current directory.
Discussion
Barnyard processes unified and binary Snort output files. By
offloading the log processing to a tool like Barnyard, Snort can
concentrate on what it does best: capturing network traffic and
detecting intrusions. Barnyard has several output plug-ins. Some mimic
the functionality already built into Snort, such as fast alerts, ASCII
packet dumps, syslog, and pcap. It also offers new plug-ins such as
CSV output, advanced syslog output, ACID, and SQUIL support. Barnyard
also has database support, such as MySQL. However, it must be
installed with the appropriate configure switch, such as --enable-mysql, to enable this support. This
allows Barnyard to process unified output files and log the data to a
database.
If you do not have all the necessary configuration files in their default locations, you may have to run the command with more parameters, such as in the following:
[root@localhost root]#barnyard -c/root/barnyard-0.2.0/etc/barnyard.conf -o /var/log/snort/* -s/root/snort-2.2.x/etc/sid-msg.map -g /root/snort-2.2.x/etc/gen-msg.map-p /root/snort-2.2.x/etc/classification.config
2.19. Generating Real-Time Alerts
Solution
Use Pig Sentry to monitor Snort output and generate alerts:
[root@localhost root]#tail -f /var/log/snort/alert | perlpigsentry-1.2[Sun Nov 7 14:40:38 2004] alert: New event: ICMP PING NMAP
Discussion
Pig Sentry is a lightweight Perl script that executes against the Snort alert log. It was written to handle a large volume of alert data in real time. Pig Sentry maintains a state table of recent alerts so it can alert on new events or alert of changes in trends or patterns of events.
Download the latest version of Pig Sentry from http://web.solv.com/tools/pigsentry/ or http://www.snort.org/dl/contrib/data_analysis/pigsentry/. The following example shows how to run Pig Sentry, assuming you’re already running Snort in NIDS mode and logging alerts to /var/log/snort:
[root@localhost root]#tail -f /var/log/snort/alert | perlpigsentry-1.2[Sun Nov 7 14:40:38 2004] alert: New event: ICMP PING NMAP
Performing an Nmap scan generated the alert shown in this example.
2.20. Ignoring Some Alerts
Solution
Create a pass rule to ignore the particular traffic. The following rule ignores any traffic from ServerA:
pass tcp ServerA any -> any any
You must be sure to change the rule testing order to pass|alert|log by using the Snort -o
command-line option:
[root@localhost root]# snort -o -c /etc/snort.confYou can also ignore traffic by using a filter on the command line when starting Snort:
snort -c /etc/snort.conf not host ServerA
Discussion
There are two ways to configure Snort to ignore certain types of traffic: use a pass rule or use a Berkeley Packet Filter on startup. Be extra careful when using pass rules and filters so that you don’t accidentally configure your IDS in a way that it misses alerting on potential intrusions.
See Also
2.21. Logging to System Logfiles
Problem
You want to log to a system logfile such as the messages file under Linux, so that you have a centralized logging facility.
Solution
Use the alert_syslog output
plug-in in the /etc/snort.conf file.
output alert_syslog: <facility> <priority> <options>
For example, to send an alert to the system log with a facility
of LOG_DAEMON (log as a system
daemon), a Priority of LOG_CRIT
(critical conditions), and the option LOG_PERROR (print the log to standard error
as well), you would use the following:
output alert_syslog: LOG_DAEMON LOG_CRIT LOG_PERROR
Discussion
Logging to the system logfiles is a useful way of monitoring all your systems simultaneously. Using some of the tools described in later chapters for the automated monitoring of logfiles, you can watch everything from disk usage to intrusion attempts, all in the same place. It also means that you can log to a central log host by forwarding all syslog calls to a central server.
Each set of options directly corresponds to those in the manpage for syslog (3) on Unix systems. For further detail, you should refer to these.
Facility is one of: LOG_AUTH,
LOG_AUTHPRIV, LOG_DAEMON, LOG_USER, and LOG_LOCAL0 through LOG_LOCAL7.
Priority is one of: LOG_EMERG, LOG_ALERT, LOG_CRIT, LOG_ERR, LOG_WARNING, LOG_NOTICE, LOG_INFO, and LOG_DEBUG.
Finally, there are the options: LOG_CONS, LOG_NDELAY, LOG_PERROR, and LOG_PID.
See Also
syslog (3) manpage
Snort Users Manual
2.22. Fast Logging
Solution
Use the Snort alert_fast
output plug-in.
output alert_fast: filename
The data from the logfile could then be displayed or sorted somewhere else for use on a quick status or ESM/SIM high-level view of what attacks are occurring on your network.
Discussion
To enable the alert_fast
output plug-in, edit the snort.conf file under the section for
output plug-ins and place the following as the first plug-in:
output alert_fast: fast_logging.txt
The snort.conf file is read
from the top down, so the closer to the top, the quicker your settings
will take effect in the Snort startup process. The path will be set
when you pass Snort the -l option
to specify the logging directory.
This output plug-in should really not be used in a production environment unless setting up Barnyard is not an option. This plug-in takes no options other than the filename to use for logging events. One possible use of this plug-in would be to take the events being logged and display them for a quick status page.
The following is an example of the fast_logging.txt output when Snort detects an Nmap scan:
# cat fast_logging.txt
11/20-01:00:52:856446  [**] [1:469:3] ICMP PING NMAP [**]
[Classification: Attempted Information Leak] [Priority: 2] {ICMP}
10.0.1.5 -> 10.0.1.100
The best solution for an output plug-in such as this would be to spend some time developing a “status” page for the events to be filtered through. This would be good not only for keeping an eye on whether your Snort processes are working, but also for determining the speed and type of attacks coming to your network from each sensor.
2.23. Logging to a Unix Socket
Solution
The alert_unixsock output
plug-in opens a Unix socket and sends all alerts to it. It takes no
options:
output alert_unixsock
Discussion
Unix sockets are commonly mistaken for TCP/IP sockets. While there are many similarities in the way they’re handled internally, you won’t be able to connect to a Unix socket from another machine. These are purely for local interprocess communication. There is quite a big giveaway in the name of this plug-in that indicates that this is not for use on the Windows platform.
The alert_unixsock plug-in
will send all alerts to the snort_alert file in the current Snort
logging directory. For example, if you start Snort as follows:
snort -c /etc/snort/snort.conf -l /tmp
Snort will attempt to log to the /tmp/snort_alert file. Snort makes no attempt to create this file, and will report an error should the file not exist or be unwriteable. This won’t, however, stop Snort from starting, and when the socket is created, it will start to push alerts to it.
Most, if not all, Unix programming languages will include
commands for manipulating sockets. If you search the Internet, you can
find example C code to create, open, close, and read from sockets.
You’ll even find some examples specific to the alert_unixsock plug-in. The following
example is given in Perl:
#!/usr/bin/perl

# Include the socket libraries

use IO::Socket;

# This is the template to capture the Alert Name
# Edit this to get the additional packets.

$TEMPLATE = "A256 A*";

# Release the socket if it already exists

unlink "/var/log/snort/snort_alert";

# In case of user termination - exit gracefully.

$SIG{TERM} = $SIG{INT} = sub { exit 0 };

# Open up the socket.
my $client = IO::Socket::UNIX->new(Type => SOCK_DGRAM,
                   Local => "/var/log/snort/snort_alert")
  or die "Socket: $@";

print STDOUT "Socket Open ...
";

# Loop receiving data from the socket, pulling out the
# alert name and printing it.

my $data;

while ( true ) {
    recv($client,$data,1024,0);
    @FIELDS = unpack($TEMPLATE, $data);

    print "@FIELDS[0]
";

}

# At termination close up the socket again.

END {unlink "/var/log/snort/snort_alert";}
This code finds the alert name from the datagram sent and prints it out. Far more information is included in the datagram, including the raw packet data. This is left as an exercise for the reader to implement.
See Also
Christiansen, Tom and Nathan Torkington. “Recipe 17.6: Using Unix Domain Sockets.” In Perl Cookbook. Sebastopol, CA: O’Reilly, 2003.
2.24. Not Logging
Solution
Use the log_null output
plug-in. This allows you to create an alert that doesn’t create log
entries.
output log_null
Discussion
There are occasions when you might want to draw attention to an event, but not record it for future reference. This allows you to create a powerful monitoring system, but not to have to worry about using huge amounts of disk space logging everything.
See Also
Snort Users Manual
2.25. Prioritizing Alerts
Problem
You need to assign a priority to your alerts so that port scans aren’t getting you out of bed.
Discussion
The priority keyword only
changes the priority of the current rule. It has no effect on any of
the other rules.
For example, the following rule assigns a priority of 10 to an attempt to connect to a Telnet server:
alert tcp any any -> any 23 (msg: "Telnet attempt"; priority: 10;)
This has no effect other than marking the rule with a priority in the alert file. This is one of the packets from the previous alert rule:
[**] [1:0:0] Telnet attempt [**]
[Priority: 10]
11/02-13:42:39.806893 192.168.0.8:33175->192.168.0.25:23
TCP TTL:64 TOS:0x10 ID:53754 IpLen:20 DgmLen:52 DF
***A***F Seq: 0x1A3A5F77 Ack: 0x28166C84 Win: 0x16D0 TcpLen: 32
TCP Options (3) => NOP NOP TS: 1872654 15987586
You can see that the priority has been set to 10. You can then use this value in your other monitoring programs to determine whether an alert is worth escalating.
See Also
Snort Users Manual
2.26. Capturing Traffic from a Specific TCP Session
Solution
Use the session option in a
rule.
session: modifier;
For example, to capture only printable characters:
session: printable;
Discussion
The printable modifier
outputs all the printable text from a session. This is an incredibly
useful option for a plain-text session such as FTP or Telnet. It
allows you to view the content of an entire session. If the protocol
is a little more complex, use the all modifier to output all the data from the
session.
For example, the previous rule produces the following output in the log SESSION:
&& !"'#P 38400,38400#frodo:0'DISPLAYfrodo:0XTERMsimon^Mpassword^m
This shows all the Telnet sessions from the client to the
server, with the username and password obvious in clear text. If you
replace -> with <> to get both sides of the
conversation, it becomes a little clearer.
alert tcp any any <> any 23 ( msg: "Telnet"; session: printable;)
This gives the following :
&& !"'# #'&&!" #'P 38400,38400#frodo:0'DISPLAYfrodo:0XTERMFedora Core
release 2 (Tettnang)
Kernel 2.6.5-1.358 on an i686
login: ssiimmoonn^M
Password: password^M
Last login: Fri Jul 2 12:58:49 from 192.168.0.8
]0;simon@blackbox:~[simon@blackbox simon]$
which makes a little more sense, except for the doubled up letters when the letter is both sent from and returned to the Telnet client.
See Also
Snort Users Manual
2.27. Killing a Specific Session
Problem
You want to be able to close an active connection if specific criteria are met by a
rule. For example, you might want to close any Telnet session in which
the string /etc/passwd is
sent.
Discussion
resp allows you to create a
flexible response to end a TCP session on the triggering of an alert.
You can take your pick from the responses listed in Table 2-1.
All the actions listed in Table 2-1 can be combined by specifying them in sequence.
For example, to drop all connections from a certain host :
alert tcp 192.168.0.8 any -> any any (resp:rst_all;)
As you can combine the mechanisms, the following would have exactly the same effect:
Alert tcp 192.168.0.8 any -> any any (resp:rst_snd,rst_rcv;)
See Also
Snort Users Manual